. 2021 Aug 31;9(9):1846.
doi: 10.3390/microorganisms9091846.

Planktonic and Biofilm-Associated Pseudomonas aeruginosa and Staphylococcus epidermidis Elicit Differential Human Peripheral Blood Cell Responses

Affiliations

Planktonic and Biofilm-Associated Pseudomonas aeruginosa and Staphylococcus epidermidis Elicit Differential Human Peripheral Blood Cell Responses

Esingül Kaya et al. Microorganisms. .

Abstract

Despite the considerable progress made in recent years, our understanding of the human immune response to microbial biofilms is still poor. The aim of the present study was to compare the in vitro response of human peripheral blood mononuclear cells (PBMC) to biofilms and planktonic cells of Pseudomonas aeruginosa and Staphylococcus epidermidis, two bacterial species particularly relevant in patients with cystic fibrosis or undergoing endovascular catheterization, respectively. PBMC isolated from healthy donors were co-cultured with 24 h-old biofilms or with exponentially growing cells of both species. Following 24 h of co-culture, the expression of early activation markers and the levels of cytokines in the culture supernatants were assessed by flow cytometry, while biofilm biomass and architecture were evaluated by crystal violet staining, CFU count, and confocal microscopy. Around 20% of PBMC was activated in response to both biofilms and planktonic cells of P. aeruginosa. In contrast, planktonic cells of S. epidermidis induced a statistically higher degree of activation than their biofilm counterpart (25% versus 15%; p < 0.01). P. aeruginosa biofilms stimulated pro-inflammatory (TNF-α, IL-1β, IFN-γ, and IL-6) and anti-inflammatory (IL-10) cytokine production at statistically significant levels higher than its planktonic counterpart, while an opposite trend was observed with S. epidermidis. Differences in the architecture of the biofilms and in the number of PBMC infiltrating the biofilms between the two bacterial species may at least partially explain these findings. Collectively, the results obtained highlighted marked differences in the host-cell response depending on the species and the mode of growth (biofilms versus planktonic cultures), allowing speculations on the different strategies adopted by P. aeruginosa and S. epidermidis to persist in the host during the course of chronic infections.

Keywords: Pseudomonas aeruginosa; Staphylococcus epidermidis; biofilm; immune response; peripheral blood mononuclear cells; planktonic cells.


Conflict of interest statement

The authors declare no conflict of interest. The funders had no role in the design of the study, in the collection, analyses and interpretation of data, in the writing of the manuscript, or in the decision to publish the results.

Figures

Figure 1
Figure 1
Number of planktonic (PC) and biofilm-associated bacteria (IB) at time 0 of co-culture with PBMC (a) and the percent of live PBMC co-cultured with intact biofilm (PBMC + IB) or planktonic bacteria (PBMC + PC) for 24 h with respect to PBMC incubated in the absence of bacteria (b). Mean values ± SEM of n = 7 (P. aeruginosa) and n = 8 (S. epidermidis) independent experiments are shown. p > 0.05 for both bacteria species. Student’s t test for paired samples.
Figure 2
Figure 2
Expression of the early activation marker CD69 on PBMC stimulated for 24 h with intact biofilms (IB), disrupted biofilms (DB) or planktonic cells (PC). Unstimulated PBMC represented the negative controls. Mean values ± SEM from n = 7 (P. aeruginosa) and n = 8 (S. epidermidis) independent experiments are shown. * p < 0.05, ** p < 0.01, *** p < 0.001, ANOVA for matched samples followed by Bonferroni multiple comparisons test.
Figure 3
Figure 3
Percent of B lymphocytes among PBMC upon 24 h of incubation with intact biofilms (IB), disrupted biofilms (DB) or planktonic cells (PC). Mean values ± SEM from n = 7 (P. aeruginosa) and n = 8 (S. epidermidis) independent experiments are shown. * p < 0.05, ** p < 0.01, *** p < 0.001, ANOVA for matched samples followed by Bonferroni multiple comparisons test.
Figure 4
Figure 4
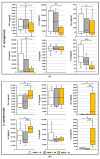
Activated cells (CD69+) among NK (CD56+/CD3-) cells and T (CD3+) cells. The percentage of activated (CD69+) cells within NK cell- and T cells, respectively, were calculated following 24 h of incubation of PBMC alone (PBMC only), with intact biofilm (PBMC + IB), disrupted biofilm (PBMC + DB), or planktonic cells (PBMC + PC) of P. aeruginosa (a) and S. epidermidis (b). Mean values ± SEM from n = 7 (P. aeruginosa) and n = 8 (S. epidermidis) independent experiments are shown. * p < 0.05, ** p < 0.01, *** p < 0.001, ANOVA for matched samples followed by Bonferroni multiple comparisons test.
Figure 5
Figure 5
Cytokine profiles of PBMC co-cultured for 24 h with intact biofilms (IB), disrupted biofilms (DB), and planktonic cells (PC) of P. aeruginosa (a) or S. epidermidis (b). The supernatants were collected following 24 h stimulation and the cytokine amount was evaluated by flow cytometer based multi-bead capture assay. Data are presented as the median and interquartile range from n = 7 (P. aeruginosa) and n = 8 (S. epidermidis) independent experiments. * p < 0.05, ** p < 0.01, *** p < 0.001, non-parametric ANOVA for matched samples and Dunn’s multiple comparisons test.
Figure 6
Figure 6
Characterization of P. aeruginosa and S. epidermidis biofilms. CLSM images of P. aeruginosa and S. epidermidis biofilms formed in complete RPMI 1640 medium at 24 (a) and 48 (b) h of incubation. Mature biofilms of P. aeruginosa and S. epidermidis were rinsed once to remove bacteria in the supernatant. After washing, biofilms were stained with green fluorescent labeled Syto9 (488/500–540 nm) (staining all the bacteria) and with red fluorescent propidium iodide (PI, 488/600–650 nm) (staining dead bacteria). Dashed square indicates the 3× zoomed area. Scale bar = 20 µm. In parallel wells, incubated in the same experimental conditions, the following were determined: total biomass of P. aeruginosa (green bars) and S. epidermidis (orange bars) biofilms by crystal violet (CV) staining (c); live biofilm-associated bacteria by CFU counting (d); and CV/CFU ratio by dividing the CV OD570 values to CFU counts (in million) (e). Mean values ± SEM from four wells for each species are shown from a representative experiment. PI data is not visible in the figure as for both species almost all bacteria within the biofilms were alive.
Figure 7
Figure 7
Live CLSM imaging of PBMC interacting with P. aeruginosa and S. epidermidis biofilms formed in complete RPMI 1640 medium. 24 h-old P. aeruginosa or S. epidermidis biofilms were labeled with 2 × 10⁻⁶ M green fluorescent lipophilic dye PKH67 (Merck), according to the manufacturer’s instructions, washed, and PBMC (2 × 10⁶ cells/mL, 4 × 10⁵ PBMC/well) prelabeled with 2 × 10⁻⁶ M orange/red lipophilic dye PKH26 (Merck) were added into the wells. Immediately after the addition of the cells, a time-lapse live imaging (nine plane confocal images at 63× magnification for each biofilm, every 5 min, for up to 150 min. at 37 °C with 5.5% CO2 atmosphere) of the co-cultures was performed. (a) PBMC infiltrating plane 5 at 30, 60, 90, and 120 min. for P. aeruginosa or S. epidermidis biofilms are shown from a representative experiment. (b) Further 4× digital magnification of PBMC infiltrating P. aeruginosa biofilm. (c) Number of PBMC infiltrating plane 5. Scale bar = 20 µm.
Figure 8
Figure 8
Hypothesis based on the results of the present study on the different strategies adopted by S. epidermidis and P. aeruginosa biofilms to establish long lasting relationship with the host and possible clinical outcomes.

References

    1. Høiby N., Ciofu O., Johansen H.K., Song Z.J., Moser C., Jensen P.Ø., Molin S., Givskov M., Tolker-Nielsen T., Bjarnsholt T. The clinical impact of bacterial biofilms. Int. J. Oral Sci. 2011;3:55–65. doi: 10.4248/IJOS11026. - DOI - PMC - PubMed
    1. Percival S.L., Suleman L., Vuotto C., Donelli G. Healthcare-associated infections, medical devices and biofilms: Risk, tolerance and control. J. Med. Microbiol. 2015;64:323–334. doi: 10.1099/jmm.0.000032. - DOI - PubMed
    1. Wilkins M., Hall-Stoodley L., Allan R.N., Faust S.N. New approaches to the treatment of biofilm-related infections. J. Infect. 2014;69:47–52. doi: 10.1016/j.jinf.2014.07.014. - DOI - PubMed
    1. Khan F., Pham D.T.N., Oloketuyi S.F., Kim Y.M. Antibiotics application strategies to control biofilm formation in pathogenic bacteria. Curr. Pharm. Biotechnol. 2020;21:270–286. doi: 10.2174/1389201020666191112155905. - DOI - PubMed
    1. Campoccia D., Mirzaei R., Montanaro L., Arciola C.R. Hijacking of immune defences by biofilms: A multifront strategy. Biofouling. 2019;35:1055–1074. doi: 10.1080/08927014.2019.1689964. - DOI - PubMed

LinkOut - more resources