

Markov State Models and Molecular Dynamics Simulations Provide Understanding of the Nucleotide-Dependent Dimerization-Based Activation of LRRK2 ROC Domain
- PMID: 34577121
- PMCID: PMC8467336
- DOI: 10.3390/molecules26185647
Markov State Models and Molecular Dynamics Simulations Provide Understanding of the Nucleotide-Dependent Dimerization-Based Activation of LRRK2 ROC Domain
Abstract
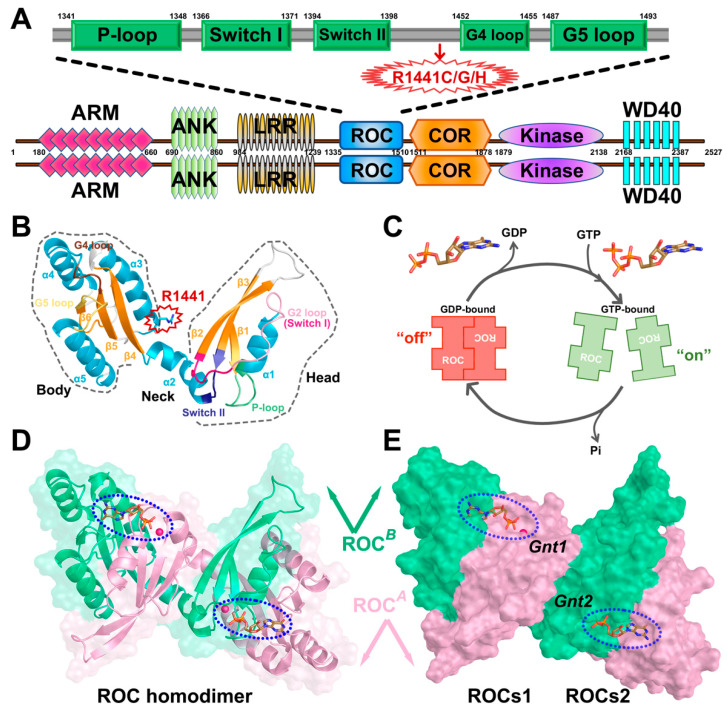
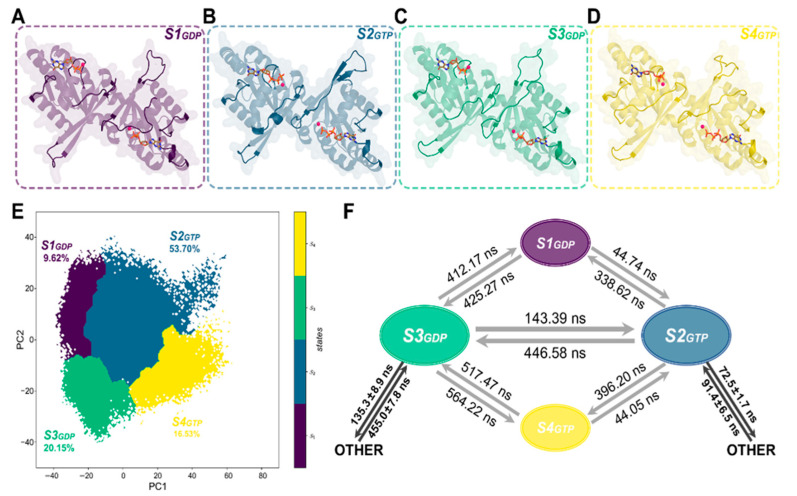
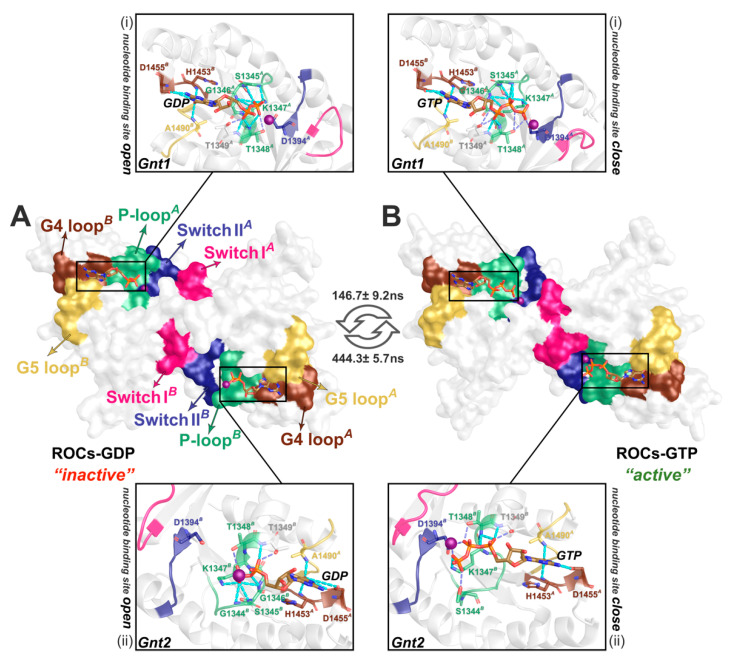
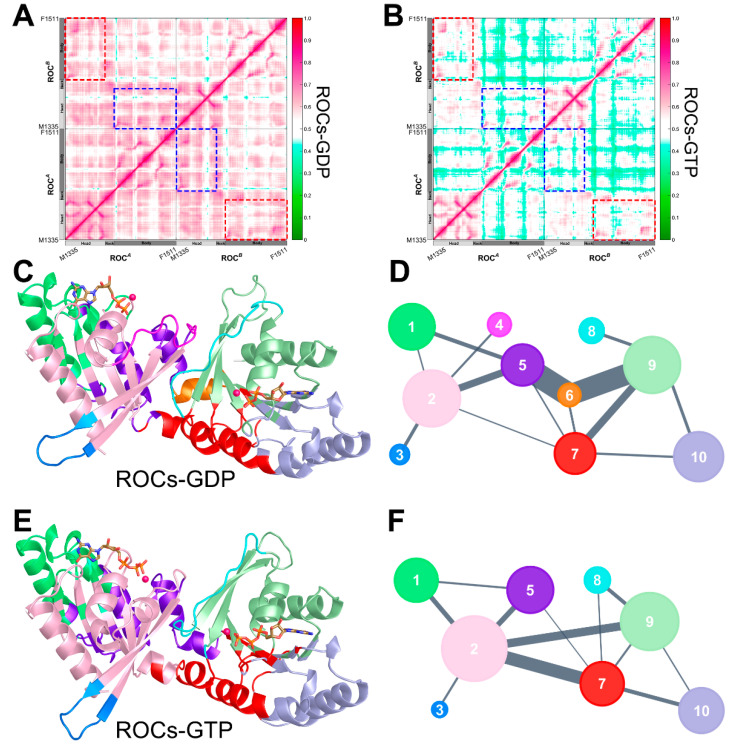
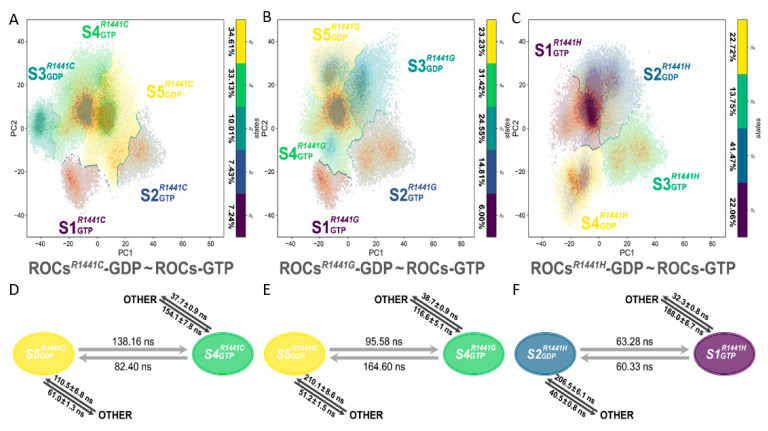
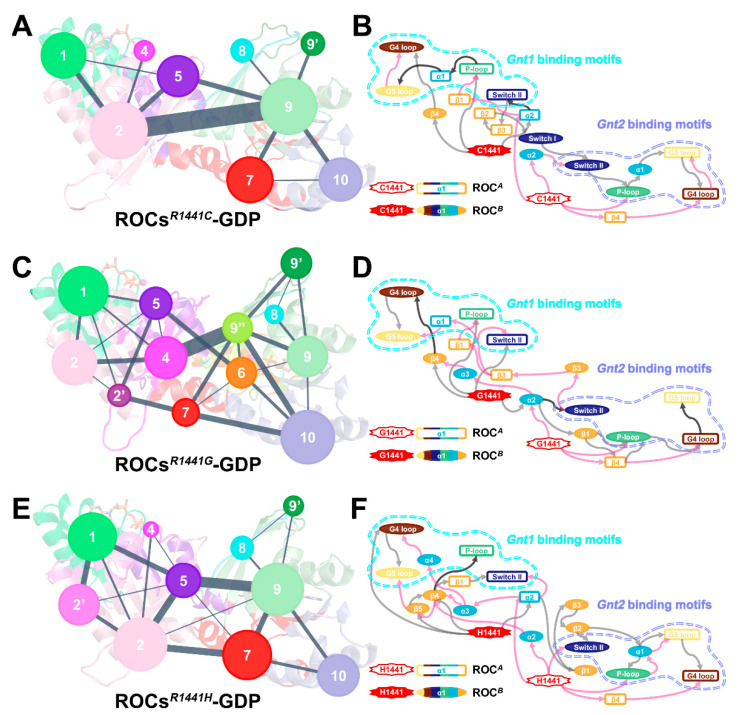
Mutations in leucine-rich repeat kinase 2 (LRRK2) are recognized as the most frequent cause of Parkinson's disease (PD). As a multidomain ROCO protein, LRRK2 is characterized by the presence of both a Ras-of-complex (ROC) GTPase domain and a kinase domain connected through the C-terminal of an ROC domain (COR). The bienzymatic ROC-COR-kinase catalytic triad indicated the potential role of GTPase domain in regulating kinase activity. However, as a functional GTPase, the detailed intrinsic regulation of the ROC activation cycle remains poorly understood. Here, combining extensive molecular dynamics simulations and Markov state models, we disclosed the dynamic structural rearrangement of ROC's homodimer during nucleotide turnover. Our study revealed the coupling between dimerization extent and nucleotide-binding state, indicating a nucleotide-dependent dimerization-based activation scheme adopted by ROC GTPase. Furthermore, inspired by the well-known R1441C/G/H PD-relevant mutations within the ROC domain, we illuminated the potential allosteric molecular mechanism for its pathogenetic effects through enabling faster interconversion between inactive and active states, thus trapping ROC in a prolonged activated state, while the implicated allostery could provide further guidance for identification of regulatory allosteric pockets on the ROC complex. Our investigations illuminated the thermodynamics and kinetics of ROC homodimer during nucleotide-dependent activation for the first time and provided guidance for further exploiting ROC as therapeutic targets for controlling LRRK2 functionality in PD treatment.
Keywords: Markov state models; Parkinson’s disease; Ras-of-complex GTPase domain; leucine-rich repeat kinase 2 (LRRK2); molecular dynamics (MD) simulations; network analysis.
Conflict of interest statement
The authors declare no conflict of interest.
Figures
Similar articles
-
The Roc-COR tandem domain of leucine-rich repeat kinase 2 forms dimers and exhibits conventional Ras-like GTPase properties.J Neurochem. 2018 Nov;147(3):409-428. doi: 10.1111/jnc.14566. J Neurochem. 2018. PMID: 30091236
-
Understanding the GTPase Activity of LRRK2: Regulation, Function, and Neurotoxicity.Adv Neurobiol. 2017;14:71-88. doi: 10.1007/978-3-319-49969-7_4. Adv Neurobiol. 2017. PMID: 28353279 Free PMC article. Review.
-
Conformational heterogeneity of the Roc domains in C. tepidum Roc-COR and implications for human LRRK2 Parkinson mutations.Biosci Rep. 2015 Aug 26;35(5):e00254. doi: 10.1042/BSR20150128. Biosci Rep. 2015. PMID: 26310572 Free PMC article.
-
The Parkinson's disease-associated mutation N1437H impairs conformational dynamics in the G domain of LRRK2.FASEB J. 2019 Apr;33(4):4814-4823. doi: 10.1096/fj.201802031R. Epub 2018 Dec 28. FASEB J. 2019. PMID: 30592623 Free PMC article.
-
L'RRK de Triomphe: a solution for LRRK2 GTPase activity?Biochem Soc Trans. 2016 Dec 15;44(6):1625-1634. doi: 10.1042/BST20160240. Biochem Soc Trans. 2016. PMID: 27913671 Review.
Cited by
-
Insights into the Allosteric Effect of SENP1 Q597A Mutation on the Hydrolytic Reaction of SUMO1 via an Integrated Computational Study.Molecules. 2022 Jun 28;27(13):4149. doi: 10.3390/molecules27134149. Molecules. 2022. PMID: 35807394 Free PMC article.
-
Deciphering the Mechanism of Gilteritinib Overcoming Lorlatinib Resistance to the Double Mutant I1171N/F1174I in Anaplastic Lymphoma Kinase.Front Cell Dev Biol. 2021 Dec 23;9:808864. doi: 10.3389/fcell.2021.808864. eCollection 2021. Front Cell Dev Biol. 2021. PMID: 35004700 Free PMC article.
-
Deciphering allosteric mechanisms in KRAS activation: insights from GTP-induced conformational dynamics and interaction network reorganization.RSC Adv. 2025 Jan 23;15(3):2261-2274. doi: 10.1039/d4ra07924h. eCollection 2025 Jan 16. RSC Adv. 2025. PMID: 39850080 Free PMC article.
-
Understanding gilteritinib resistance to FLT3-F691L mutation through an integrated computational strategy.J Mol Model. 2022 Aug 6;28(9):247. doi: 10.1007/s00894-022-05254-0. J Mol Model. 2022. PMID: 35932378
-
Elucidation of the conformational dynamics and assembly of Argonaute-RNA complexes by distinct yet coordinated actions of the supplementary microRNA.Comput Struct Biotechnol J. 2022 Mar 7;20:1352-1365. doi: 10.1016/j.csbj.2022.03.001. eCollection 2022. Comput Struct Biotechnol J. 2022. PMID: 35356544 Free PMC article.
References
-
- Wu C.X., Liao J., Park Y., Reed X., Engel V.A., Hoang N.C., Takagi Y., Johnson S.M., Wang M., Federici M., et al. Parkinson’s disease-associated mutations in the GTPase domain of LRRK2 impair its nucleotide-dependent conformational dynamics. J. Biol. Chem. 2019;294:5907–5913. doi: 10.1074/jbc.RA119.007631. - DOI - PMC - PubMed
-
- Halli-Tierney A.D., Luker J., Carroll D.G. Parkinson Disease. Am. Fam. Physician. 2020;102:679–691. - PubMed
MeSH terms
Substances
LinkOut - more resources
Full Text Sources
Research Materials
