. 2021 Sep 17;26(18):5655.
doi: 10.3390/molecules26185655.

Oclacitinib, a Janus Kinase Inhibitor, Reduces the Frequency of IL-4- and IL-10-, but Not IFN-γ-, Producing Murine CD4+ and CD8+ T Cells and Counteracts the Induction of Type 1 Regulatory T Cells

Affiliations

Oclacitinib, a Janus Kinase Inhibitor, Reduces the Frequency of IL-4- and IL-10-, but Not IFN-γ-, Producing Murine CD4+ and CD8+ T Cells and Counteracts the Induction of Type 1 Regulatory T Cells

Agnieszka Jasiecka-Mikołajczyk et al. Molecules. .

Abstract

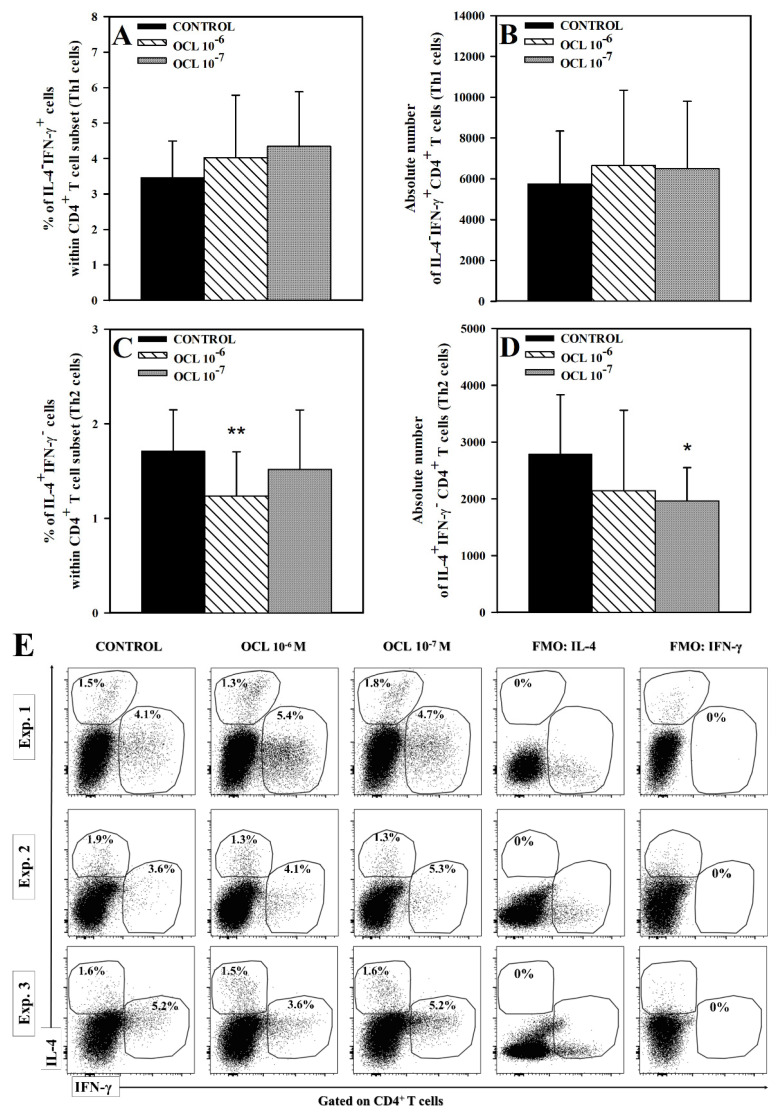
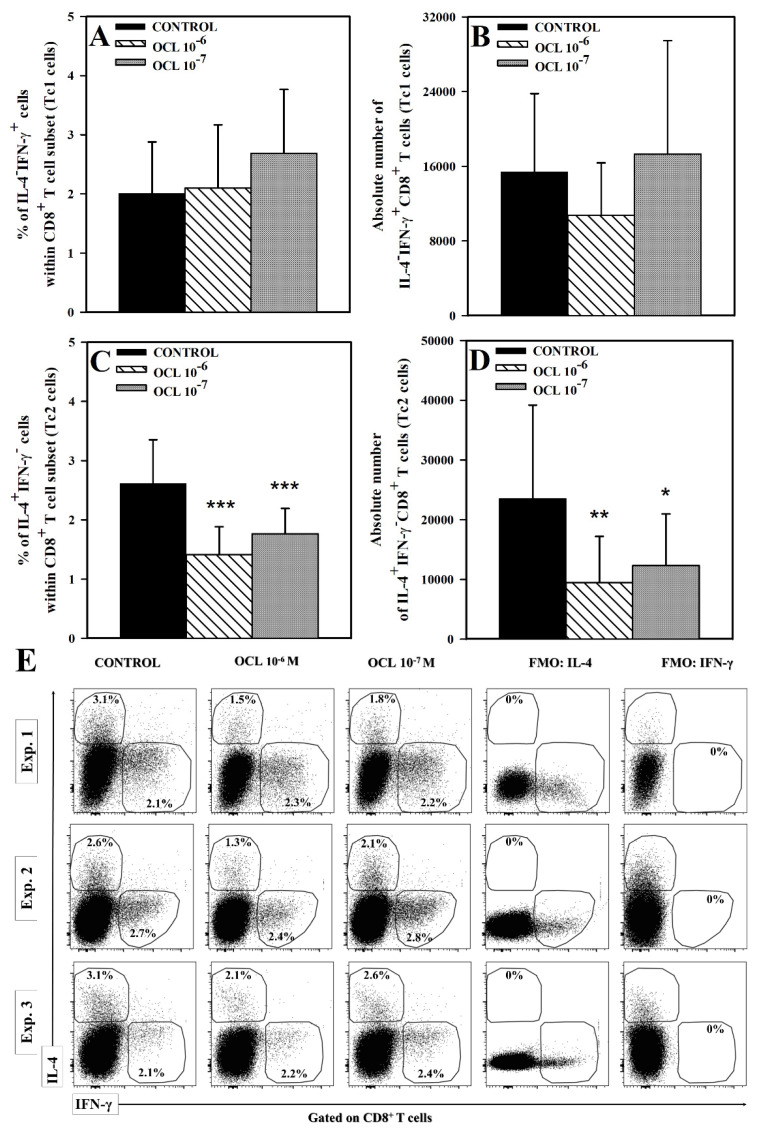
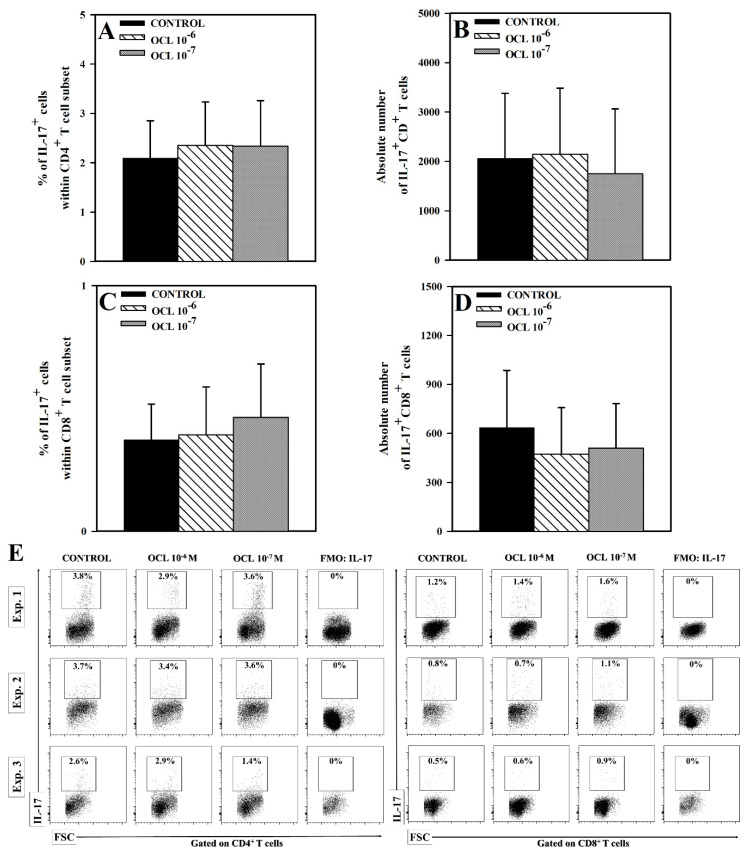
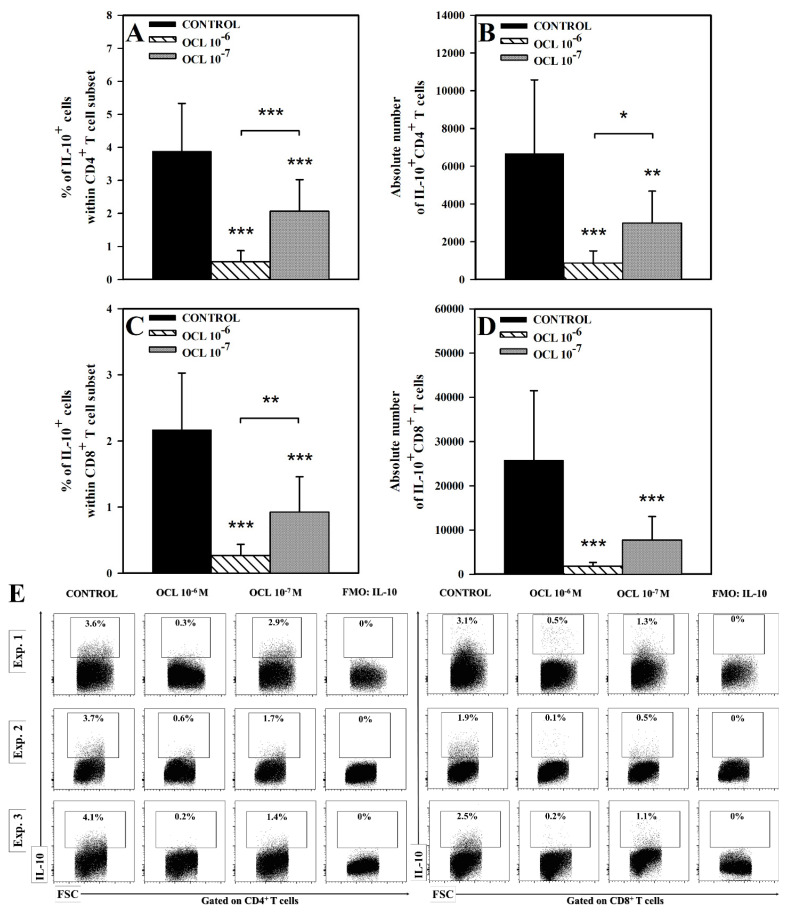
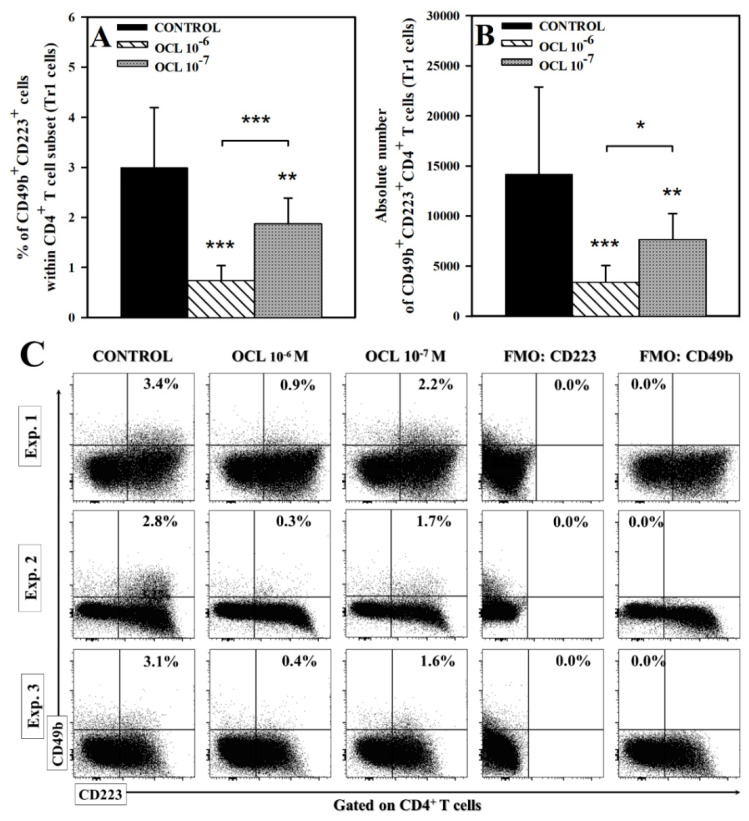
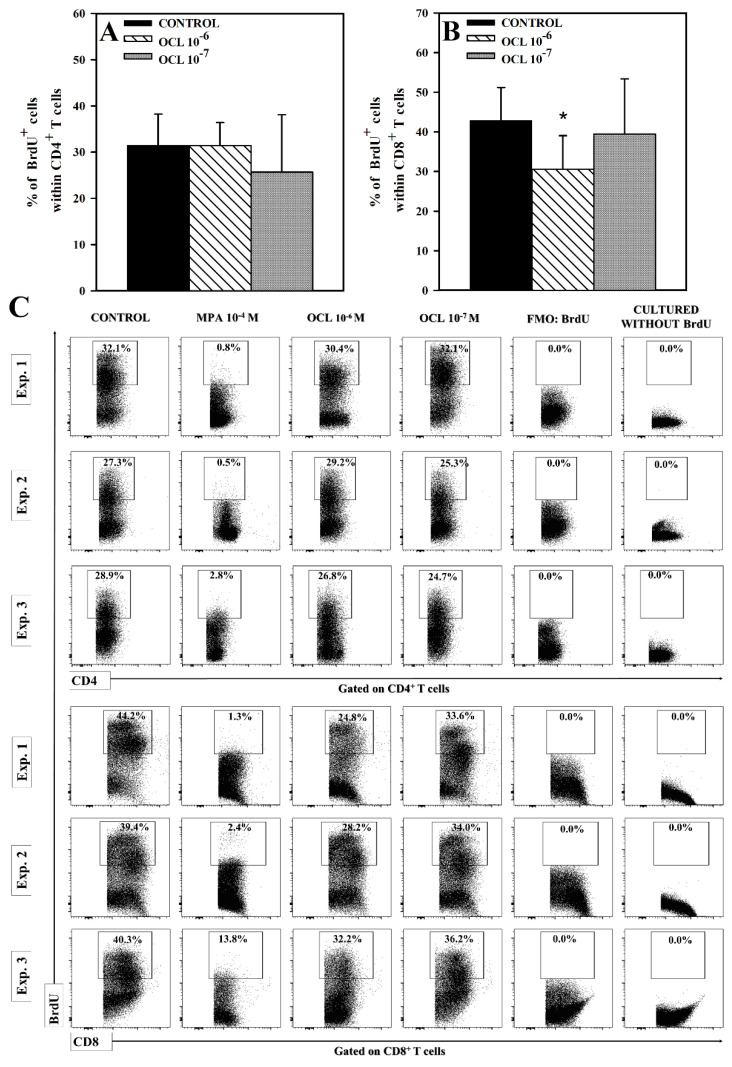
The purpose of the present study was to broaden the knowledge and understanding of the effects of oclacitinib (OCL), a Janus kinase inhibitor, on T cells in the context of both the immune mechanisms underlying anti-inflammatory and anti-allergic properties of the drug and its safety. The results indicate that beneficial effects of OCL in the treatment of skin allergic diseases may be partially mediated by the inhibition of IL-4 production in CD4+ and CD8+ T cells. To a certain extent, the antiproliferative effect of OCL on CD8+ T cells may also contribute to its therapeutic effect. The study found that OCL does not affect the proliferation of CD4+ T cells or the number of IFN-γ- and IL-17-producing CD4+ and CD8+ T cells. Moreover, OCL was found to counteract the induction of type 1 regulatory T (Tr1) cells and to act as a strong inhibitor of IL-10 production in both CD4+ and CD8+ T cells. Thus, these results indicate that beneficial effects of OCL in the treatment of skin allergic diseases are not mediated through: (a) the abolishment of IFN-γ and IL-17-production in CD4+ and CD8+ T cells; (b) generation of Tr1 cells; (c) inhibition of CD4+ T cell proliferation; (d) induction of IL-10 production in CD4+ T cells. The results of this study strongly suggest that, with respect to the evaluated parameters, OCL exerts a suppressive effect on Th2- but not Th1-mediated immunity.

Keywords: CD4+ cells; CD8+ cells; JAK; cytokines; oclacitinib.


Conflict of interest statement

The authors declare no conflict of interest.

Figures

Figure 1
Figure 1
Effect of oclacitinib (OCL) on the number of IFN-γ- and IL-4-producing CD4+ T cells. The relative (A,C) and absolute count (B,D) of IFN-γ- and IL-4-producing CD4+ T cells were determined in cell cultures incubated with or without (control) OCL (10−6 M and 10−7 M). The relative count is expressed as a percentage of IFN-γ- or IL-4-producing cells within CD4+ T cells. The absolute count represents the number of IL-4IFN-γ+CD4+ and IL-4+IFN-γCD4+ T cells per sample well. Cells with such phenotypes should be equated with Th1 and Th2 cells, respectively. Results are expressed as the mean (± S.D.) of three independent experiments with 5 mice per experiment (overall n = 15, * p < 0.05, ** p < 0.01, control cells vs OCL-treated (10−6 or 10−7 M) cells (Student’s unpaired t-test). Examples of dot plot cytograms show the distribution of IFN-γ- and IL-4-producing and non-producing cells within CD4+ T cell subset (E). Fluorescence minus one (FMO) controls were applied to confirm the gating strategy used to identify IFN-γ+ and IL-4+ cells.
Figure 2
Figure 2
Effect of oclacitinib (OCL) on the number of IFN-γ- and IL-4-producing CD8+ T cells. The relative (A,C) and absolute count (B,D) of IFN-γ- and IL-4-producing CD8+ T cells were determined in cell cultures incubated with or without (control) OCL (10−6 M and 10−7 M). The relative count is expressed as a percentage of IFN-γ- or IL-4- producing cells within CD8+ T cells. The absolute count represents the number of IL-4IFN-γ+CD8+ and IL-4+IFN-γCD8+ T cells per sample well. Cells with such phenotypes should be equated with Tc1 and Tc2 cells, respectively. Results are expressed as the mean (± S.D.) of three independent experiments with 5 mice per experiment (overall n = 15, * p < 0.05, ** p < 0.01, *** p < 0.001, control cells vs OCL-treated (10−6 or 10−7 M) cells (Student’s unpaired t-test)). Examples of dot plot cytograms show the distribution of IFN-γ- and IL-4-producing and non-producing cells within CD8+ T cell subset (E). Fluorescence minus one (FMO) controls were applied to confirm the gating strategy used to identify IFN-γ+ and IL-4+ cells.
Figure 3
Figure 3
Effect of oclacitinib (OCL) on the number of IL-17-producing CD4+ and CD8+ T cells. The relative (A,C) and absolute count (B,D) of IL-17-producing CD4+ and CD8+ T cells were determined in cell cultures incubated with or without (control) OCL (10−6 M and 10−7 M). The relative count is expressed as a percentage of IL-17-producing cells within CD4+ and CD8+ T cells. The absolute count represents the number of IL-17+CD4+ and IL-17+CD8+ T cells per sample well. Cells with such phenotypes should be equated with Th17 and Tc17 cells, respectively. Results are expressed as the mean (±S.D.) of three independent experiments with 5 wells per experiment (overall n = 15). Examples of dot plot cytograms show the distribution of IL-17-producing and non-producing cells within CD4+ and CD8+ T cell subset (E). Fluorescence minus one (FMO) controls were applied to confirm the gating strategy used to identify IL-17+ cells.
Figure 4
Figure 4
Effect of oclacitinib (OCL) on the number of IL-10-producing CD4+ and CD8+ T cells. The relative (A,C) and absolute count (B,D) of IL-10-producing CD4+ and CD8+ T cells were determined in cell cultures incubated with or without (control) OCL (10−6 M and 10−7 M). The relative count is expressed as a percentage of IL-10-producing cells within CD4+ and CD8+ T cells. The absolute count represents the number of IL-10+CD4+ and IL-10+CD8+ T cells per sample well. Results are expressed as the mean (±S.D.) of three independent experiments with 5 mice per experiment (overall n = 15, * p < 0.05, ** p < 0.01, *** p < 0.001, control cells vs OCL-treated (10−6 or 10−7 M) cells (Student’s unpaired t-test), or OCL 10−6-treated vs OCL-10−7-treated cells (one way ANOVA with Holm-Sidak multiple comparison test)). Examples of dot plot cytograms show the distribution of IL-10-producing and non-producing cells within CD4+ and CD8+ T cell subset (E). Fluorescence minus one (FMO) controls were applied to confirm the gating strategy used to identify IL-10+ cells.
Figure 5
Figure 5
Effect of oclacitinib (OCL) on the number of CD49b+CD223+CD4+ T cells. The relative (A) and absolute count (B) of CD49b+CD223+CD4+ cells were determined in cell cultures incubated with or without (control) OCL (10−6 M and 10−7 M). The relative count is expressed as a percentage of CD49b+CD223+ cells within CD4+ T cell subset. The absolute count represents the number of CD49b+CD223+CD4+ T cells per sample well. Cells with such a phenotype should be equated with Tr1 cells. Results are expressed as the mean (±S.D.) of three independent experiments with 5 mice per experiment (overall n = 15, * p < 0.05, ** p < 0.01, *** p < 0.001, control cells vs OCL-treated (10−6 or 10−7 M) cells (Student’s unpaired t-test), or OCL 10−6-treated vs OCL-10−7-treated cells (one way ANOVA with Holm-Sidak multiple comparison test)). Examples of dot plot cytograms show the distribution of CD49b+CD223+ cells among CD4+ T cell subset (C). Fluorescence minus one (FMO) controls were applied to confirm the gating strategy used to identify CD49b+CD223+ cells.
Figure 6
Figure 6
Effect of oclacitinib (OCL) on the proliferation of CD4+ (A) and CD8+ (B) T cells. The relative count of 5-bromo-2’-deoxyuridine(BrdU)-incorporating cells among CD4+ and CD8+ T cells was determined in cell cultures incubated with or without (control) OCL (106 M and 107 M). Results are the mean (± S.D.) of three independent experiments with 5 mice per experiment (overall n = 15, * p < 0.001, control cells vs OCL-treated (10−6 or 10−7 M) cells (Student’s unpaired t-test)). Examples of dot plot cytograms show the distribution of BrdU-positive and -negative cells within CD4+ and CD8+ T cell subsets (C). Fluorescence minus one (FMO) controls as well as cultured cells without BrdU were used to confirm the gating strategy used to identify BrdU+ cells. Cells treated with mycophenolic acid (MPA, an active metabolite of the prodrug mycophenolate mofetil), i.e., the agent with the proved antiproliferative activity to T cells, constituted an additional negative as well as a reference control.
Figure 7
Figure 7
Gating strategy for flow cytometric data analysis and calculation of the absolute cell counts of lymphocyte subsets. Lymphocytes were identified based on forward and side scatter (FSC/SSC) properties, and then gated for expression of CD4 or CD8 surface receptors. Subsequently, IL-4-, IL-10-, IL-17- and IFN-γ-producing cells as well as CD49b+CD223+-expressing and 5-bromo-2’-deoxyuridine(BrdU)-incorporating cells were identified within particular T cell subsets. Absolute cell counts of lymphocyte subsets (i.e., number of cells from particular subpopulations per sample well) were calculated using the dual platform method, as shown above.

References

    1. Gonzales A.J., Bowman J.W., Fici G.J., Zhang M., Mann D.W., Mitton-Fry M. Oclacitinib (APOQUEL(®)) is a novel Janus kinase inhibitor with activity against cytokines involved in allergy. J. Vet. Pharmacol. Ther. 2014;37:317–324. doi: 10.1111/jvp.12101. - DOI - PMC - PubMed
    1. Chiricozzi A., Pitocco R., Saraceno R., Nistico S.P., Giunta A., Chimenti S. New topical treatments for psoriasis. Expert Opin. Pharmacother. 2014;15:461–470. doi: 10.1517/14656566.2014.875159. - DOI - PubMed
    1. Wang H., Brown J., Gao S., Liang S., Jotwani R., Zhou H., Suttles J., Scott D.A., Lamont R.J. The Role of JAK-3 in Regulating TLR-Mediated Inflammatory Cytokine Production in Innate Immune Cells. J. Immunol. 2013;191:1164–1174. doi: 10.4049/jimmunol.1203084. - DOI - PMC - PubMed
    1. Hodge J.A., Kawabata T.T., Krishnaswami S., Clark J.D., Telliez J.B., Dowty M.E., Menon S., Lamba M., Zwillich S. The mechanism of action of tofacitinib—An oral Janus kinase inhibitor for the treatment of rheumatoid arthritis. Clin. Exp. Rheumatol. 2016;34:318–328. - PubMed
    1. Hammitzsch A., Chen L., de Wit J., Al-Mossawi M.H., Ridley A., Sekine T., Simone D., Doig K., Skapenko A., Bowness P. Inhibiting ex-vivo Th17 responses in Ankylosing Spondylitis by targeting Janus kinases. Sci. Rep. 2018;8:15645. doi: 10.1038/s41598-018-34026-1. - DOI - PMC - PubMed

MeSH terms