. 2021 Sep 18;26(18):5674.
doi: 10.3390/molecules26185674.

Flaxseed Increases Animal Lifespan and Reduces Ovarian Cancer Severity by Toxically Augmenting One-Carbon Metabolism

Affiliations

Flaxseed Increases Animal Lifespan and Reduces Ovarian Cancer Severity by Toxically Augmenting One-Carbon Metabolism

William C Weston et al. Molecules. .

Abstract

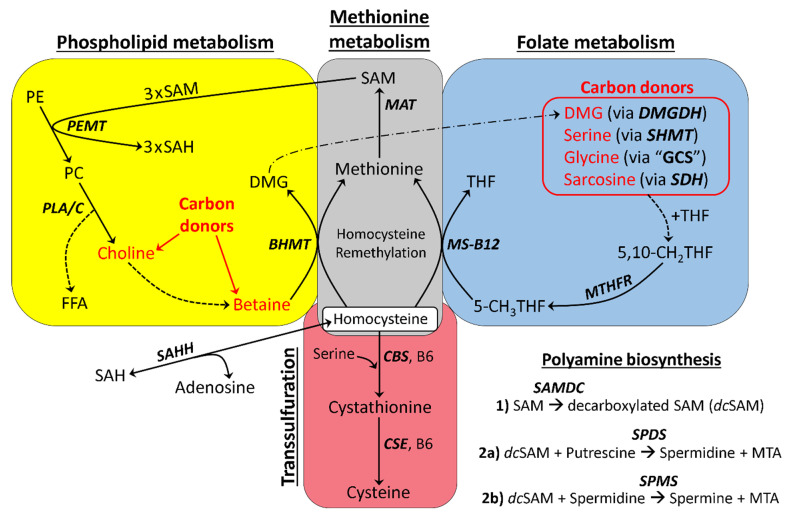
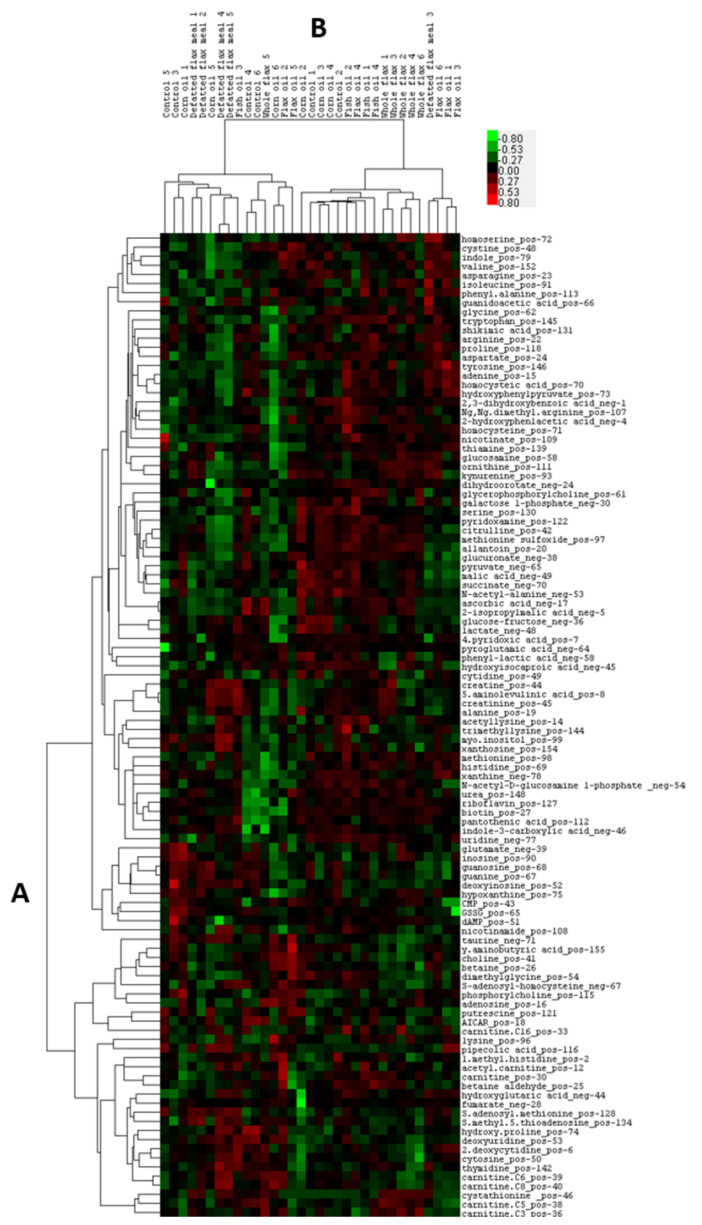
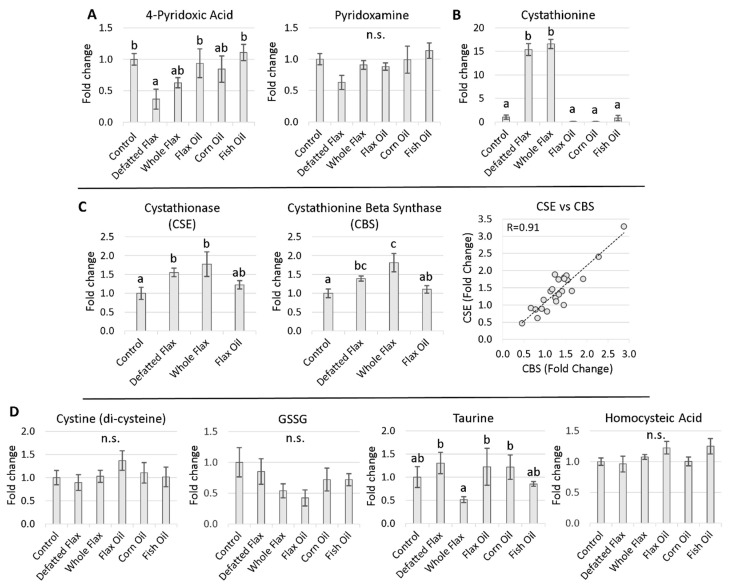
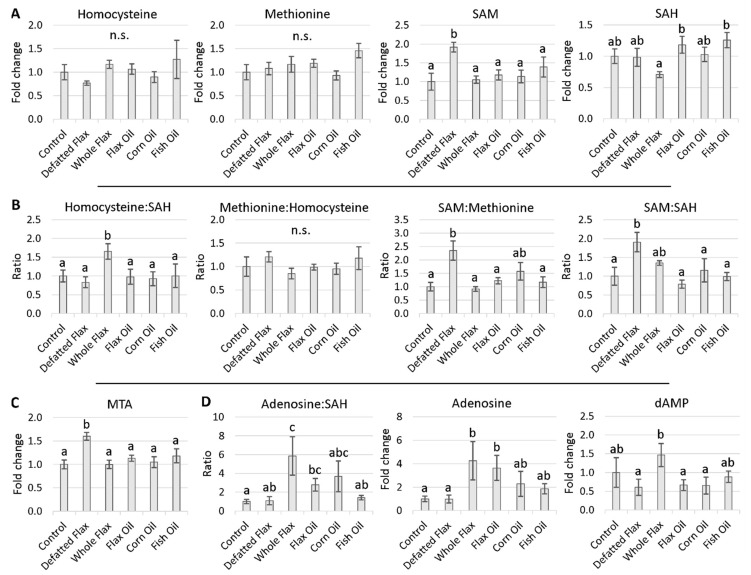
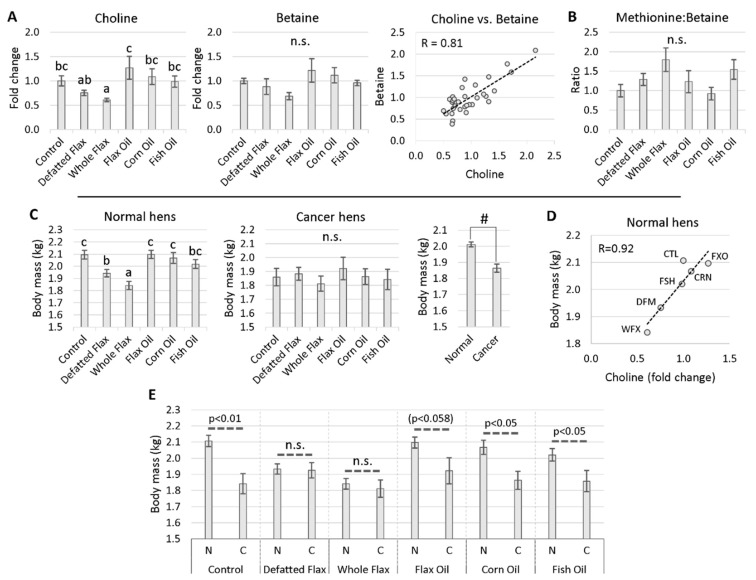
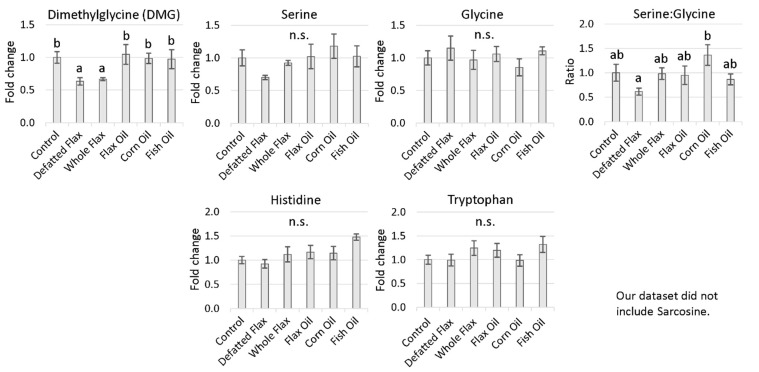
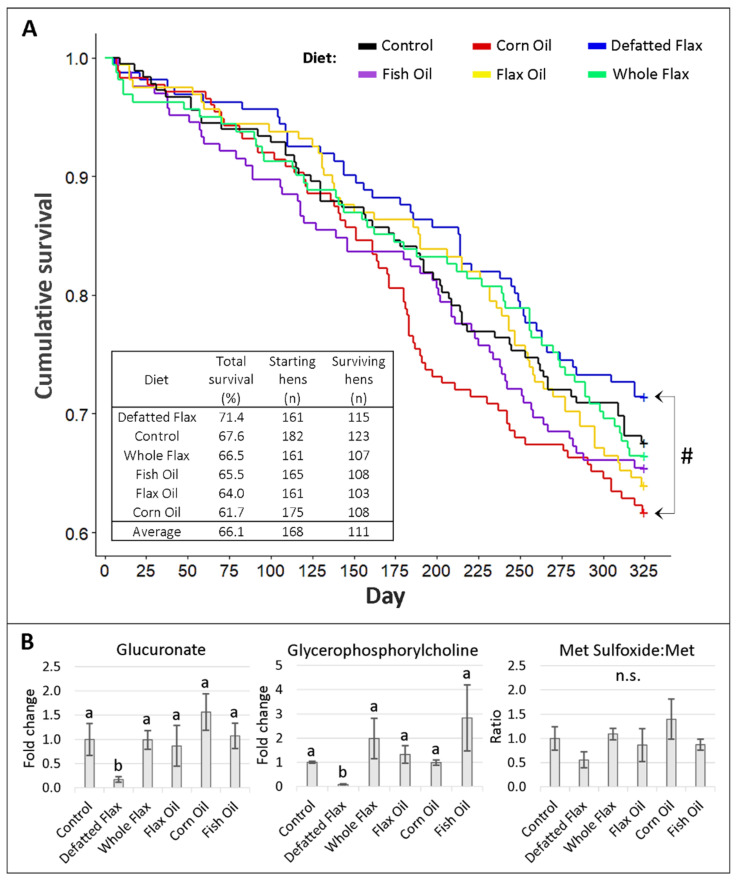
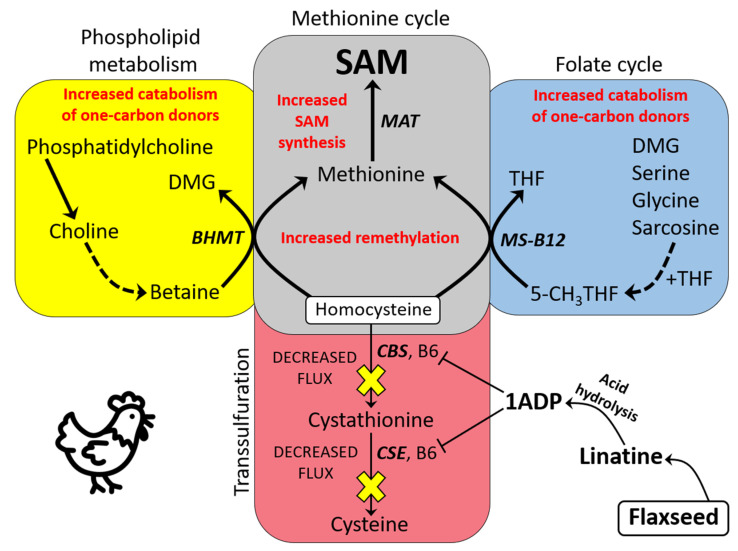
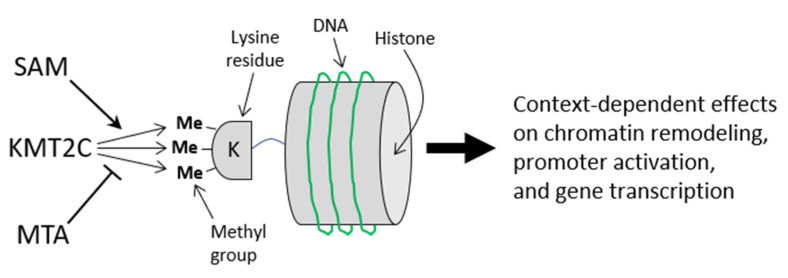
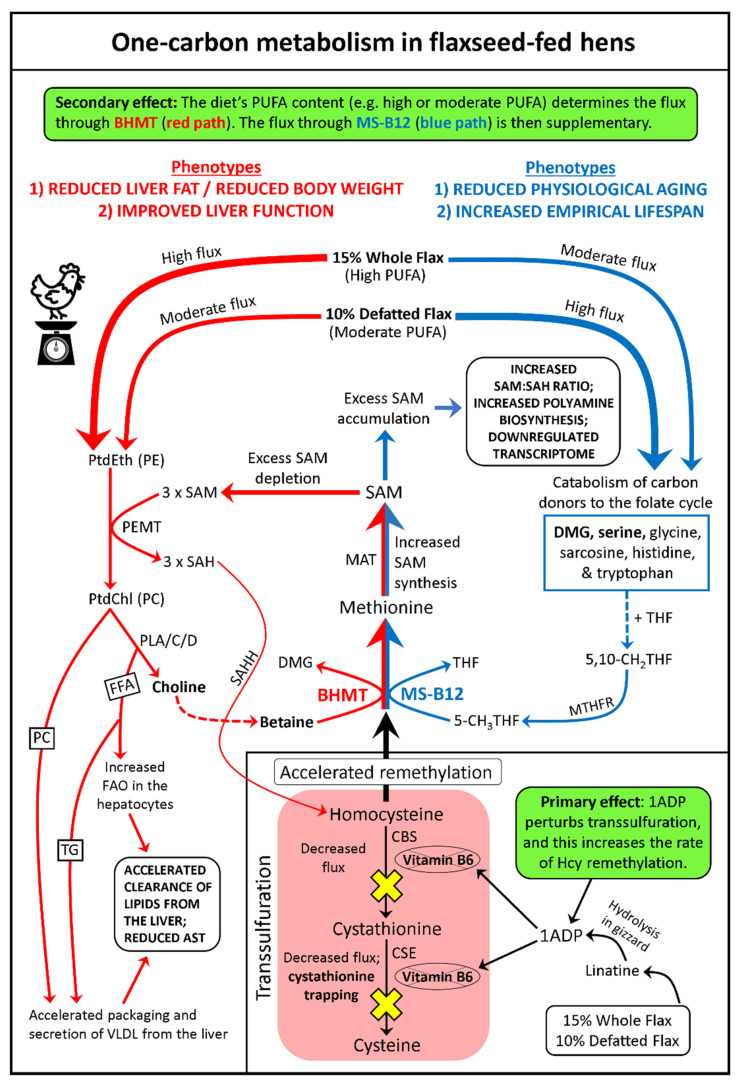
We used an LC-MS/MS metabolomics approach to investigate one-carbon metabolism in the plasma of flaxseed-fed White Leghorn laying hens (aged 3.5 years). In our study, dietary flaxseed (via the activity of a vitamin B6 antagonist known as "1-amino d-proline") induced at least 15-fold elevated plasma cystathionine. Surprisingly, plasma homocysteine (Hcy) was stable in flaxseed-fed hens despite such highly elevated cystathionine. To explain stable Hcy, our data suggest accelerated Hcy remethylation via BHMT and MS-B12. Also supporting accelerated Hcy remethylation, we observed elevated S-adenosylmethionine (SAM), an elevated SAM:SAH ratio, and elevated methylthioadenosine (MTA), in flaxseed-fed hens. These results suggest that flaxseed increases SAM biosynthesis and possibly increases polyamine biosynthesis. The following endpoint phenotypes were observed in hens consuming flaxseed: decreased physiological aging, increased empirical lifespan, 9-14% reduced body mass, and improved liver function. Overall, we suggest that flaxseed can protect women from ovarian tumor metastasis by decreasing omental adiposity. We also propose that flaxseed protects cancer patients from cancer-associated cachexia by enhancing liver function.

Keywords: aging; cancer; chicken; diet; flaxseed; lifespan; liver; metabolism; nutrition; ovarian.


Conflict of interest statement

The authors declare no conflict of interest.

Figures

Figure 1
Figure 1
Simplified model of one-carbon metabolism: The irreversible oxidation of Hcy to cystathionine requires the B6-dependent enzyme CBS. Likewise, the oxidation of cystathionine to cysteine requires the B6-dependent enzyme CSE. The BHMT reaction utilizes betaine (which is derived from choline) as a methyl group donor, while MS-B12 utilizes 5-CH3THF as a methyl group donor. Specific molecules (e.g., DMG, serine, glycine, and sarcosine) act as carbon donors in the presence of THF to form 5,10-CH2THF in the folate cycle. 5,10-CH2THF contributes directly or indirectly (depending on mitochondrial or cytosolic localization) to the formation of 5-CH3THF, via MTHFR. After Hcy is remethylated via BHMT or MS-B12, the newly formed Met can be adenosylated via MAT to form SAM. Three molecules of SAM are consumed via the PEMT reaction, which produces one molecule of PC and three molecules of SAH. SAH is then hydrolyzed via the bidirectional enzyme SAHH, to yield adenosine and Hcy. BHMT = betaine homocysteine methyltransferase; CBS = cystathionine beta synthase; CSE = cystathionase; dcSAM = decarboxylated SAM; DMG = dimethylglycine; FFA = free fatty acid; Hcy = homocysteine; Met = methionine; MS-B12 = methionine synthase complexed with vitamin B12; MTA = methylthioadenosine; MTHFR = methylene tetrahydrofolate reductase; PC = phosphatidylcholine; PE = phosphatidylethanolamine; PLA/C/D = phospholipase A, C, or D; SAH = S-adenosylhomocysteine; SAHH = S-adenosylhomocysteine hydrolase; SAM = S-adenosylmethionine; SAMDC = SAM decarboxylase; SPDS = spermidine synthase; SPMS = spermine synthase; THF = tetrahydrofolate.
Figure 2
Figure 2
Heatmap illustrating grouped hierarchies of metabolites by diet group: Metabolites (n = 108 metabolites) from hen plasma were analyzed via LC-MS/MS and organized based on the clustering of their VIP scores across diet. In dendrogram (A), metabolites are organized according to their similarity across diet samples. In dendrogram (B), diet samples are organized according to their similarity across metabolites. Green illustrates below average standard deviation, and red illustrates above average standard deviation.
Figure 3
Figure 3
Estimates of vitamin B6 metabolism, transsulfuration, and sulfur-based metabolites generated downstream of transsulfuration: Hen plasma samples were measured via LC-MS/MS. Plasma markers for B6 metabolism were measured (A). Plasma markers for transsulfuration flux were also measured (B). Gene transcripts for CBS and CSE were measured in hen liver homogenates via qPCR (using GAPDH as reference) (C). Thiol metabolites that were generated subsequent to transsulfuration were measured (D). VIP scores of plasma metabolites and fold changes of gene transcripts were analyzed via one-way ANOVA (Duncan’s post-test, p < 0.05). Groups lacking a similar letter (i.e., a,b,c) are significantly different. “n.s.” is used to illustrate a non-significant ANOVA. A sample size of 6 was used for each group in (C). The sample sizes for the groups in (A,B,D), are stated in the Materials and Methods section (Section 5.3). The F-test result for 4PA was p < 0.056. Error bars are +/− SEM.
Figure 4
Figure 4
Plasma estimate of methionine cycle metabolites and associated metabolites: Hen plasma samples were measured via LC-MS/MS. VIP scores of metabolites were analyzed via one-way ANOVA (Duncan’s post-test, p < 0.05). Groups lacking a similar letter (i.e., a,b,c) are significantly different. “n.s.” is used to illustrate a non-significant ANOVA. The four methionine cycle metabolites (A) as well as their ratios (B) are depicted. Plasma MTA was estimated (C), and we have multiple proxy markers to estimate SAHH activity (D). The sample size from each group is listed in the Materials and Methods section (Section 5.3). The F-test result for Homocysteine:SAH was p < 0.066. Error bars are +/− SEM.
Figure 5
Figure 5
One-carbon donor molecules that fuel BHMT, in association with hen body mass: Hen plasma samples were measured via LC-MS/MS. VIP scores of metabolites were analyzed via one-way ANOVA (Duncan’s post-test, p < 0.05). Groups lacking a similar letter (i.e., a,b,c) are significantly different. “n.s.” is used to illustrate a non-significant ANOVA or T-test. Choline and betaine were evaluated in plasma (A), and the Met:betaine ratio was observed (B). We tested the effect of diet on body mass, using one-way ANOVA (Duncan’s post-test, p < 0.05) (C). Body mass was also contrasted between normal hens and cancerous hens, using the Student’s t-test for unequal variance (two-tailed; “#” indicates p < 0.01) (C). The Pearson coefficient between mean body mass and mean choline content was measured (D). In (E), the body masses between cancerous hens (“C”) and normal hens (“N”) were compared within diets, using the Student’s t-test for unequal variance. The sample sizes for groups in (E) are, by order of appearance: 86, 31, 85, 23, 73, 22, 84, 22, 62, 29, 70, and 24. The sample size from each group in (A) is listed in the Materials and Methods section (Section 5.3). The sample size from each group in (C) is listed in the Materials and Methods section (Section 5.2). One outlier was removed from the whole flax diet group in the graph of choline (A). Error bars are +/− SEM.
Figure 6
Figure 6
Folate cycle carbon donors that contribute to 5,10-CH2THF synthesis: Hen plasma samples were measured via LC-MS/MS. VIP scores of metabolites were analyzed via one-way ANOVA (Duncan’s post-test, p < 0.05). Groups lacking a similar letter (i.e., a,b) are significantly different. “n.s.” is used to illustrate a non-significant ANOVA. The sample size from each diet group is listed in the Materials and Methods section (Section 5.3). Error bars are +/− SEM.
Figure 7
Figure 7
Kaplan–Meier survival analysis and physiological biomarkers of aging: Kaplan–Meier analysis was conducted across diet groups from day 1 to day 325 (A). The “#” indicates a reduced Cox proportional hazard comparing DFM hens to CRN hens (hazard exp{coef} = 0.685; p < 0.05). In addition, there are shown three biomarkers of aging, measured via LC-MS/MS (B). VIP scores of metabolites were analyzed via one-way ANOVA (Duncan’s post-test, p < 0.05). Groups lacking a similar letter (i.e., a,b) are significantly different. “n.s.” is used to illustrate a non-significant ANOVA. For glycerophosphorylcholine, one outlier was removed from Control, Defatted Flax, and Corn Oil. Error bars are +/− SEM.
Figure 8
Figure 8
Basic model illustrating how flaxseed increases SAM synthesis in laying hens (predominantly a hepatic model). The initial effect is instigated when 1ADP (via linatine) antagonizes vitamin B6 and reduces CBS and CSE activity. In turn, this reduces carbon flux through transsulfuration and causes cystathionine trapping. Instead of developing HHcy, these animals display increased Hcy remethylation (via BHMT and MS-B12). BHMT hyperactivation induces elevated oxidation of choline and betaine, and MS-B12 hyperactivation induces elevated oxidation of molecules such as DMG and serine. The excess Met produced by the hyperactivation of BHMT and MS-B12 is then adenosylated via MAT to form an excess supply of SAM. In this manner, the SAM level and the SAM:SAH ratio of the hen will rise. 1ADP = 1-amino d-proline; 5-CH3THF = 5-methyl tetrahydrofolate; BHMT = betaine homocysteine methyltransferase; CBS = cystathionine beta synthase; CSE = cystathionase; DMG = dimethylglycine; Hcy = homocysteine; HHcy = hyperhomo-cysteinemia; MAT = methionine adenosyltransferase; Met = methionine; MS-B12 = methionine synthase B12; SAM = S-adenosylmethionine; SAH = S-adenosylhomocysteine; THF = tetrahydrofolate.
Figure 9
Figure 9
The interplay between SAM and MTA, regarding the activation of histone lysine methyltransferase enzymes such as KMT2C. Under conditions with a high SAM:SAH ratio, SAM will occupy the methyltransferase domain of KMT2C and promote methyltransferase activity toward the lysine residue (i.e., K4) on the cognate histone (i.e., H3). Under conditions with a high MTA concentration, MTA will inhibit the methyltransferase domain of KMT2C and reduce the methylation of H3K4. In this example, the interplay between SAM and MTA influences the degree to which H3K4 is methylated. Ultimately, the degree of H3K4 methylation will have a large influence on chromatin remodeling. The architecture of the chromatin will then inform how transcription factors, enhancers, and coactivators can bind to DNA consensus sequences and to nearby proteins. In turn, this will guide gene promoter activation and gene transcription.
Figure 10
Figure 10
Comprehensive model of one-carbon metabolism in flaxseed-fed hens. The primary metabolic effect (transsulfuration perturbation) is initiated when lADP exerts an anti-vitamin B6 effect that reduces CBS and CSE activity in the liver. This reduces transsulfuration flux and drives accelerated remethylation of Hcy into the Met cycle. This culminates in the increased synthesis of SAM, so that WFX hens and DFM hens have access to excess SAM. The secondary metabolic effect (flux through BHMT) is determined by the PUFA content of the diet, such that WFX hens exhibit a high flux through BHMT, and DFM hens exhibit a moderate flux through BHMT. The high PUFA content of the WFX diet allows WFX hens to strongly hyperactivate PEMT, while the moderate PUFA content of the DFM diet allows DFM hens to only moderately hyperactivate PEMT. In WFX hens, all excess SAM is catabolized by PEMT, because these animals strongly hyperactivate PEMT. In contrast, DFM hens only moderately hyperactivate PEMT and, therefore, not all excess SAM will be catabolized. This means that some of the excess SAM will accumulate in DFM hens and culminate in an increased plasma SAM:SAH ratio (i.e., increased methylation index). Simultaneously, this will yield increased production of MTA, due to enhanced flow of SAM toward polyamine biosynthesis. The elevated SAM:SAH ratio, in concert with elevated MTA, then acts to epigenetically downregulate transcriptomic processes in flaxseed-fed hens. By downregulating the transcriptome of the animal, this reduces physiological aging and culminates in increased empirical lifespan. One of the main themes of this model is that many things are accelerated, in order to compensate for reduced flux through transsulfuration. For example, accelerated flux through BHMT causes increased betaine catabolism, and therefore, causes increased choline oxidation. In turn, the hepatocyte must accelerate the phospholipase-mediated catabolism of PC, so that the hepatocyte can maintain access to sufficient levels of choline. This phospholipase activity generates a large quantity of FFAs that must be oxidized via mitochondria FAO, which contributes to the accelerated clearance of lipids from the liver. The oxidation of these FFAs also contributes to reduced adiposity and reduced body weight. Some of these FFAs will be incorporated into TG and packaged into VLDL, and this will assist with further clearance of lipids from the liver. Another major contributor to reduced hepatic steatosis is PEMT hyperactivation. By increasing PEMT activity in hens, flaxseed accelerates the synthesis of PC, and PC is a rate limiting molecule for the packaging and secretion of VLDL from the liver. Accelerated secretion of VLDL from the liver accelerates the clearance of lipids from hepatocytes and culminates in reduced hepatic steatosis. Without question, this would improve liver function (as evidenced by reduced hepatic AST in our flaxseed-fed hens). The flux through MS-B12 was supplementary to the flux through BHMT, such that WFX hens exhibited a moderate flux through MS-B12 while DFM hens exhibited a high flux through MS-B12. DFM hens and WFX hens likely displayed increased catabolism of DMG via DMGDH, indicating that both diet groups had elevated synthesis of 5,10-CH2THF. DFM hens also likely displayed elevated catabolism of serine via SHMT, as evidenced by a slightly lower serine:glycine ratio, further indicating elevated 5,10-CH2THF synthesis. Notably, this model predicts that the excess single-carbon units from serine (within the folate cycle, via SHMT) act as a unique carbon source permitting the accumulation of SAM. This suggests that serine is a lifespan extending amino acid in hens, and that SHMT is a lifespan extending enzyme. 1ADP = 1-amino d-proline; 5,10-CH2THF = 5,10 methylene tetrahydrofolate; AST = aspartate amino transferase; BHMT = betaine homocysteine methyltransferase; CBS = cystathionine beta synthase; CSE = cystathionase; dcSAM = decarboxylated SAM; DMG = dimethylglycine; DMGDH = dimethylglycine dehydrogenase; FAO = fatty acid oxidation; FFA = free fatty acid; Hcy = homocysteine; MAT = methionine adenosyltransferase; MS-B12 = methionine synthase-B12; MTA = methylthioadenosine; MTHFR = methylene tetrahydrofolate reductase; PC = phosphatidylcholine; PUFA = polyunsaturated fatty acid; PEMT = phosphatidylethanolamine methyltransferase; SAH = S-adenosylhomocysteine; SAM = S-adenosylmethionine; SHMT = serine hydroxymethyltransferase; TG = triglyceride; VLDL = very low-density lipoprotein.

Similar articles

Cited by

References

    1. Barua A., Bitterman P., Abramowicz J.S., Dirks A.L., Bahr J.M., Hales D.B., Bradaric M.J., Edassery S.L., Rotmensch J., Luborsky J.L. Histopathology of ovarian tumors in laying hens, a preclinical model of human ovarian cancer. Int. J. Gynecol. Cancer. 2009;19:531–539. doi: 10.1111/IGC.0b013e3181a41613. - DOI - PMC - PubMed
    1. Johnson P.A., Giles J.R. The hen as a model of ovarian cancer. Nat. Rev. Cancer. 2013;13:432. doi: 10.1038/nrc3535. - DOI - PubMed
    1. Hakim A.A., Barry C.P., Barnes H.J., Anderson K.E., Petitte J., Whitaker R., Lancaster J.M., Wenham R.M., Carver D.K., Turbov J., et al. Ovarian Adenocarcinomas in the Laying Hen and Women Share Similar Alterations in p53, ras, and HER-2/neu. Cancer Prev. Res. 2009;2:114–121. doi: 10.1158/1940-6207.CAPR-08-0065. - DOI - PubMed
    1. Hawkridge A.M. The Chicken Model of Spontaneous Ovarian Cancer. Proteomics. Clin. Appl. 2014;8:689–699. doi: 10.1002/prca.201300135. - DOI - PMC - PubMed
    1. Giles J.R., Elkin R.G., Trevino L.S., Urick M.E., Ramachandran R., Johnson P.A. The restricted ovulator chicken: A unique animal model for investigating the etiology of ovarian cancer. Int. J. Gynecol. Cancer. 2010;20:738–744. doi: 10.1111/IGC.0b013e3181da2c49. - DOI - PubMed