

Optical Fibre Sensor for Capillary Refill Time and Contact Pressure Measurements under the Foot
- PMID: 34577279
- PMCID: PMC8470683
- DOI: 10.3390/s21186072
Optical Fibre Sensor for Capillary Refill Time and Contact Pressure Measurements under the Foot
Abstract
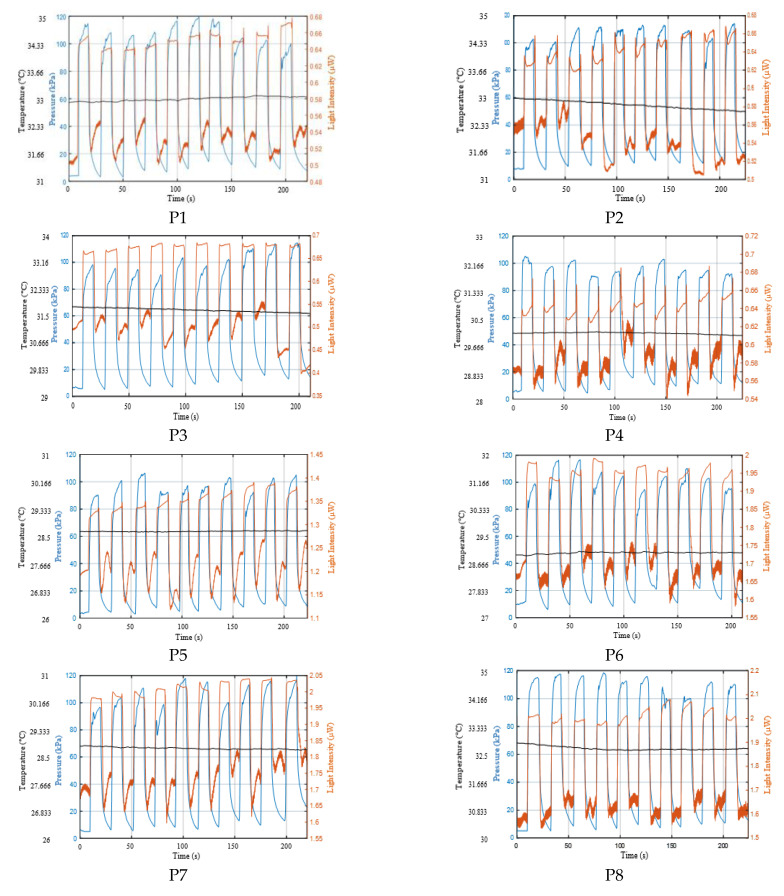
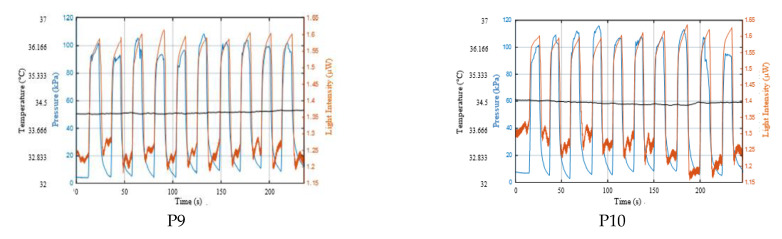
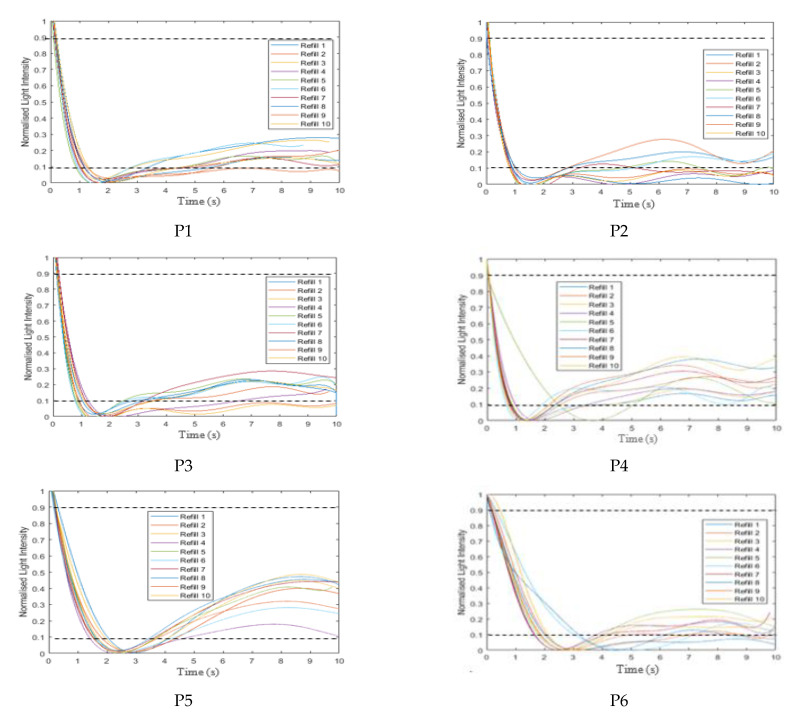
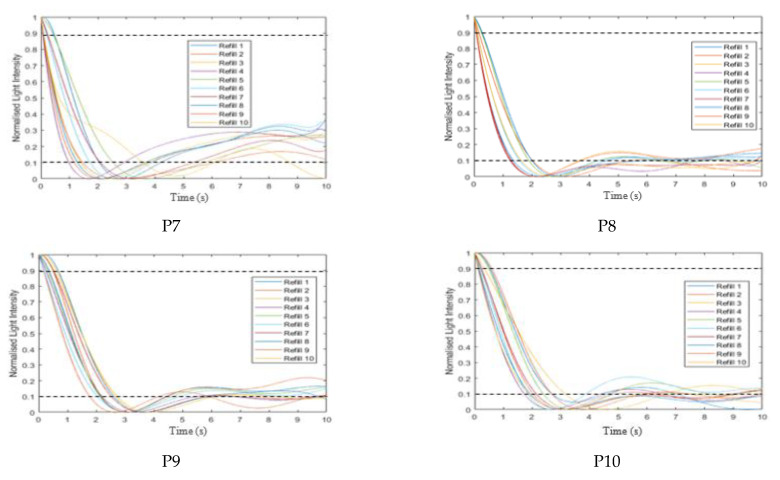
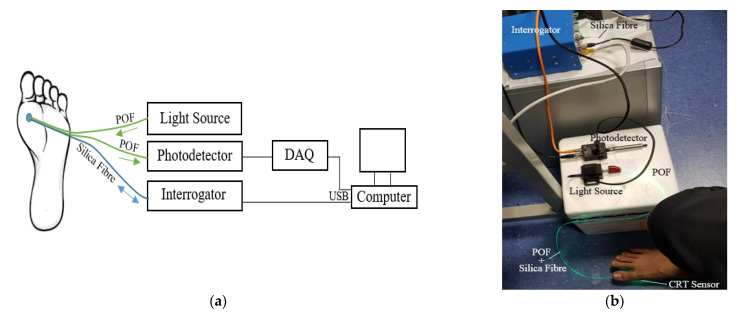
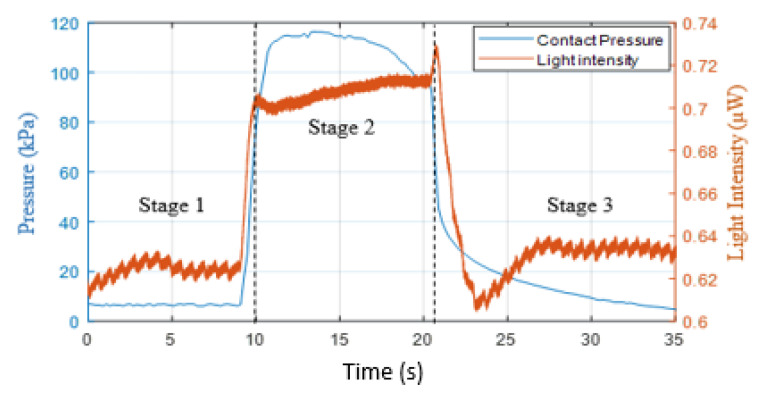
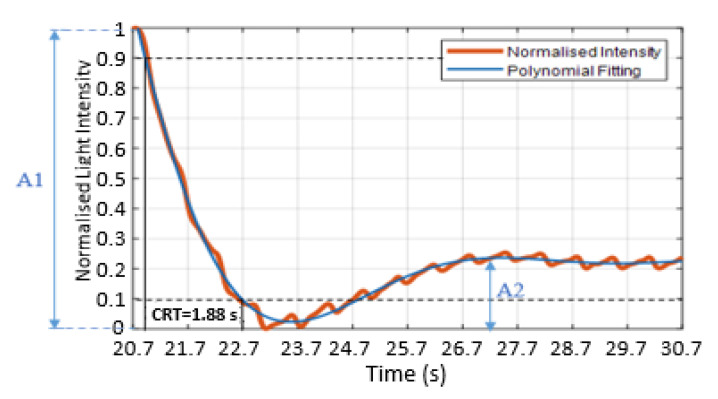
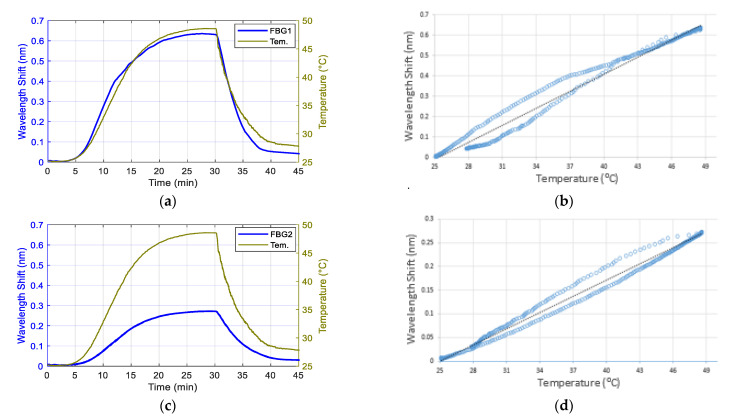
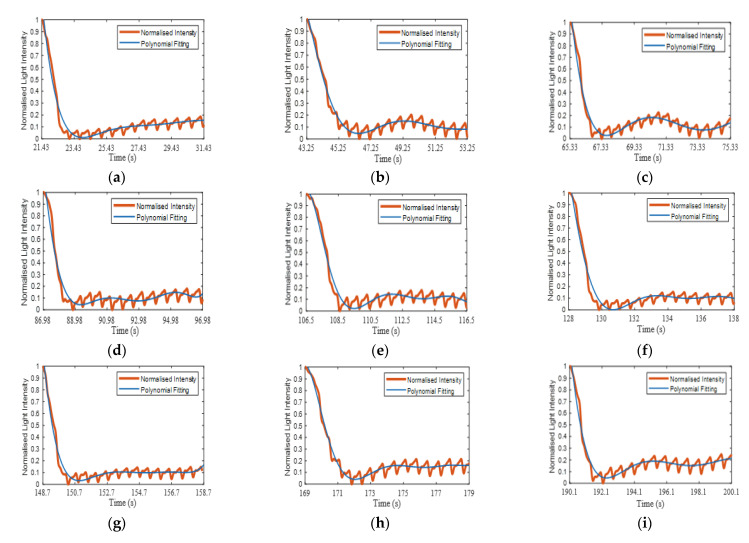
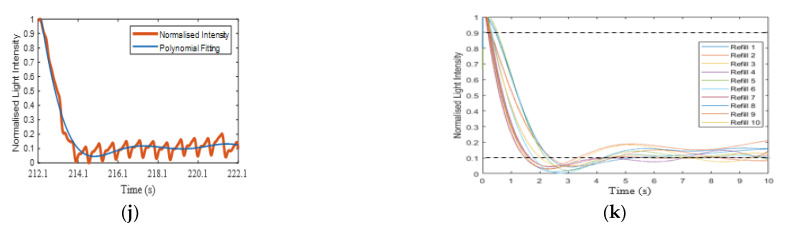
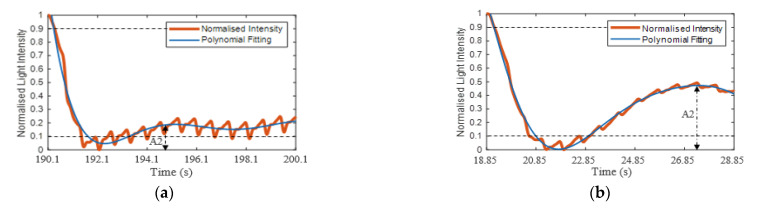
Capillary refill time (CRT) refers to the time taken for body tissue to regain its colour after an applied blanching pressure is released. Usually, pressure is manually applied and not measured. Upon release of pressure, simple mental counting is typically used to estimate how long it takes for the skin to regain its colour. However, this method is subjective and can provide inaccurate readings due to human error. CRT is often used to assess shock and hydration but also has the potential to assess peripheral arterial disease which can result in tissue breakdown, foot ulcers and ultimately amputation, especially in people with diabetes. The aim of this study was to design an optical fibre sensor to simultaneously detect blood volume changes and the contact pressure applied to the foot. The CRT probe combines two sensors: a plastic optical fibre (POF) based on photoplethysmography (PPG) to measure blood volume changes and a fibre Bragg grating to measure skin contact pressure. The results from 10 healthy volunteers demonstrate that the blanching pressure on the subject's first metatarsal head of the foot was 100.8 ± 4.8 kPa (mean and standard deviation), the average CRT was 1.37 ± 0.46 s and the time to achieve a stable blood volume was 4.77 ± 1.57 s. For individual volunteers, the fastest CRT measured was 0.82 ± 0.11 and the slowest 1.94 ± 0.49 s. The combined sensor and curve fitting process has the potential to provide increased reliability and accuracy for CRT measurement of the foot in diabetic foot ulcer clinics and in the community.
Keywords: blood volume changes; capillary refill time; contact pressure; fibre Bragg grating (FBG); optical fibre; peripheral arterial disease; photoplethysmography (PPG); plastic optical fibre.
Conflict of interest statement
The authors declare no conflict of interest.
Figures
Similar articles
-
Optical Fibre Sensor for Simultaneous Measurement of Capillary Refill Time and Contact Pressure.Sensors (Basel). 2020 Mar 3;20(5):1388. doi: 10.3390/s20051388. Sensors (Basel). 2020. PMID: 32138378 Free PMC article.
-
Optical Fibre-Based Pulse Oximetry Sensor with Contact Force Detection.Sensors (Basel). 2018 Oct 26;18(11):3632. doi: 10.3390/s18113632. Sensors (Basel). 2018. PMID: 30373119 Free PMC article.
-
A Textile Sleeve for Monitoring Oxygen Saturation Using Multichannel Optical Fibre Photoplethysmography.Sensors (Basel). 2020 Nov 17;20(22):6568. doi: 10.3390/s20226568. Sensors (Basel). 2020. PMID: 33212998 Free PMC article.
-
Optical Fibre-Based Sensors-An Assessment of Current Innovations.Biosensors (Basel). 2023 Aug 22;13(9):835. doi: 10.3390/bios13090835. Biosensors (Basel). 2023. PMID: 37754069 Free PMC article. Review.
-
Why critical limb ischemia criteria are not applicable to diabetic foot and what the consequences are.Scand J Surg. 2012;101(2):114-8. doi: 10.1177/145749691210100207. Scand J Surg. 2012. PMID: 22623444 Review.
Cited by
-
Biocompatible and Biodegradable Polymer Optical Fiber for Biomedical Application: A Review.Biosensors (Basel). 2021 Nov 23;11(12):472. doi: 10.3390/bios11120472. Biosensors (Basel). 2021. PMID: 34940229 Free PMC article. Review.
-
Research Progress on the Measurement Methods and Clinical Significance of Capillary Refill Time.Sensors (Basel). 2024 Dec 12;24(24):7941. doi: 10.3390/s24247941. Sensors (Basel). 2024. PMID: 39771680 Free PMC article. Review.
-
State-of-the-Art Light to Digital Converter Circuits Applicable in Non-Invasive Health Monitoring Devices to Combat COVID-19 and Other Respiratory Illnesses: A Review.IEEE Sens J. 2022 Apr 4;22(10):9189-9197. doi: 10.1109/JSEN.2022.3164148. eCollection 2022 May. IEEE Sens J. 2022. PMID: 35939263 Free PMC article.
-
Agreement between Capillary Refill Time measured at Finger and Earlobe sites in different positions: a pilot prospective study on healthy volunteers.BMC Anesthesiol. 2023 Jan 18;23(1):30. doi: 10.1186/s12871-022-01920-1. BMC Anesthesiol. 2023. PMID: 36653739 Free PMC article.
-
Diabetic foot prevention, assessment, and management using innovative smart wearable technology: a systematic review.J Neuroeng Rehabil. 2025 Jul 18;22(1):168. doi: 10.1186/s12984-025-01695-9. J Neuroeng Rehabil. 2025. PMID: 40682082 Free PMC article. Review.
References
-
- Gorelick M.H., Shaw K.N., Baker M.D. Effect of ambient temperature on capillary refill in healthy children. Pediatrics. 1993;92:699–702. - PubMed
MeSH terms
Grants and funding
LinkOut - more resources
Full Text Sources
Medical
Research Materials
