

Benefits of a Switch from Intermittently Scanned Continuous Glucose Monitoring (isCGM) to Real-Time (rt) CGM in Diabetes Type 1 Suboptimal Controlled Patients in Real-Life: A One-Year Prospective Study §
- PMID: 34577338
- PMCID: PMC8473395
- DOI: 10.3390/s21186131
Benefits of a Switch from Intermittently Scanned Continuous Glucose Monitoring (isCGM) to Real-Time (rt) CGM in Diabetes Type 1 Suboptimal Controlled Patients in Real-Life: A One-Year Prospective Study §
Abstract
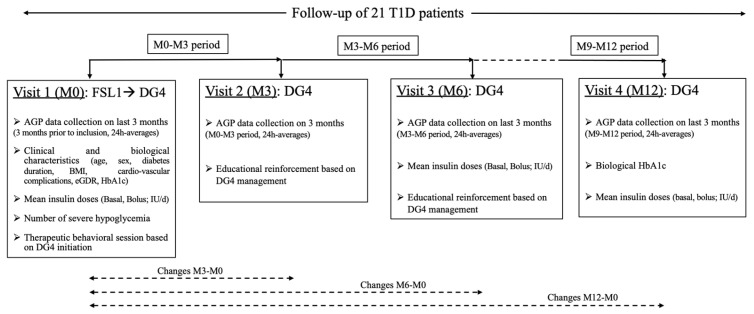
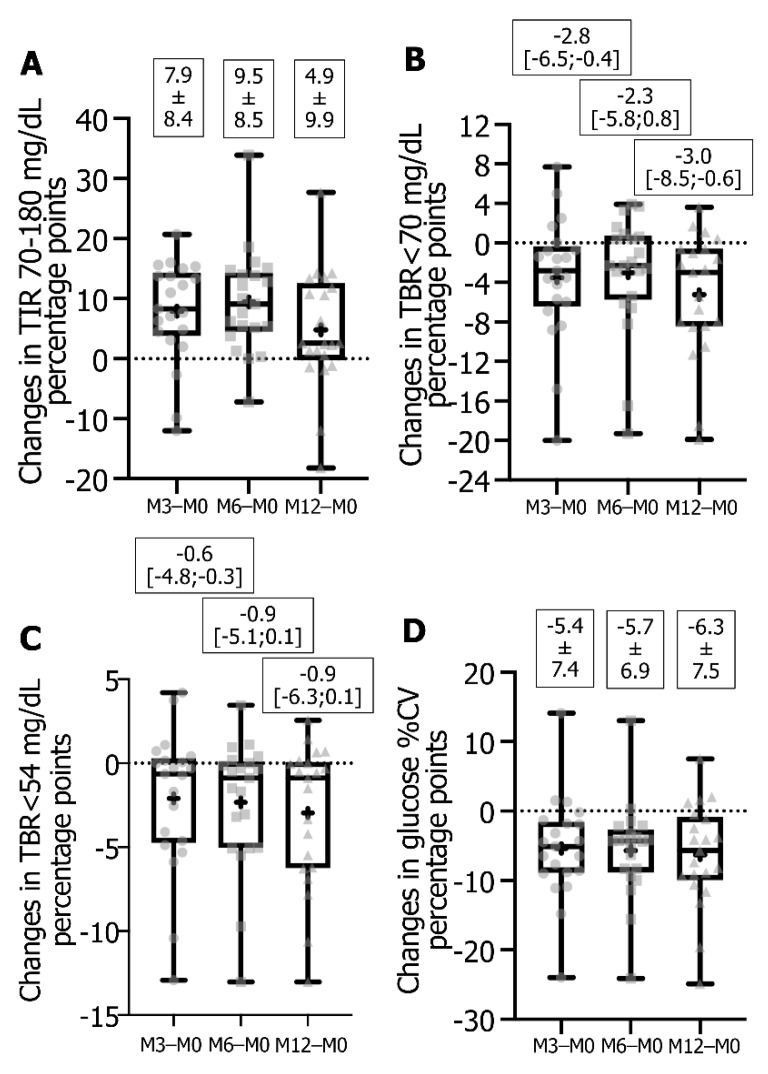
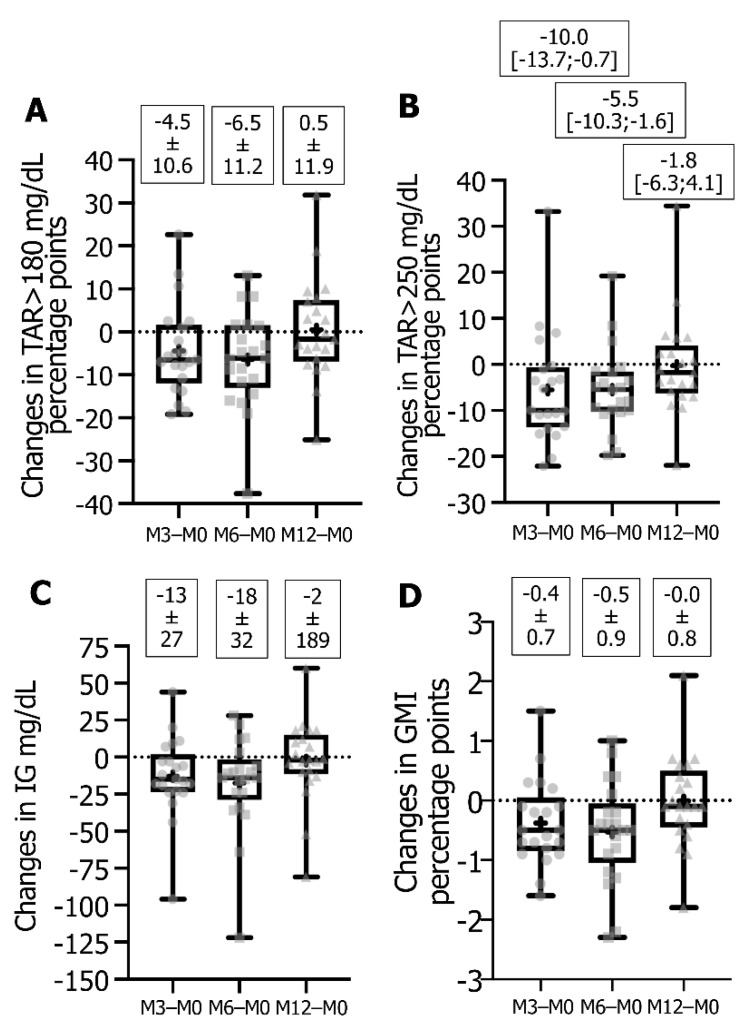
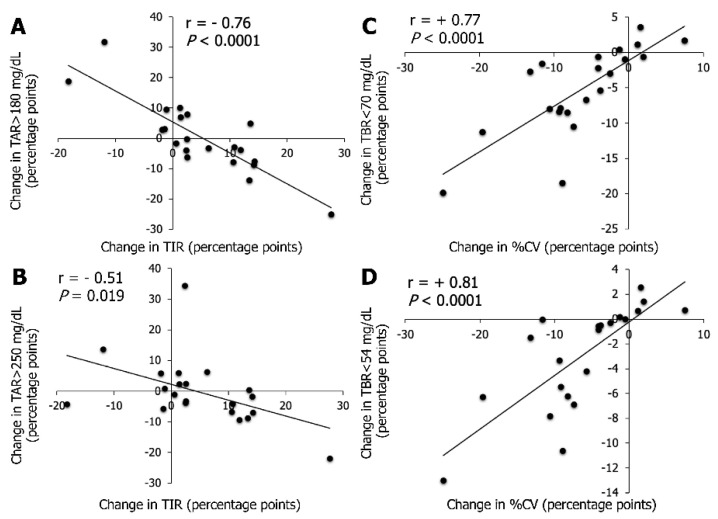
The switch from intermittently scanned continuous glucose monitoring (isCGM) to real-time (rt) CGM could improve glycemic management in suboptimal controlled type 1 diabetes patients, but long-term study is lacking. We evaluated retrospectively the ambulatory glucose profile (AGP) in such patients after switching from Free Style Libre 1 (FSL1) to Dexcom G4 (DG4) biosensors over 1 year. Patients (n = 21, 43 ± 15 years, BMI 25 ± 5, HbA1c 8.1 ± 1.0%) had severe hypoglycemia and/or HbA1c ≥ 8%. AGP metrics (time-in-range (TIR) 70-180 mg/dL, time-below-range (TBR) <70 mg/dL or <54 mg/dL, glucose coefficient of variation (%CV), time-above-range (TAR) >180 mg/dL or >250 mg/dL, glucose management indicator (GMI), average glucose) were collected the last 3 months of FSL1 use (M0) and of DG4 for 3, 6 (M6) and 12 (M12) months of use. Values were means ± standard deviation or medians [Q1;Q3]. At M12 versus M0, the higher TIR (50 ± 17 vs. 45 ± 16, p = 0.036), and lower TBR < 70 mg/dL (2.5 [1.6;5.5] vs. 7.0 [4.5;12.5], p = 0.0007), TBR < 54 mg/dL (0.7 [0.4;0.8] vs. 2.3 [0.8;7.0], p = 0.007) and %CV (39 ± 5 vs. 45 ± 8, p = 0.0009), evidenced a long-term effectiveness of the switch. Compared to M6, TBR < 70 mg/dL decreased, %CV remained stable, while the improvement on hyperglycemia exposure decreased (higher GMI, TAR and average glucose). This switch was a relevant therapeutic option, though a loss of benefit on hyperglycemia stressed the need for optimized management of threshold alarms. Nevertheless, few patients attained the recommended values for AGP metrics, and the reasons why some patients are "responders" vs. "non-responders" warrant to be investigated.
Keywords: glucose biosensors; hypoglycemia; insulin resistance; intermittently scanned continuous glucose monitoring; real-time continuous glucose monitoring; type 1 diabetes.
Conflict of interest statement
M.A., D.R. no conflict of interest to disclose. Y.P. discloses support from Dexcom (Dinno-Santé) for attending SFD congress in 2021. S.G. discloses congress invitations from Abbott and Medtronic, and participation in the board of remote monitoring platform of Roche Diabetes Care. P.S. discloses congress invitations, honoraria and consultancies from Abbott.
Figures
Similar articles
-
Intermittent-scanned continuous glucose monitoring with low glucose alarms decreases hypoglycemia incidence in middle-aged adults with type 1 diabetes in real-life setting.J Diabetes Complications. 2023 Feb;37(2):108385. doi: 10.1016/j.jdiacomp.2022.108385. Epub 2022 Dec 26. J Diabetes Complications. 2023. PMID: 36603333
-
Impact of Switching from Intermittently Scanned to Real-Time Continuous Glucose Monitoring Systems in a Type 1 Diabetes Patient French Cohort: An Observational Study of Clinical Practices.Diabetes Technol Ther. 2021 Apr;23(4):259-267. doi: 10.1089/dia.2020.0515. Epub 2020 Nov 25. Diabetes Technol Ther. 2021. PMID: 33136439 Free PMC article.
-
Comparison of Glycemic Metrics Measured Simultaneously by Intermittently Scanned Continuous Glucose Monitoring and Real-Time Continuous Glucose Monitoring in Pregnant Women with Type 1 Diabetes.Diabetes Technol Ther. 2021 Oct;23(10):665-672. doi: 10.1089/dia.2021.0109. Epub 2021 Jun 25. Diabetes Technol Ther. 2021. PMID: 34086494
-
Effects of Continuous Glucose Monitoring on Metrics of Glycemic Control in Diabetes: A Systematic Review With Meta-analysis of Randomized Controlled Trials.Diabetes Care. 2020 May;43(5):1146-1156. doi: 10.2337/dc19-1459. Diabetes Care. 2020. PMID: 32312858
-
Comparing the glycaemic outcomes between real-time continuous glucose monitoring (rt-CGM) and intermittently scanned continuous glucose monitoring (isCGM) among adults and children with type 1 diabetes: A systematic review and meta-analysis of randomized controlled trials.Diabet Med. 2024 Mar;41(3):e15280. doi: 10.1111/dme.15280. Epub 2024 Jan 10. Diabet Med. 2024. PMID: 38197238
Cited by
-
Comparison of the clinical effects of intermittently scanned and real-time continuous glucose monitoring in children and adolescents with type 1 diabetes: A retrospective cohort study.J Diabetes Investig. 2022 Oct;13(10):1745-1752. doi: 10.1111/jdi.13830. Epub 2022 May 28. J Diabetes Investig. 2022. PMID: 35532954 Free PMC article.
-
Accuracy of a novel calibratable real-time continuous glucose monitoring device based on FreeStyle libre in- and out-of-hospital.Front Endocrinol (Lausanne). 2025 Apr 22;16:1466358. doi: 10.3389/fendo.2025.1466358. eCollection 2025. Front Endocrinol (Lausanne). 2025. PMID: 40331145 Free PMC article.
-
International Society for Pediatric and Adolescent Diabetes Clinical Practice Consensus Guidelines 2024 Diabetes Technologies: Glucose Monitoring.Horm Res Paediatr. 2024;97(6):615-635. doi: 10.1159/000543156. Epub 2025 Jan 30. Horm Res Paediatr. 2024. PMID: 39884260 Free PMC article. Review.
-
Time in Range in Children with Type 1 Diabetes before and during a Diabetes Camp-A Ceiling Effect?Children (Basel). 2022 Dec 12;9(12):1951. doi: 10.3390/children9121951. Children (Basel). 2022. PMID: 36553394 Free PMC article.
-
ISPAD Clinical Practice Consensus Guidelines 2022: Diabetes technologies: Glucose monitoring.Pediatr Diabetes. 2022 Dec;23(8):1390-1405. doi: 10.1111/pedi.13451. Pediatr Diabetes. 2022. PMID: 36537528 Free PMC article. No abstract available.
References
-
- Maiorino M.I., Signoriello S., Maio A., Chiodini P., Bellastella G., Scappaticcio L., Longo M., Giugliano D., Esposito K. Effects of continuous glucose monitoring on metrics of glycemic control in diabetes: A systematic review with meta-analysis of randomized controlled trials. Diabetes Care. 2020;43:1146–1156. doi: 10.2337/dc19-1459. - DOI - PubMed
-
- Charleer S., Mathieu C., Nobels F., De Block C., Radermecker R.P., Hermans M.P., Taes Y., Vercammen C., T’Sjoen G., Crenier L., et al. Effect of continuous glucose monitoring on glycemic control, acute admissions, and quality of life: A real-world study. J. Clin. Endocrinol. Metab. 2018;103:1224–1232. doi: 10.1210/jc.2017-02498. - DOI - PubMed
-
- Roussel R., Guerci B., Vicaut E., Depouvourville G., Detournay B., Emery C., Levrat-Guillen F., Riveline J.-P. Dramatic drop-in ketoacidosis rate after freestyle libre system initiation in type 1 and type 2 diabetes in France, especially in people with low self-monitoring of blood glucose (SMBG): A nationwide study. Diabetes. 2020;69:68. doi: 10.2337/db20-68-OR. - DOI
MeSH terms
Substances
LinkOut - more resources
Full Text Sources
Medical
