. 2021 Sep 13;21(18):6143.
doi: 10.3390/s21186143.

An Extended Modular Processing Pipeline for Event-Based Vision in Automatic Visual Inspection

Affiliations

An Extended Modular Processing Pipeline for Event-Based Vision in Automatic Visual Inspection

Moritz Beck et al. Sensors (Basel). .

Abstract

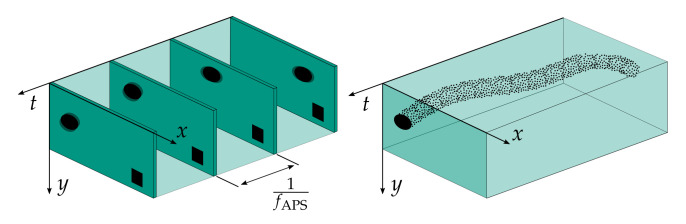
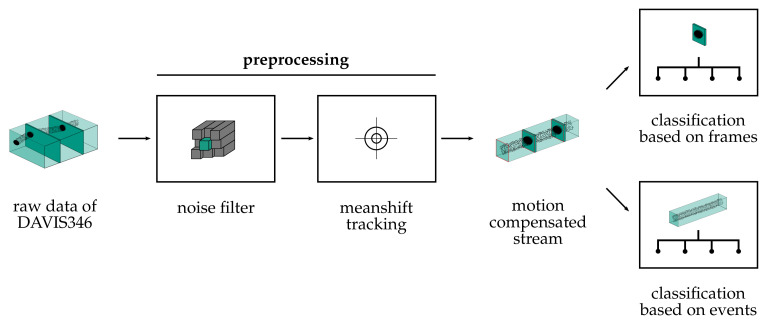
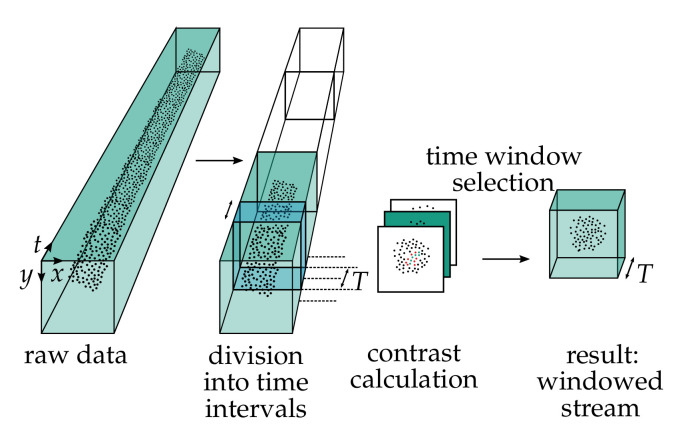
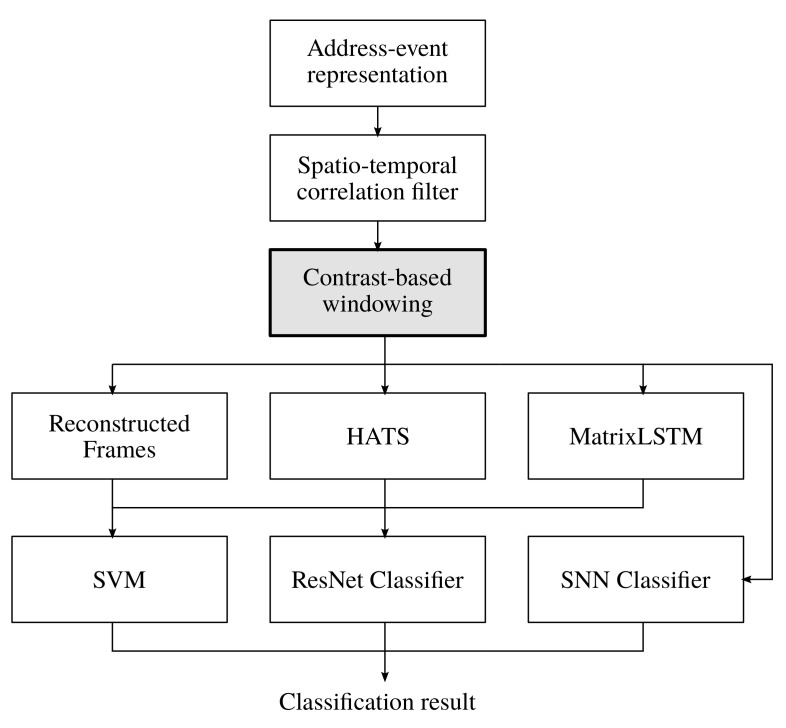
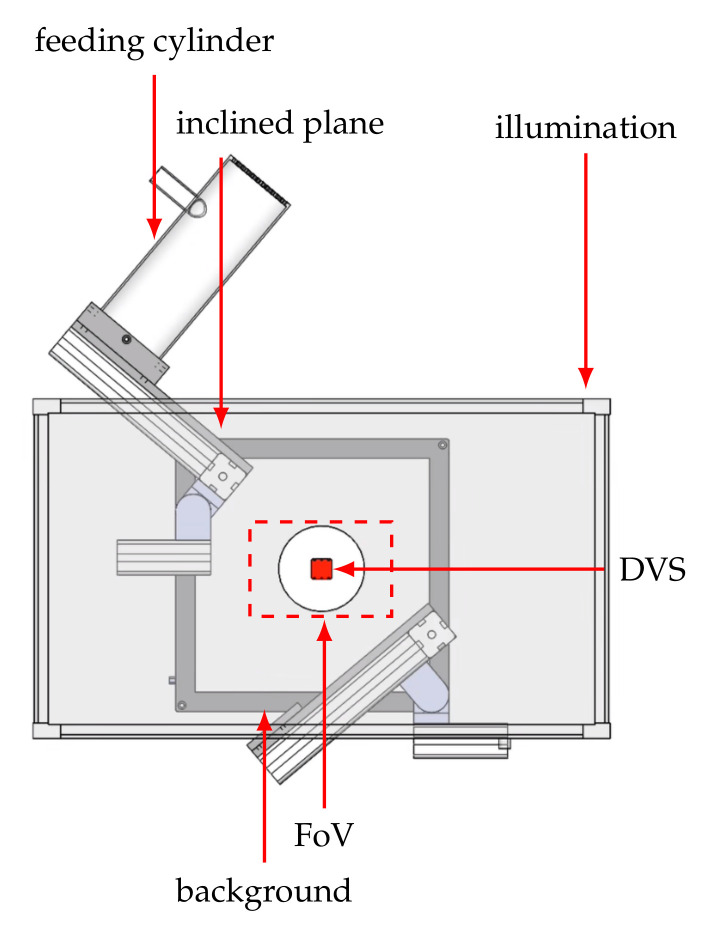
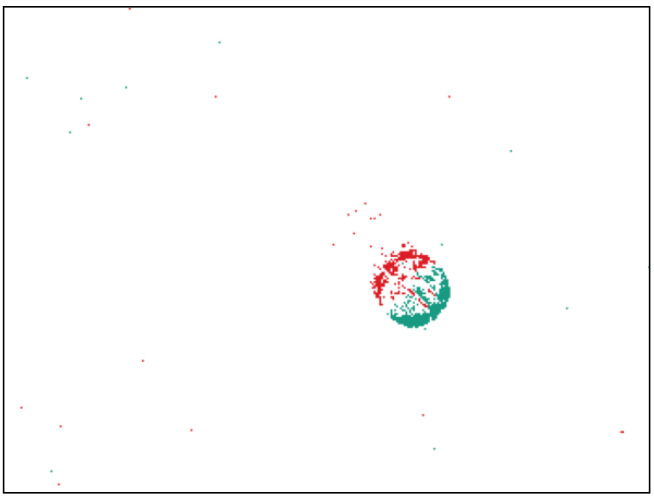
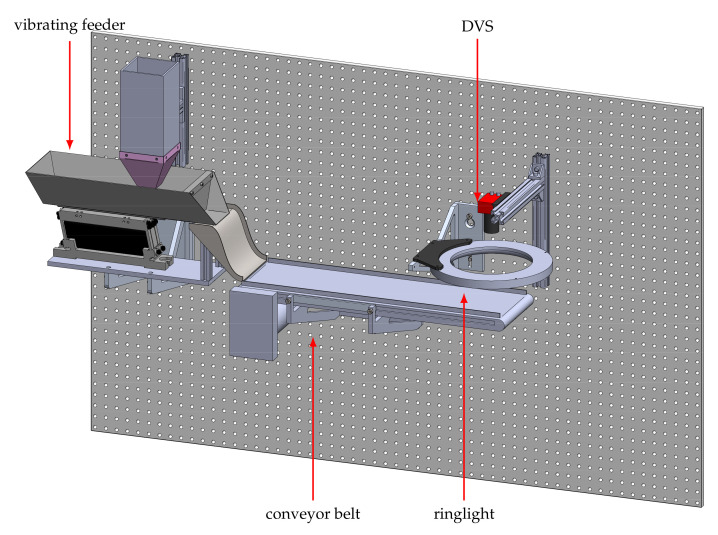
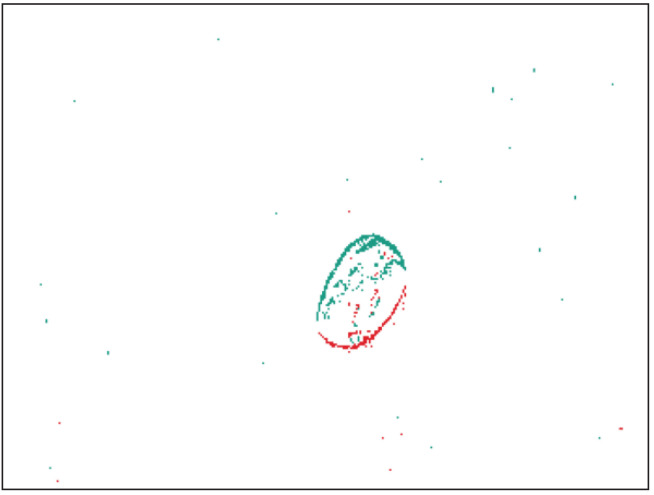
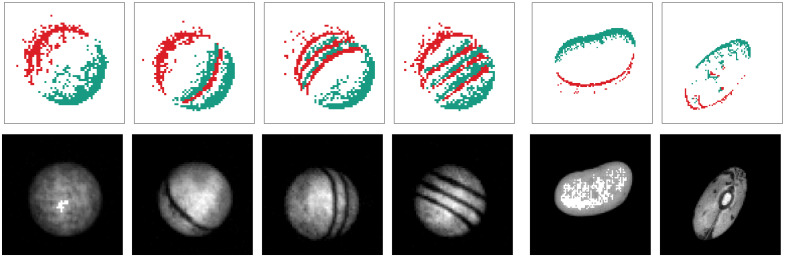
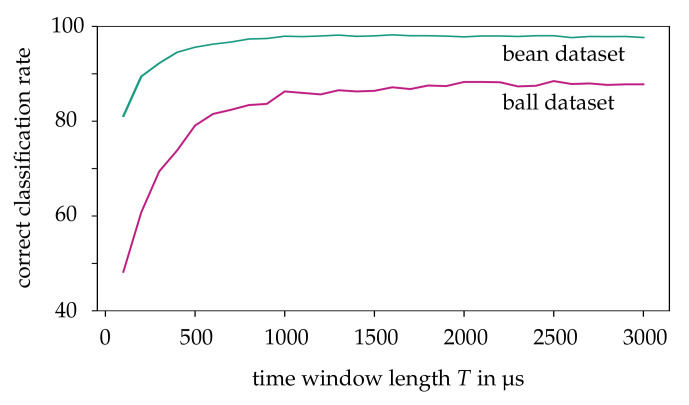
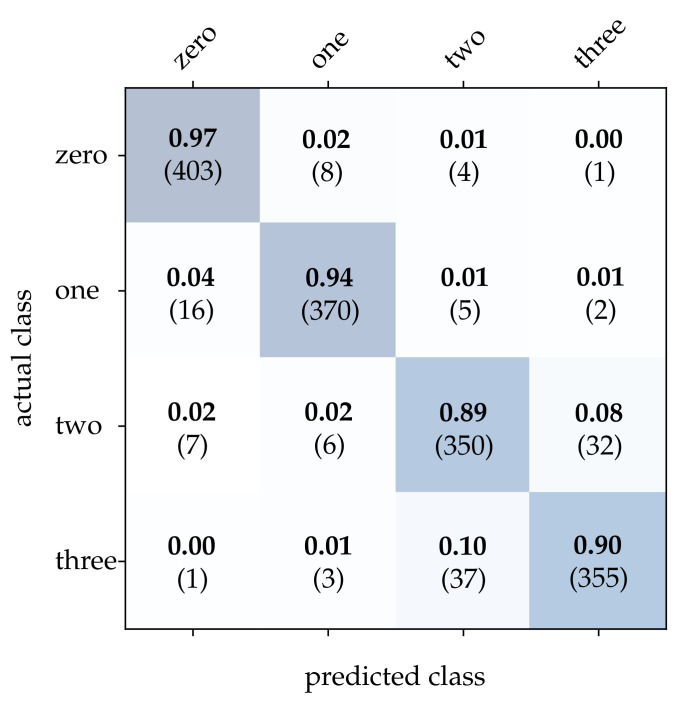
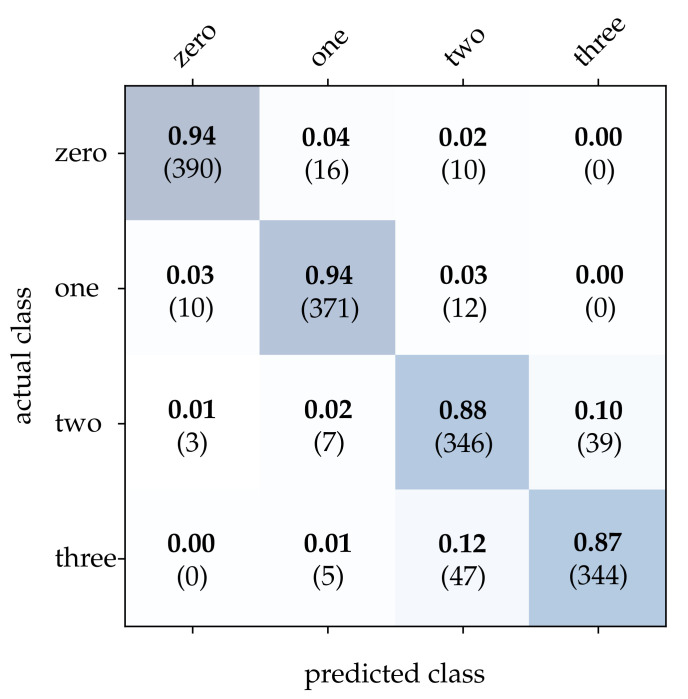
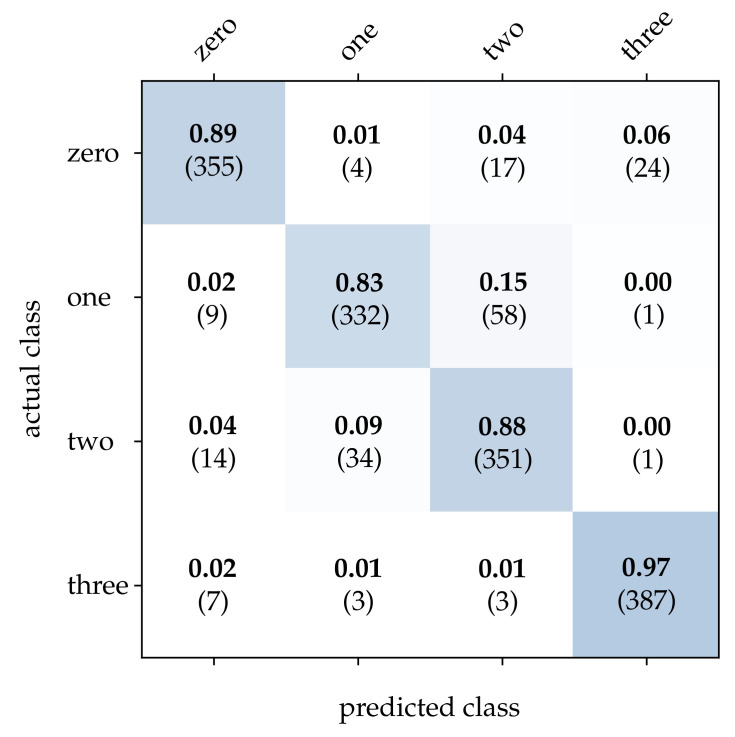
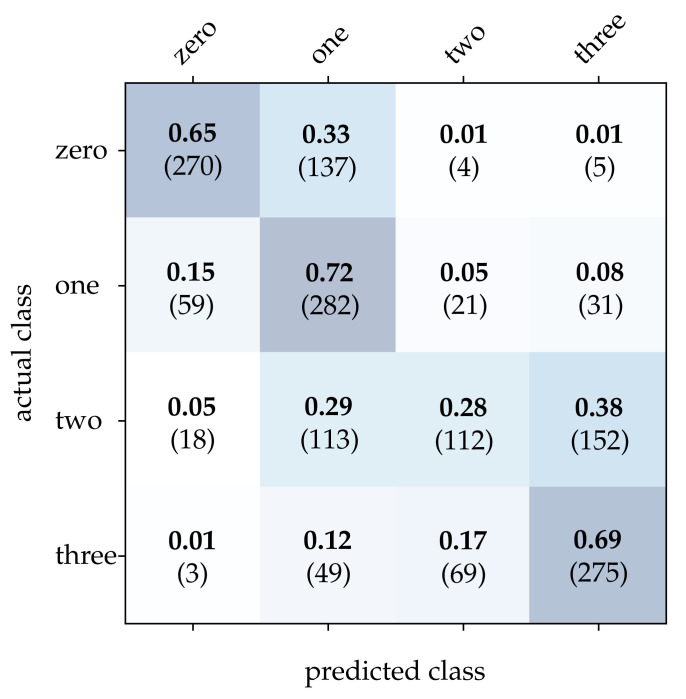
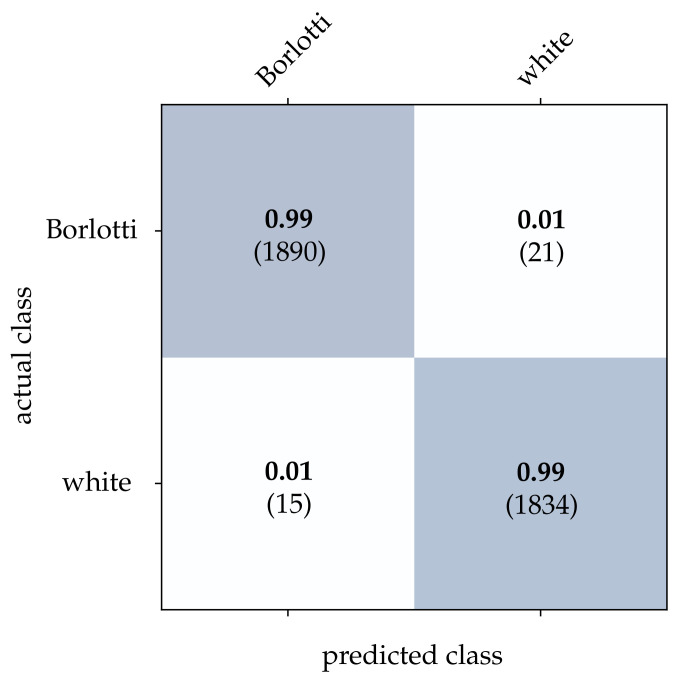
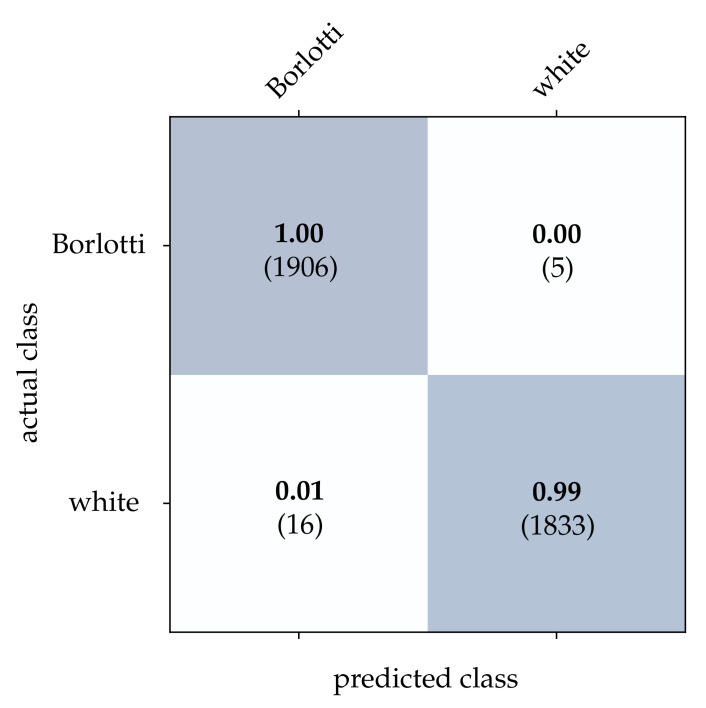
Dynamic Vision Sensors differ from conventional cameras in that only intensity changes of individual pixels are perceived and transmitted as an asynchronous stream instead of an entire frame. The technology promises, among other things, high temporal resolution and low latencies and data rates. While such sensors currently enjoy much scientific attention, there are only little publications on practical applications. One field of application that has hardly been considered so far, yet potentially fits well with the sensor principle due to its special properties, is automatic visual inspection. In this paper, we evaluate current state-of-the-art processing algorithms in this new application domain. We further propose an algorithmic approach for the identification of ideal time windows within an event stream for object classification. For the evaluation of our method, we acquire two novel datasets that contain typical visual inspection scenarios, i.e., the inspection of objects on a conveyor belt and during free fall. The success of our algorithmic extension for data processing is demonstrated on the basis of these new datasets by showing that classification accuracy of current algorithms is highly increased. By making our new datasets publicly available, we intend to stimulate further research on application of Dynamic Vision Sensors in machine vision applications.

Keywords: automatic visual inspection; dynamic vision sensors; event-based vision; object classification.


Conflict of interest statement

The authors declare no conflict of interest.

Figures

Figure 1
Figure 1
Difference between the frame (left) and event-based (right) vision technology. The scene shows a sphere moving from the right to left image border and a static square in the lower right corner. A frame-based camera perceives the square as well as the sphere with a motion blur at constant sampling times. The event-based camera does not suffer from motion blur and generates an asynchronous event stream at the edge of the sphere with high temporal resolution. However, the static square is not perceived.
Figure 2
Figure 2
Overview on the modular pipeline used to classify objects based on intensity images and events. The DAVIS346 camera records conventional frames at a constant frame rate and an asynchronous event stream of the moving object in the camera’s FoV. The event stream is denoised by a spatio-temporal filter and a meanshift tracking algorithm determines the object’s centroid based on events only. All information about frames and events is compressed to an ROI formed around the object’s center which leads to a compensation of lateral motion. Based on this, different classification methods are applied and compared.
Figure 3
Figure 3
Windowing method to reduce the event stream to the time interval with the highest contrast. The whole event stream is divided into equal time intervals. Within each interval a sliding time window is used to select events for contrast calculation. The contrast is defined as the sum of events of different polarity in a spatial neighborhood. Finally, the time window with the highest contrast in each interval is selected for further processing.
Figure 4
Figure 4
Visual summary of the proposed pipeline including the new CBW approach.
Figure 5
Figure 5
Experimental setup to generate the event-based ball dataset. The illumination panel is shown transparent for a better overview. Starting from the upper cylinder, the balls roll over an inclined plane and cross the camera’s FoV diagonally. As the balls are in free fall they rotate and the camera is able to perceive the object’s pattern in motion. In order to record a large amount of data the cycle is automated by pneumatic conveyance, returning the ball back to the starting point.
Figure 6
Figure 6
Example of an unprocessed recording of a ball with two stripes during free fall (animated in the digital version of this manuscript).
Figure 7
Figure 7
Experimental setup to generate the event-based bean dataset. Two different types of beans are considered: white beans without a pattern and Borlotti beans that are spotted with red dots and random texture. Being spread out by the shaker, the beans move towards the conveyor belt successively. Once a bean slid down the ramp the belt conveys it through the camera’s FoV at a speed of approximately 1.1 ms1.
Figure 8
Figure 8
Example of an unprocessed recording of a Borlotti bean on a conveyor belt (animated in the digital version of this manuscript).
Figure 9
Figure 9
Samples of the preprocessed ball (left side) and bean dataset (right side). All data have been recorded with a DAVIS346 and preprocessed by the event-based pipeline presented in this paper. After an initial noise filtering, a tracking algorithm based on events only tracks the object’s center. All events and frames of a detected object are compressed to an ROI of constant size around the center. The upper row shows the resulting event stream where positive events are marked in green and negative in red (animated in the digital version of this manuscript). In the lower row sections of conventional gray scale images of the DAVIS camera are displayed that have been extracted by the pipeline.
Figure 10
Figure 10
Correct classification rate for both datasets using the contrast-based time windowing with different time window lengths. In this case, the HATS approach with a SVM is used for classification.
Figure 11
Figure 11
Classification results using image reconstruction and the wooden balls dataset. The bold values denote the relative frequency, the number in brackets the absolute number of samples.
Figure 12
Figure 12
Classification results using HATS and the wooden balls dataset. The bold values denote the relative frequency, the number in brackets the absolute number of samples.
Figure 13
Figure 13
Classification results using MatrixLSTM and the wooden balls dataset. The bold values denote the relative frequency, the number in brackets the absolute number of samples.
Figure 14
Figure 14
Classification results using the SNN and the wooden balls dataset. The bold values denote the relative frequency, the number in brackets the absolute number of samples.
Figure 15
Figure 15
Classification results using image reconstruction and the beans dataset. The bold values denote the relative frequency, the number in brackets the absolute number of samples.
Figure 16
Figure 16
Classification results using HATS and the beans dataset. The bold values denote the relative frequency, the number in brackets the absolute number of samples.
Figure 17
Figure 17
Classification results using MatrixLSTM and the beans dataset. The bold values denote the relative frequency, the number in brackets the absolute number of samples.
Figure 18
Figure 18
Classification results using the SNN and the beans dataset. The bold values denote the relative frequency, the number in brackets the absolute number of samples.

Similar articles

References

    1. Gallego G., Delbruck T., Orchard G.M., Bartolozzi C., Taba B., Censi A., Leutenegger S., Davison A., Conradt J., Daniilidis K., et al. Event-based Vision: A Survey. IEEE Trans. Pattern Anal. Mach. Intell. 2020 doi: 10.1109/TPAMI.2020.3008413. - DOI - PubMed
    1. Holešovský O., Škoviera R., Hlaváč V., Vítek R. Experimental Comparison between Event and Global Shutter Cameras. Sensors. 2021;21:1137. doi: 10.3390/s21041137. - DOI - PMC - PubMed
    1. Beyerer J., Puente León F., Frese C. Machine Vision: Automated Visual Inspection: Theory, Practice and Applications. Springer; Berlin/Heidelberg, Germany: 2016.
    1. Lichtsteiner P., Posch C., Delbruck T. A 128x128 120 dB 15 μ Latency Asynchronous Temporal Contrast Vision Sensor. IEEE J. Solid-State Circuits. 2008;43:566–576. doi: 10.1109/JSSC.2007.914337. - DOI
    1. Brandli C., Berner R., Yang M., Liu S.C., Delbruck T. A 240 × 180 130 db 3 μs latency global shutter spatiotemporal vision sensor. IEEE J. Solid-State Circuits. 2014;49:2333–2341. doi: 10.1109/JSSC.2014.2342715. - DOI

LinkOut - more resources