. 2021 Sep 14;21(18):6154.
doi: 10.3390/s21186154.

Graphical Optimization of Spectral Shift Reconstructions for Optical Backscatter Reflectometry

Affiliations

Graphical Optimization of Spectral Shift Reconstructions for Optical Backscatter Reflectometry

Daniel C Sweeney et al. Sensors (Basel). .

Abstract

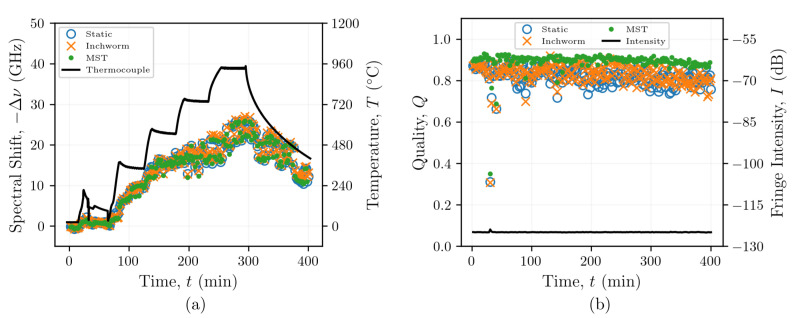
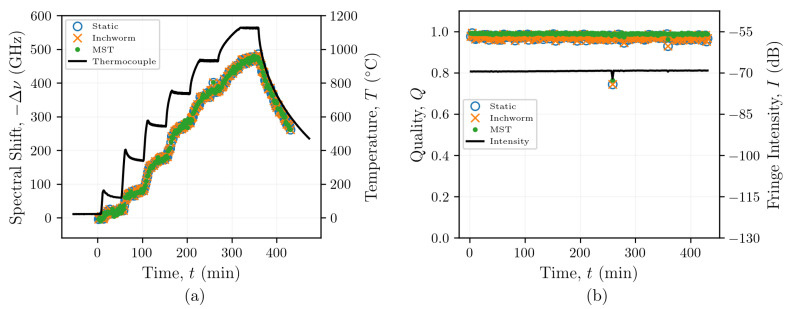
Optical backscatter reflectometry (OBR) is an interferometric technique that can be used to measure local changes in temperature and mechanical strain based on spectral analyses of backscattered light from a singlemode optical fiber. The technique uses Fourier analyses to resolve spectra resulting from reflections occurring over a discrete region along the fiber. These spectra are cross-correlated with reference spectra to calculate the relative spectral shifts between measurements. The maximum of the cross-correlated spectra-termed quality-is a metric that quantifies the degree of correlation between the two measurements. Recently, this quality metric was incorporated into an adaptive algorithm to (1) selectively vary the reference measurement until the quality exceeds a predefined threshold and (2) calculate incremental spectral shifts that can be summed to determine the spectral shift relative to the initial reference. Using a graphical (network) framework, this effort demonstrated the optimal reconstruction of distributed OBR measurements for all sensing locations using a maximum spanning tree (MST). By allowing the reference to vary as a function of both time and sensing location, the MST and other adaptive algorithms could resolve spectral shifts at some locations, even if others can no longer be resolved.

Keywords: adaptive methods; distributed sensing; graph signal processing; optical backscatter reflectometry; optical fibers; optical frequency domain reflectometry.


Conflict of interest statement

D.C.S. and C.M.P. a pending patent related to the present work.

Figures

Figure A1
Figure A1
Spectral shifts (a) and qualities (b) of reconstructions of data from the region of the SMF-28 optical fiber outside of the furnace produced using the static reference, the inchworm algorithm, and MST post-processing methods. The temperatures indicated by the black line are indicative of the furnace temperature at the time of recording and are the cause for the smaller spectral shifts, relative to Figure 5.
Figure A2
Figure A2
Spectral shifts (a) and qualities (b) of reconstructions of data from the region of the FBG fiber optical fiber outside of the furnace produced using the static reference, the inchworm algorithm, and MST post-processing methods. The temperatures indicated by the black line are indicative of the furnace temperature at the time of recording and are the cause for the smaller spectral shifts, relative to Figure 7.
Figure 1
Figure 1
(a) Optical backscatter reflectometry (OBR) schematic showing how a tunable laser source (TLS) is used to produce an interference pattern resulting from Rayleigh backscatter along the fiber under test (FUT). The S- and P-polarization states are recorded separately by photodiodes PDS and PDP, respectively. The Fourier-transformed measurements are discretized into individual sensors or gauges (with indices n0, n1, nN) that can be analyzed separately to provide spatially distributed measurements. (b) Schematic of Rayleigh backscatter in a step-index singlemode optical fiber with light propagating through the fiber and reflected by local scattering centers.
Figure 2
Figure 2
Examples of OBR measurements made during thermal testing using fibers with and without FBGs: (a) x domain data from a fiber without FBGs at room temperature and after heating to 750 and 950 °C, (b) ν domain data from A between 19.050 m and 19.060 m, (c) x domain data from a fiber with inscribed femtosecond Type-II FBGs at room temperature and after heating to 810 and 1130 °C, and (d) ν domain data from (c) between 22.187 and 22.193 m.
Figure 3
Figure 3
Flow diagram for Kruskal’s algorithm, where Gn* indicates a maximum spanning tree of Gn.
Figure 4
Figure 4
Examples of graphs generated from a heated SMF-28 optical fiber using a static reference (a), the inchworm algorithm [31] (b), and a maximum spanning tree (MST) algorithm (c). The node representing the initial measurement (t=0 min) is shown in yellow, and the final measurement (t=400 min) is shown in green.
Figure 5
Figure 5
Spectral shifts (a) and qualities (b) of reconstructions of data from a heated SMF-28 optical fiber using the static reference, inchworm algorithm, and MST post-processing methods.
Figure 6
Figure 6
Examples of graphs generated from optical fibers with Type-II FBGs using a static reference (a), the inchworm algorithm [31] (b), and a maximum spanning tree (MST) algorithm (c). The node representing the initial measurement (t=0 min) is shown in yellow, and the final measurement (t=430 min) is shown in green.
Figure 7
Figure 7
Spectral shifts (a) and qualities (b) from reconstructions of data from a heated optical fiber with Type-II FBGs using the static reference, inchworm algorithm, and MST post-processing methods.
Figure 8
Figure 8
Quality determined using each reconstruction method compared to the spectral shift magnitude determined using the MST algorithm for sensors within the non-grated SMF-28 optical fiber (a) and the fiber with Type-II FBGs (b).
Figure 9
Figure 9
The computational efficiency of the static reference, inchworm, and MST reconstruction algorithms.

References

    1. Bao X., Chen L. Recent progress in distributed fiber optic sensors. Sensors. 2012;12:8601–8639. doi: 10.3390/s120708601. - DOI - PMC - PubMed
    1. Petrie C.M., Sridharan N. In situ measurement of phase transformations and residual stress evolution during welding using spatially distributed fiber-optic strain sensors. Meas. Sci. Technol. 2020;31:125602. doi: 10.1088/1361-6501/aba569. - DOI
    1. Heinze S., Echtermeyer A.T. A running reference analysis method to greatly improve optical backscatter reflectometry strain data from the inside of hardening and shrinking materials. Appl. Sci. 2018;8:1137. doi: 10.3390/app8071137. - DOI
    1. De Miguel-Soto V., Leandro D., Lopez-Aldaba A., Beato-López J.J., Pérez-Landazábal J.I., Auguste J.L., Jamier R., Roy P., Lopez-Amo M. Study of Optical Fiber Sensors for Cryogenic Temperature Measurements. Sensors. 2017;17:2773. doi: 10.3390/s17122773. - DOI - PMC - PubMed
    1. Nguyen H., Harold M.P., Luss D. Optical frequency domain reflectometry measurements of spatio-temporal temperature inside catalytic reactors: Applied to study wrong-way behavior. Chem. Eng. J. 2013;234:312–317. doi: 10.1016/j.cej.2013.08.074. - DOI

LinkOut - more resources