. 2021 Sep 14;21(18):6170.
doi: 10.3390/s21186170.

Accurate Reference Gas Mixtures Containing Tritiated Molecules: Their Production and Raman-Based Analysis

Affiliations

Accurate Reference Gas Mixtures Containing Tritiated Molecules: Their Production and Raman-Based Analysis

Simon Niemes et al. Sensors (Basel). .

Abstract

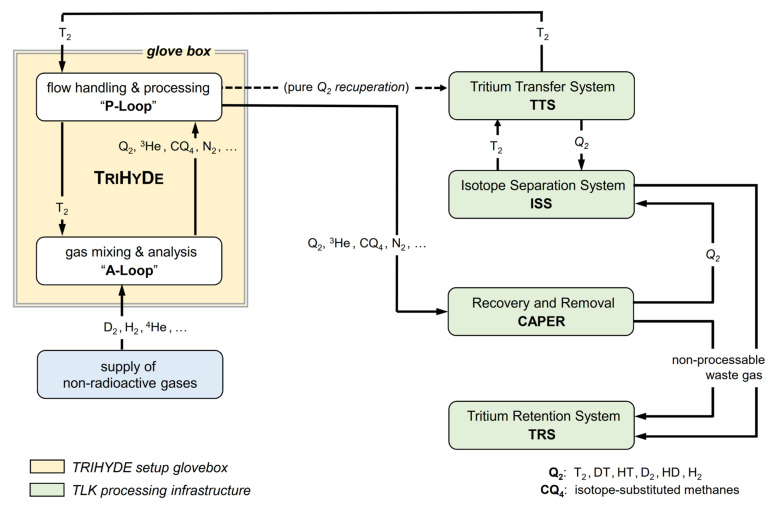
Highly accurate, quantitative analyses of mixtures of hydrogen isotopologues-both the stable species, H2, D2, and HD, and the radioactive species, T2, HT, and DT-are of great importance in fields as diverse as deuterium-tritium fusion, neutrino mass measurements using tritium β-decay, or for photonuclear experiments in which hydrogen-deuterium targets are used. In this publication we describe a production, handling, and analysis facility capable of fabricating well-defined gas samples, which may contain any of the stable and radioactive hydrogen isotopologues, with sub-percent accuracy for the relative species concentrations. The production is based on precise manometric gas mixing of H2, D2, and T2. The heteronuclear isotopologues HD, HT, and DT are generated via controlled, in-line catalytic reaction or by β-induced self-equilibration, respectively. The analysis was carried out using an in-line intensity- and wavelength-calibrated Raman spectroscopy system. This allows for continuous monitoring of the composition of the circulating gas during the self-equilibration or catalytic evolution phases. During all procedures, effects, such as exchange reactions with wall materials, were considered with care. Together with measurement statistics, these and other systematic effects were included in the determination of composition uncertainties of the generated reference gas samples. Measurement and calibration accuracy at the level of 1% was achieved.

Keywords: Raman spectroscopy; gas mixing; tritiated molecules; tritiated reference samples; β-induced self-equilibration.


Conflict of interest statement

The authors declare no conflict of interest.

Figures

Figure 1
Figure 1
Example Raman spectra of a H2-D2-T2 mixture (ratio 1:1:1) circulating in TRIHYDE, recorded at the beginning (black data trace) and after 100 h of circulation (red data trace); note that the Raman signal data shown here represent averages over 10 Raman measurement cycles of 1 min each. The Q1-branches of the six isotopologues, used in the evaluation of concentrations, are annotated (the peak positions by the dashed lines and the band integration intervals by associated brackets). The other features are S1- and O1-branch lines (to maintain clarity, only a few selected lines are annotated). In the lower panel, the spectral sensitivity calibration for LARA TRIHYDE is shown (normalization at λ = 633 nm); the “raw” Raman spectra were corrected using this response function, resulting in the displayed spectra. For full details, see Section 4.3.
Figure 2
Figure 2
Schematic overview of TRIHYDE and its integration into the TLK infrastructure. TRIHYDE consists of two linked loops for gas mixing and analysis (the A-Loop) and for flow handling/processing of gas mixtures (the P-Loop). Note that CQ4 stands for all isotope-substituted methanes, with Q = H, D, T. For details, see text.
Figure 3
Figure 3
Schematic of the analysis segment of TRIHYDE—the A-Loop. It comprises two volume-calibrated buffer vessels and a series of in-line measurement instruments; optionally, the circulating gas can be directed to pass through a catalyst (to speed up equilibrating/exchange reactions). For compositional analysis: LARA = laser Raman spectroscopy cell, BGA = binary gas analyzer; for activity monitoring: IC = ionization chamber, BIXS = beta-induced X-ray spectrometry unit. In addition, off-line compositional rest gas analysis (RGA) via mass spectrometry is incorporated. Gases can be admitted from the tritium transfer system, from external gas supplied, or via two sample ports. For details, see text.
Figure 4
Figure 4
Schematic of the processing segment of TRIHYDE—the P-Loop. Gases enter the loop either from the TTS tritium gas supply or are “waste” gases from the A-loop and exit the loop either to the A-loop or the TLK infrastructure units. The gas (mixtures) are moved and/or compressed by a series of pumps; TMP = turbomolecular pump; SP = scroll pump; MBP = metal bellows pump. Optional to simple gas distribution, the P-loop incorporates the capability of gas cleaning by circulation through a permeator. For details, see text.
Figure 5
Figure 5
Evolution of the composition of a D2-T2 sample (nominal starting mixture 40:60), associated with β-induced self-equilibration processes. Note that the T2 batch purity in the data shown here was only 97.5%, with most of the remainder being DT. The isotopologue concentrations shown here were extracted from the Raman spectra (signal intensity integrals of the Q1-branches); data points represent averages over time intervals of 20 min (corresponding to 20 individual LARA acquisitions). For further details, see text.
Figure 6
Figure 6
Theoretical Raman signals S1,ΔJJΦ1,ΔJJ·NJ,T for all six hydrogen isotopologues, with the transition probabilities Φ1,ΔJJ based on data provided in Ref. [26]. At the bottom, individual S1(J″) and O1(J″) lines are indicated, which might require deconvolution efforts during quantitative evaluation of the Q1(J″)-branch intensity integrals.
Figure 7
Figure 7
Calibration curves for gas mixtures of H2-T2 and D2-T2 (spectral sensitivity corrections and transition probability factors are incorporated in the relative Raman signals). All error bars (1σ) are expanded by a factor of ×5 in the display, for better visibility. Note that the top and bottom panels relate to the data of the initial mixture at t = 0 h and after full equilibration at t > 60 h, respectively. As an example, the straight-line curves for a hypothetical, theoretical intensity relation of RXY = 1 were added for the initial H2-T2 mixtures (top left panel). For further details, see text.
Figure 8
Figure 8
Calibration factor ratios, RH2,XY, with X, Y ∈ [H, D, T]; comparison between the experimental values derived in this TRIHYDE work and the calculated (theoretical) values used in the KATRIN experiment, based on the data given in Refs. [16,23].

References

    1. Dörr L., Besserer U., Bekris N., Bornschein B., Caldwell-Nichols C., Demange D., Cristescu I., Cristescu I.R., Glugla M., Hellriegel G., et al. A decade of tritium technology development and operation at the Tritium Laboratory Karlsruhe. Fusion Sci. Technol. 2008;54:143–148. doi: 10.13182/FST54-143. - DOI
    1. EUROfusion . European Research Roadmap to the Realisation of Fusion Energy. EUROfusion; Garching, Germany: 2018. [(accessed on 14 July 2021)]. Available online: https://www.euro-fusion.org/fileadmin/user_upload/EUROfusion/Documents/2....
    1. Aker M., Altenmüller K., Amsbaugh J.F., Arenz M., Babutzka M., Bast J., Bauer S., Bechtler H., Beck M., Beglarian A., et al. (KATRIN Collaboration). The design, construction, and commissioning of the KATRIN experiment. J. Instrum. 2021;16:T08015. doi: 10.1088/1748-0221/16/08/T08015. - DOI
    1. Aker M., Altenmüller K., Beglarian A., Behrens J., Berlev A., Besserer U., Bieringer B., Blaum K., Block F., Bornschein B., et al. (KATRIN Collaboration). Analysis methods for the first KATRIN neutrino-mass measurement. Phys. Rev. D. 2021;104:012005. doi: 10.1103/PhysRevD.104.012005. - DOI
    1. Fichet P., Bultel A., Markelj S., Moreno C. Review of the Different Techniques to Analyse Tritium; EU Horizon 2020 Research and Innovation Programme, TRANSversal Actions for Tritium; Contract # 754586; Report D2.1. 2018. [(accessed on 7 June 2021)]. Available online: https://transat-h2020.eu/wp-content/uploads/2020/04/TRANSAT_D2_1.pdf.

LinkOut - more resources