. 2021 Sep 17;21(18):6242.
doi: 10.3390/s21186242.

Detecting Climate Driven Changes in Chlorophyll-a Using High Frequency Monitoring: The Impact of the 2019 European Heatwave in Three Contrasting Aquatic Systems

Affiliations

Detecting Climate Driven Changes in Chlorophyll-a Using High Frequency Monitoring: The Impact of the 2019 European Heatwave in Three Contrasting Aquatic Systems

Gary Free et al. Sensors (Basel). .

Abstract

The frequency of heatwave events in Europe is increasing as a result of climate change. This can have implications for the water quality and ecological functioning of aquatic systems. We deployed three spectroradiometer WISPstations at three sites in Europe (Italy, Estonia, and Lithuania/Russia) to measure chlorophyll-a at high frequency. A heatwave in July 2019 occurred with record daily maximum temperatures over 40 °C in parts of Europe. The effects of the resulting storm that ended the heatwave were more discernable than the heatwave itself. Following the storm, chlorophyll-a concentrations increased markedly in two of the lakes and remained high for the duration of the summer while at one site concentrations increased linearly. Heatwaves and subsequent storms appeared to play an important role in structuring the phenology of the primary producers, with wider implications for lake functioning. Chlorophyll-a peaked in early September, after which a wind event dissipated concentrations until calmer conditions returned. Synoptic coordinated high frequency monitoring needs to be advanced in Europe as part of water management policy and to improve knowledge on the implications of climate change. Lakes, as dynamic ecosystems with fast moving species-succession, provide a prism to observe the scale of future change.

Keywords: Cyanobacteria blooms; WISPstation; chlorophyll-a; climate change; high-frequency monitoring; lagoon; lake; phytoplankton.


Conflict of interest statement

The authors declare no conflict of interest.

Figures

Figure 1
Figure 1
Map of Europe showing the three WISPstation sites together with atmospheric pressure (Pa) on the 28 July 2019 indicating the weather system that marked the end of the July heatwave.
Figure 2
Figure 2
Photograph of the WISPstation in Lake Trasimeno (Italy). Red box in photo indicates the layout and installation of the instrument which is further detailed in the diagram on the right from Peters et al. [61] as follows: 2 Radiance channels collecting Lup and Lsky in the NNW direction; 2 Radiance channels collecting Lup and Lsky in the NNE direction; 2 Irradiance channels (Ed); 1 unexposed dark radiance (L) channel for evaluation of radiance channel degradation; 1 unexposed dark irradiance (E) channel for evaluation of the degradation of irradiance channels.
Figure 3
Figure 3
Schematic diagram of data acquisition and analysis carried out.
Figure 4
Figure 4
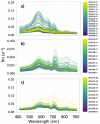
Daily averages of Remote sensing reflectances (Rrs) for the period of measurement in Lake Trasimeno from 1 June to 31 December 2019 (a), Curonian Lagoon (b), and Lake Võrtsjärv (c) from 1 June to 31 October 2019. Black continuous line is the Rrs mean value computed over the entire period and black dotted lines are the relative 5th and 95th percentiles.
Figure 5
Figure 5
Average hourly (UTC time) Chl-a (with standard error), relativized to maximum value per day.
Figure 6
Figure 6
Boxplots of environmental parameters (a) wind speed, (b) solar irradiance and (c) air temperature for the different clusters.
Figure 7
Figure 7
Lake Trasimeno Chl-a (hourly), air temperature (hourly), rain (daily total), and wind speed (hourly) between July and September 2019. Dashed red lines indicate 27 July, 21 August, and 22 September 2019.
Figure 8
Figure 8
Lake Võrtsjärv Chl-a (hourly), air temperature (hourly), rain (daily total), and wind speed (hourly) between July and September 2019. Dashed red lines indicate 27 July, 21 August, and 22 September 2019.
Figure 9
Figure 9
Curonian Lagoon Chl-a (hourly), air temperature (hourly), rain (daily total), and wind speed (hourly) between July and September 2019. Dashed red lines indicate 27 July, 21 August, and 22 September 2019.

References

    1. Likens G.E. Encyclopedia of Inland Waters. Academic Press; Cambridge, MA, USA: 2010. Lake ecosystem ecology: A global perspective.
    1. Lewis W.M. Encyclopedia of Inland Waters. Academic Press; Cambridge, MA, USA: 2014. Lakes as Ecosystems.
    1. Michalak A.M. Study role of climate change in extreme threats to water quality. Nature. 2016;535:349–350. doi: 10.1038/535349a. - DOI - PubMed
    1. Bennett M.G., Schofield K.A., Lee S.S., Norton S.B. Response of chlorophyll a to total nitrogen and total phosphorus concentrations in lotic ecosystems: A systematic review protocol. Environ. Évid. 2017;6:1–13. doi: 10.1186/s13750-017-0097-8. - DOI - PMC - PubMed
    1. Reid A.J., Carlson A.K., Creed I.F., Eliason E.J., Gell P.A., Johnson P.T.J., Kidd K.A., MacCormack T.J., Olden J.D., Ormerod S.J., et al. Emerging threats and persistent conservation challenges for freshwater biodiversity. Biol. Rev. 2018;94:849–873. doi: 10.1111/brv.12480. - DOI - PubMed

LinkOut - more resources