. 2021 Sep 20;21(18):6300.
doi: 10.3390/s21186300.

EEG Mental Stress Assessment Using Hybrid Multi-Domain Feature Sets of Functional Connectivity Network and Time-Frequency Features

Affiliations

EEG Mental Stress Assessment Using Hybrid Multi-Domain Feature Sets of Functional Connectivity Network and Time-Frequency Features

Ala Hag et al. Sensors (Basel). .

Abstract

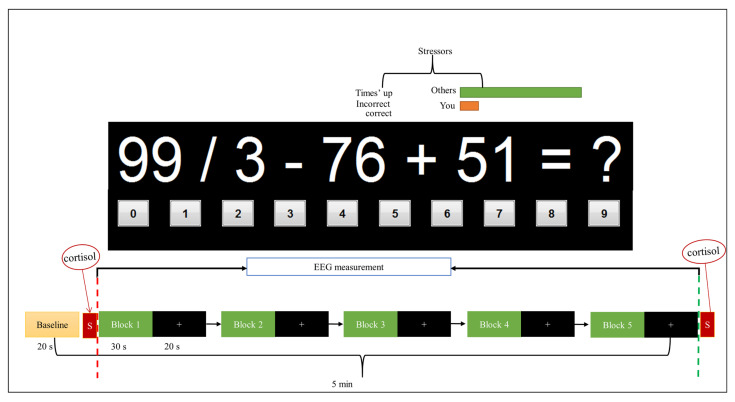
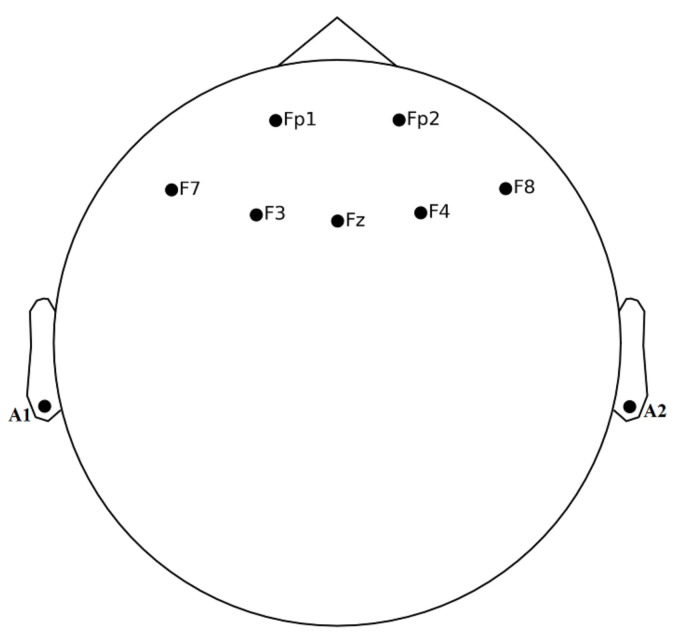
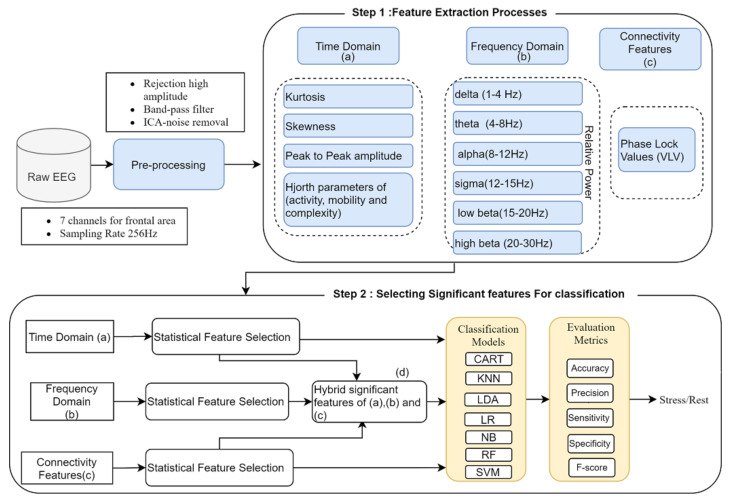
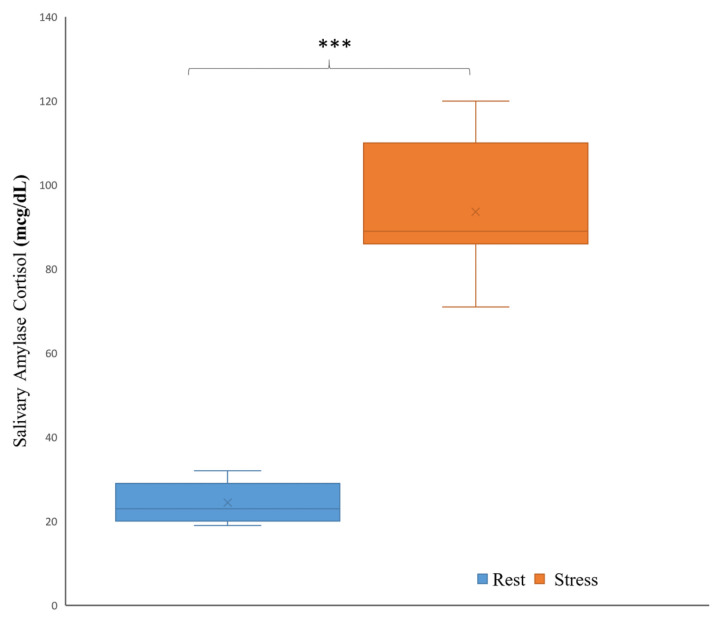
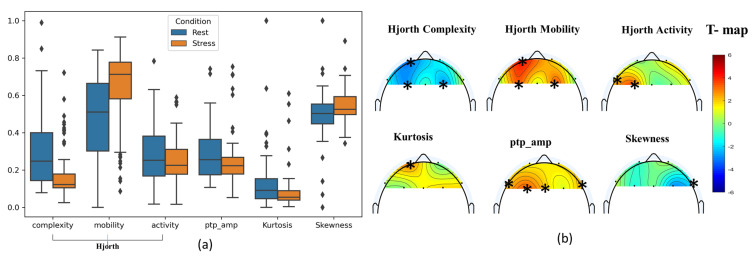
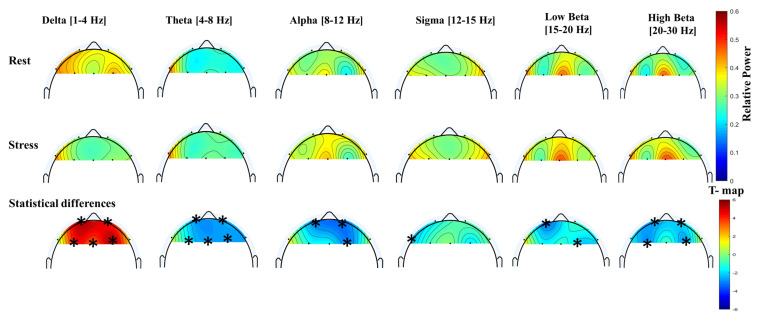
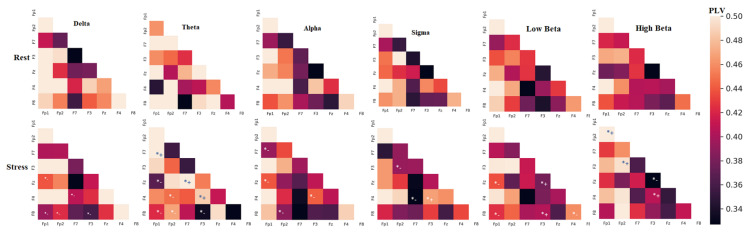
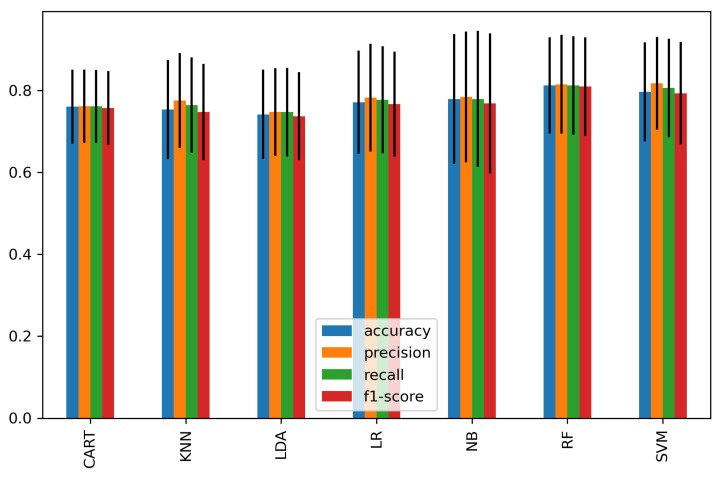
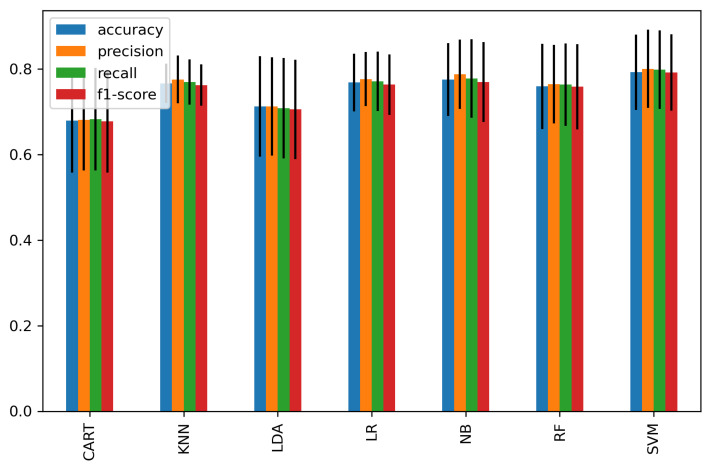
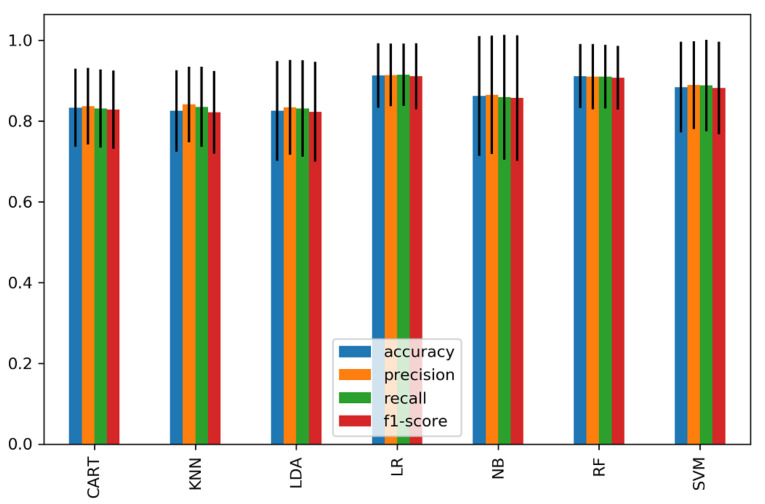
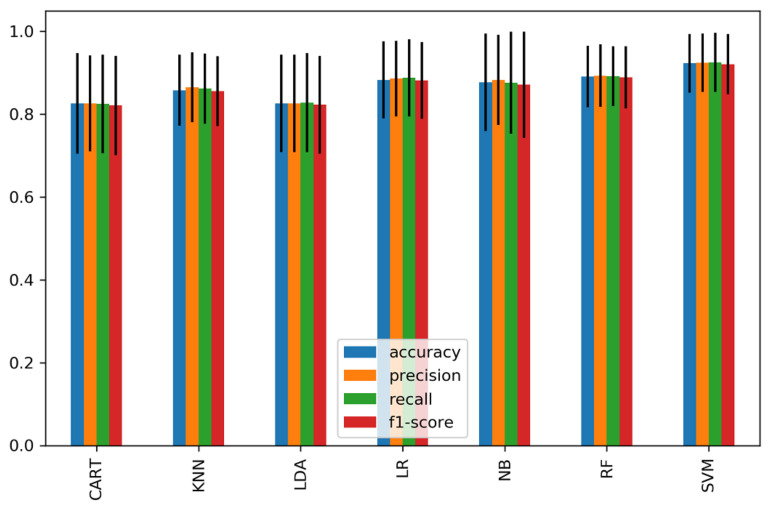
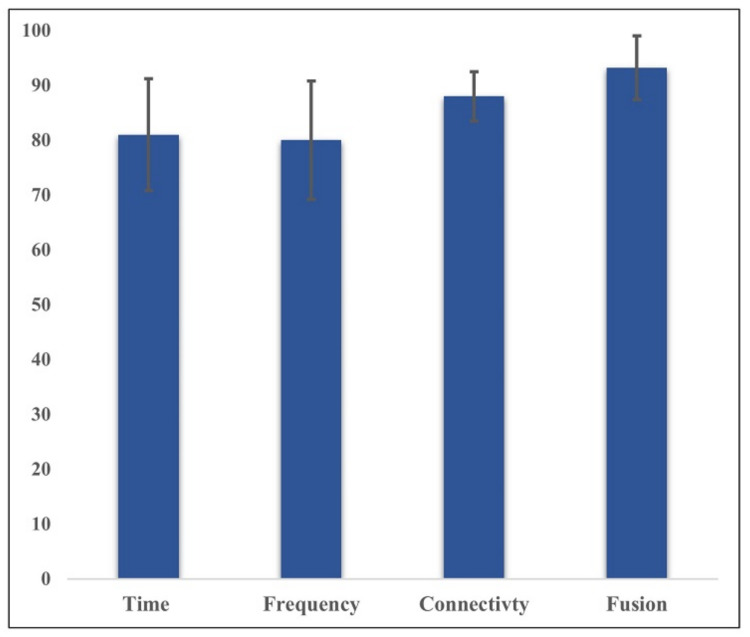
Exposure to mental stress for long period leads to serious accidents and health problems. To avoid negative consequences on health and safety, it is very important to detect mental stress at its early stages, i.e., when it is still limited to acute or episodic stress. In this study, we developed an experimental protocol to induce two different levels of stress by utilizing a mental arithmetic task with time pressure and negative feedback as the stressors. We assessed the levels of stress on 22 healthy subjects using frontal electroencephalogram (EEG) signals, salivary alpha-amylase level (AAL), and multiple machine learning (ML) classifiers. The EEG signals were analyzed using a fusion of functional connectivity networks estimated by the Phase Locking Value (PLV) and temporal and spectral domain features. A total of 210 different features were extracted from all domains. Only the optimum multi-domain features were used for classification. We then quantified stress levels using statistical analysis and seven ML classifiers. Our result showed that the AAL level was significantly increased (p < 0.01) under stress condition in all subjects. Likewise, the functional connectivity network demonstrated a significant decrease under stress, p < 0.05. Moreover, we achieved the highest stress classification accuracy of 93.2% using the Support Vector Machine (SVM) classifier. Other classifiers produced relatively similar results.

Keywords: electroencephalography; feature extraction; functional connectivity network; machine learning; mental stress; time-frequency features.


Conflict of interest statement

The authors declare no conflict of interest.

Figures

Figure 1
Figure 1
Experiment block design. A total of five active blocks for each task with salivary alpha amylase (SAA) cortisol was collected before and after the stress task and presented by the letter S with a red background. For each block, arithmetic tasks are given for the 30 s followed by 20 s of rest. The red dashed line marks the start of the task, and the green dashed line marks the end of the task (the marking is done at every block).
Figure 2
Figure 2
EEG Channels’ Position on Scalp.
Figure 3
Figure 3
Proposed ML methodology flow chart for mental stress state recognition.
Figure 4
Figure 4
The mean and standard deviation of the salivary amylase cortisol measured by (mcg/dL) for rest and stress conditions.
Figure 5
Figure 5
(a) The mean and standard deviation using scatter for time-domain features of the Hjorth complexity, Hjorth mobility, Hjorth activity, kurtosis, peak-to-peak amplitude (ptp_amp), and skewness of EEG signals at 1–30 Hz for stress and rest conditions. The difference between stress and rest is shown using T-maps in (b). The star (*) symbols denote statistically significant electrodes using topographic maps (two-sample t-test; p < 0.01, Bonferroni correction).
Figure 6
Figure 6
The mean topographic maps for relative bands power of delta, theta, alpha, sigma, low beta, and high beta at 1–30 Hz for rest and stress conditions. The difference between stress and rest relative powers are shown using T-maps. The star (*) symbols denote to the significant electrodes related to specific feature (two-sample t-test; p < 0.01, Bonferroni correction).
Figure 7
Figure 7
The PLV connectivity network among EEG channel pairs over all trails for rest and stress condition. The star (*) symbol denotes the significant connections between electrodes selected by the t-test.
Figure 8
Figure 8
The average classification performance and standard deviation σ of 15 significant features of the time domain. The vertical line indicates σ.
Figure 9
Figure 9
The average classification performance and standard deviation of 20 significant features from the frequency domain.
Figure 10
Figure 10
The average classification performance and standard deviation of all significant connectivity network features of PLV.
Figure 11
Figure 11
The average classification performance and standard deviation of hybrid features consisting of 42 significant features from the time domain, frequency domain, and connectivity network.
Figure 12
Figure 12
A summary comparison between the average accuracy of single subset domain features (time domain, frequency domain, connectivity network features) and the fusion of all three using SVM.

Similar articles

Cited by

References

    1. Asif A., Majid M., Anwar S.M. Human stress classification using EEG signals in response to music tracks. Comput. Biol. Med. 2019;107:182–196. doi: 10.1016/j.compbiomed.2019.02.015. - DOI - PubMed
    1. Can Y.S., Arnrich B., Ersoy C. Stress Detection in Daily Life Scenarios Using Smart Phones and Wearable Sensors: A Survey. J. Biomed. Inform. 2019;92:103139. doi: 10.1016/j.jbi.2019.103139. - DOI - PubMed
    1. Song H., Fang F., Arnberg F.K., Mataix-Cols D., De La Cruz L.F., Almqvist C., Fall K., Lichtenstein P., Thorgeirsson G., Valdimarsdóttir U.A. Stress related disorders and risk of cardiovascular disease: Population based, sibling controlled cohort study. BMJ. 2019;365:1–10. doi: 10.1136/bmj.l1255. - DOI - PMC - PubMed
    1. Blanding M. HBS Working Knowledge. Forbes; Jersey City, NJ, USA: 2015. [(accessed on 9 July 2021)]. Workplace Stress Responsible for up to $190B in Annual U.S. Healthcare Costs. Available online: https://www.forbes.com/sites/hbsworkingknowledge/2015/01/26/workplace-st....
    1. Daudelin-Peltier C., Forget H., Blais C., Deschênes A., Fiset D. The effect of acute social stress on the recognition of facial expression of emotions. Sci. Rep. 2017;7:1036. doi: 10.1038/s41598-017-01053-3. - DOI - PMC - PubMed

LinkOut - more resources