

Subtyping Hyperchloremia among Hospitalized Patients by Machine Learning Consensus Clustering
- PMID: 34577826
- PMCID: PMC8465989
- DOI: 10.3390/medicina57090903
Subtyping Hyperchloremia among Hospitalized Patients by Machine Learning Consensus Clustering
Abstract
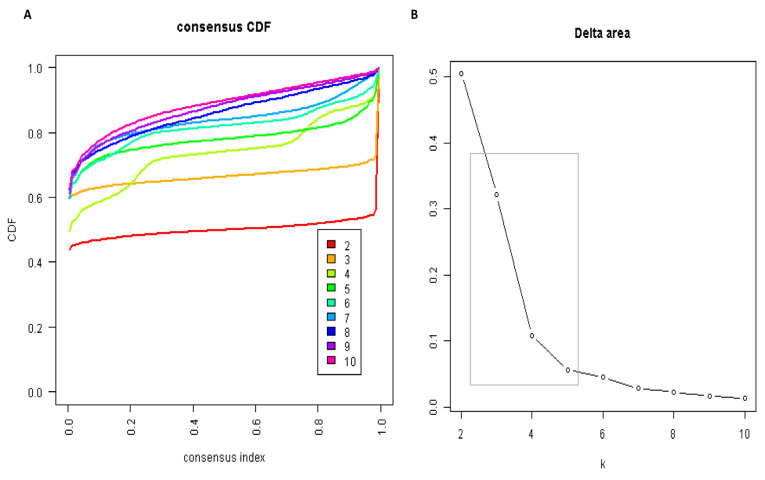
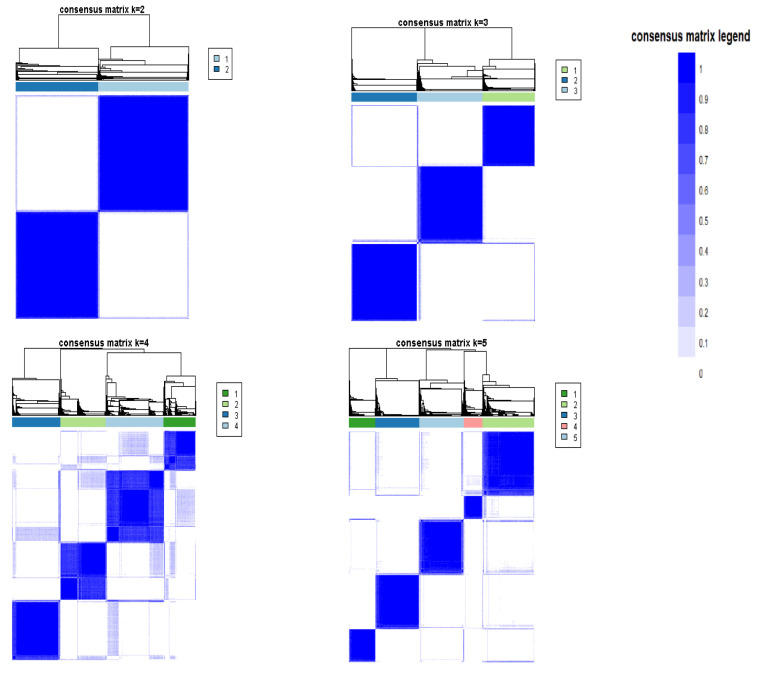
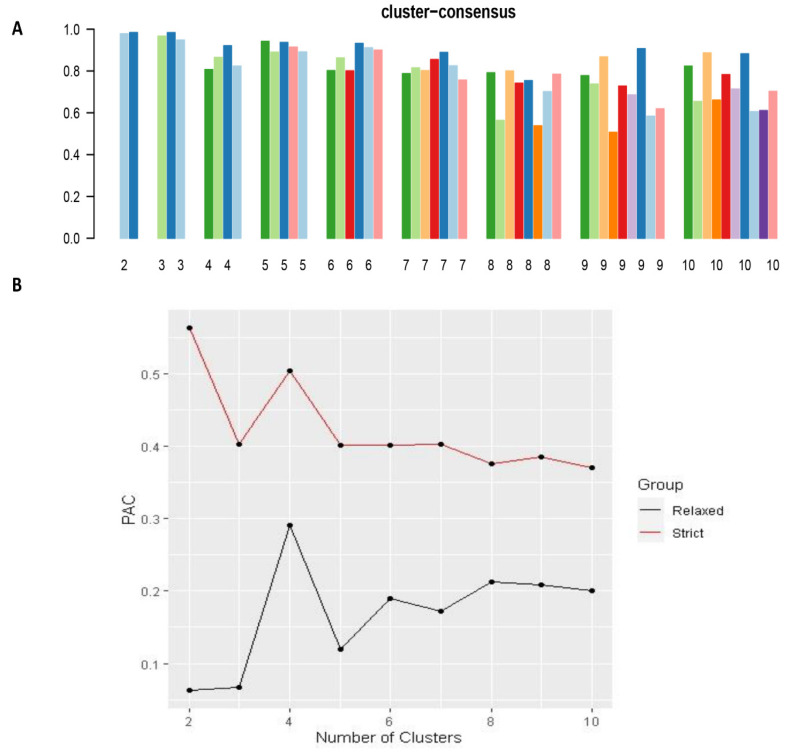
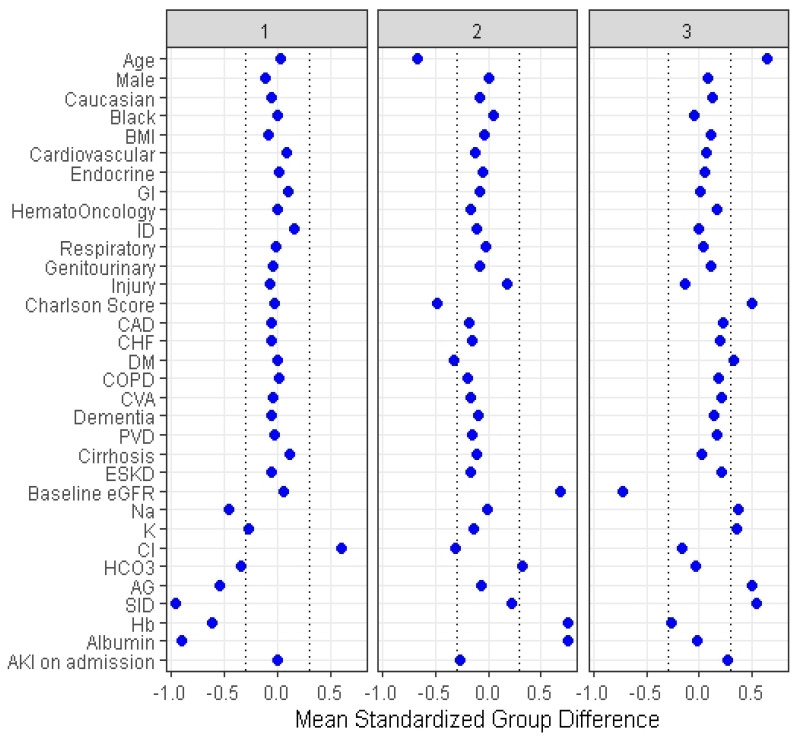
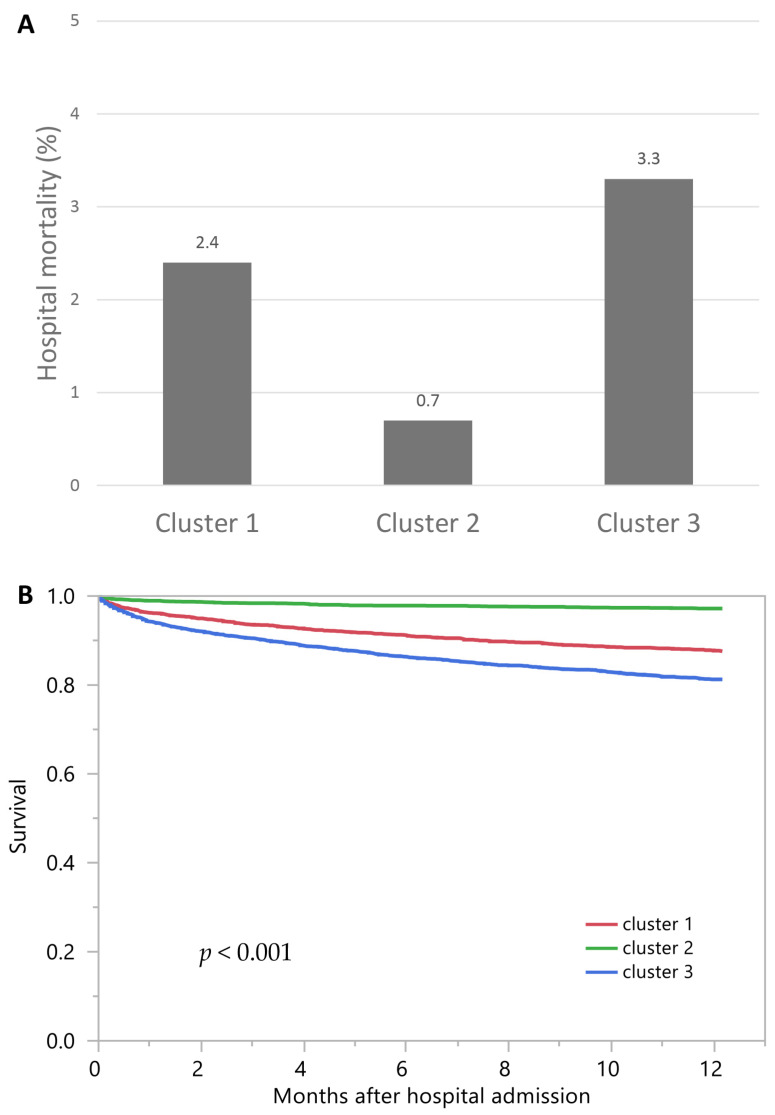
Background and Objectives: Despite the association between hyperchloremia and adverse outcomes, mortality risks among patients with hyperchloremia have not consistently been observed among all studies with different patient populations with hyperchloremia. The objective of this study was to characterize hyperchloremic patients at hospital admission into clusters using an unsupervised machine learning approach and to evaluate the mortality risk among these distinct clusters. Materials and Methods: We performed consensus cluster analysis based on demographic information, principal diagnoses, comorbidities, and laboratory data among 11,394 hospitalized adult patients with admission serum chloride of >108 mEq/L. We calculated the standardized mean difference of each variable to identify each cluster's key features. We assessed the association of each hyperchloremia cluster with hospital and one-year mortality. Results: There were three distinct clusters of patients with admission hyperchloremia: 3237 (28%), 4059 (36%), and 4098 (36%) patients in clusters 1 through 3, respectively. Cluster 1 was characterized by higher serum chloride but lower serum sodium, bicarbonate, hemoglobin, and albumin. Cluster 2 was characterized by younger age, lower comorbidity score, lower serum chloride, and higher estimated glomerular filtration (eGFR), hemoglobin, and albumin. Cluster 3 was characterized by older age, higher comorbidity score, higher serum sodium, potassium, and lower eGFR. Compared with cluster 2, odds ratios for hospital mortality were 3.60 (95% CI 2.33-5.56) for cluster 1, and 4.83 (95% CI 3.21-7.28) for cluster 3, whereas hazard ratios for one-year mortality were 4.49 (95% CI 3.53-5.70) for cluster 1 and 6.96 (95% CI 5.56-8.72) for cluster 3. Conclusions: Our cluster analysis identified three clinically distinct phenotypes with differing mortality risks in hospitalized patients with admission hyperchloremia.
Keywords: artificial intelligence; chloride; clustering; hospitalization; hyperchloremia; machine learning; mortality.
Conflict of interest statement
The authors declare no conflict of interest.
Figures
References
MeSH terms
LinkOut - more resources
Full Text Sources
Medical
Research Materials
Miscellaneous
