

Distinct Impact of Natural Sugars from Fruit Juices and Added Sugars on Caloric Intake, Body Weight, Glycaemia, Oxidative Stress and Glycation in Diabetic Rats
- PMID: 34578832
- PMCID: PMC8468124
- DOI: 10.3390/nu13092956
Distinct Impact of Natural Sugars from Fruit Juices and Added Sugars on Caloric Intake, Body Weight, Glycaemia, Oxidative Stress and Glycation in Diabetic Rats
Abstract
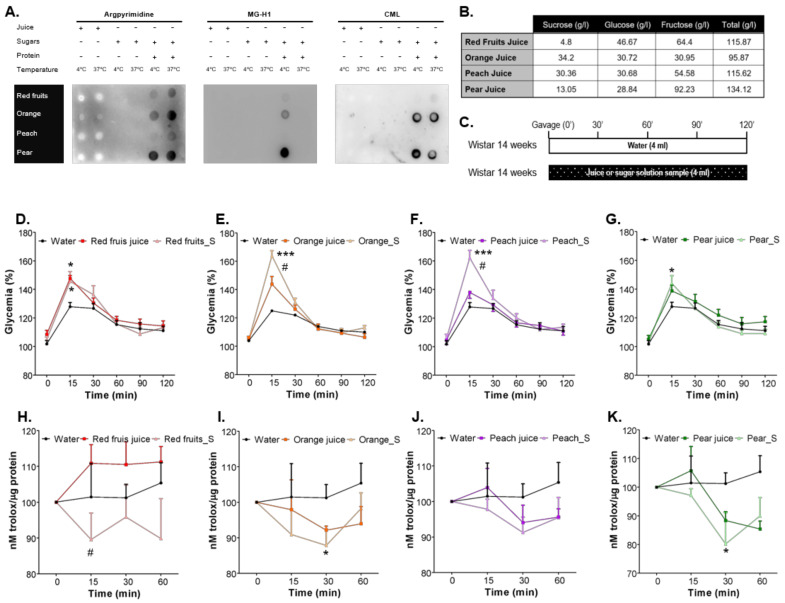
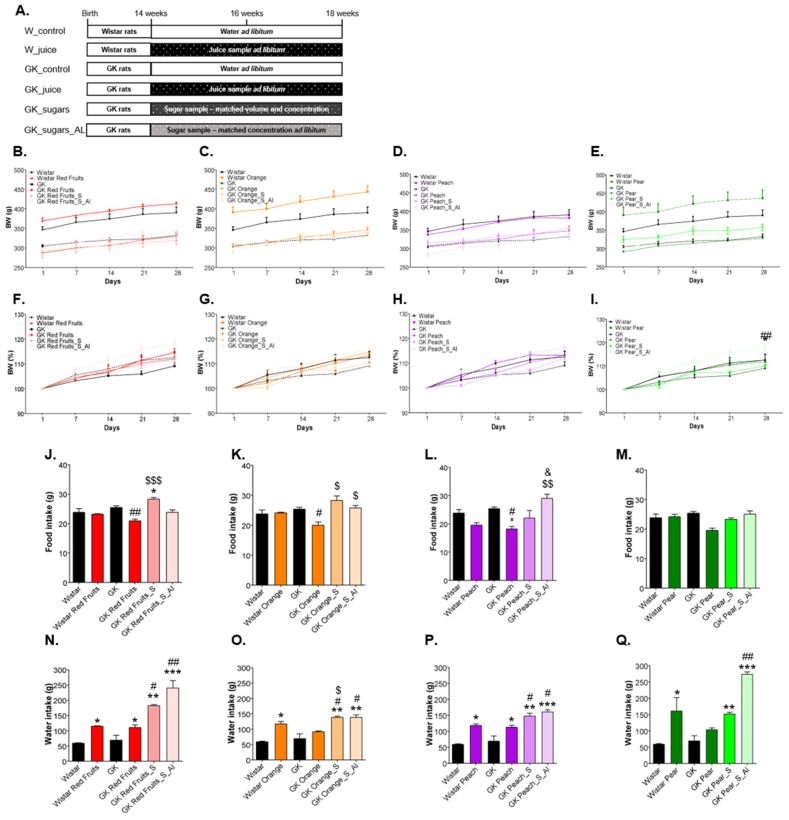
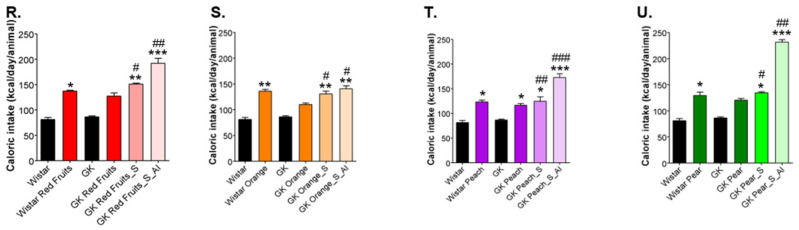
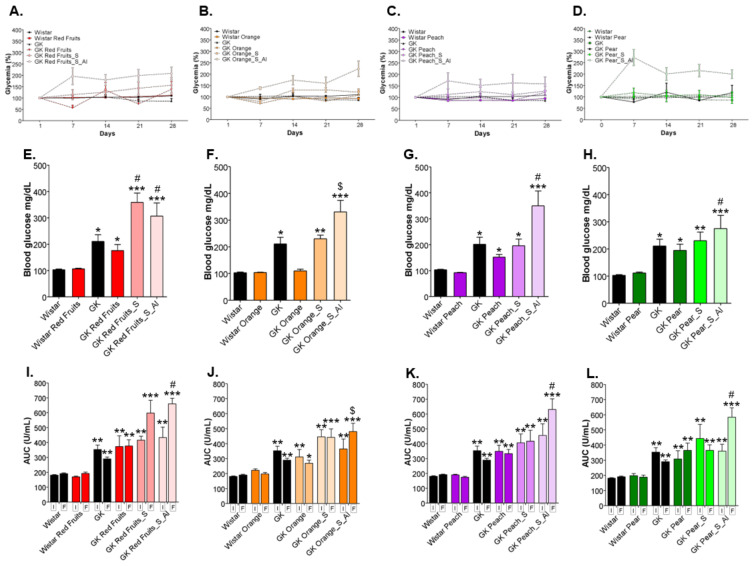
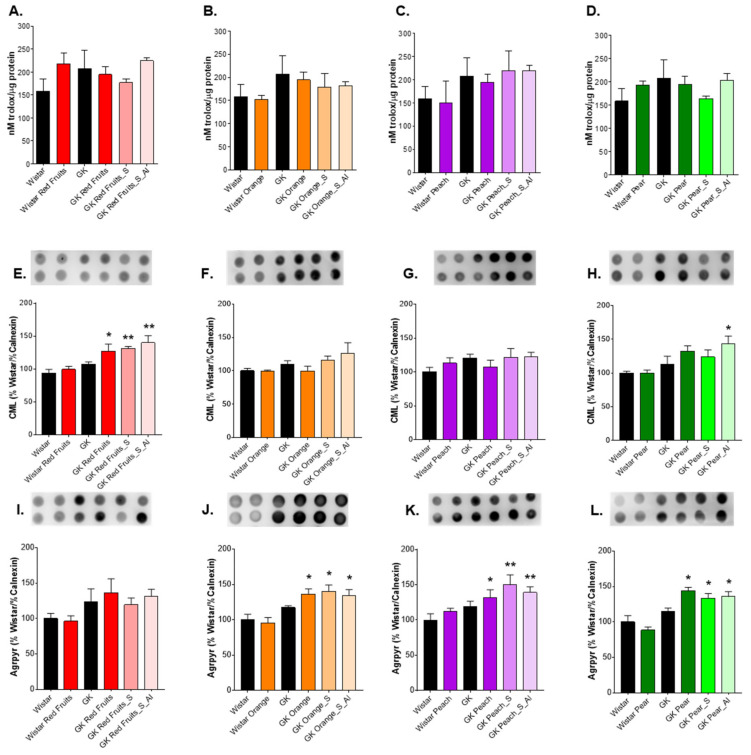
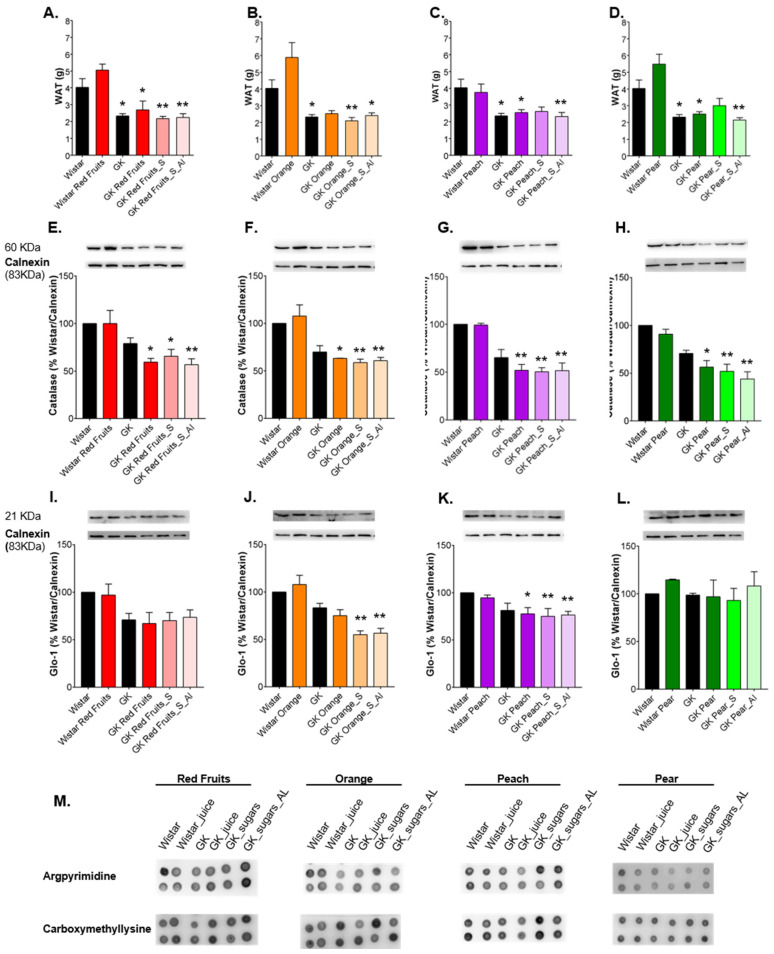
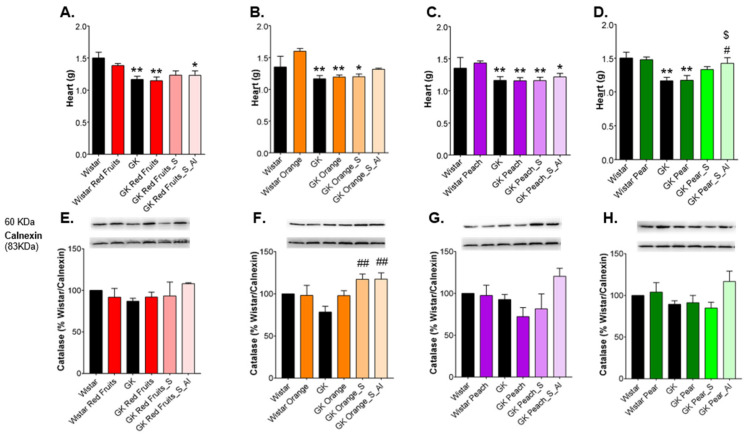
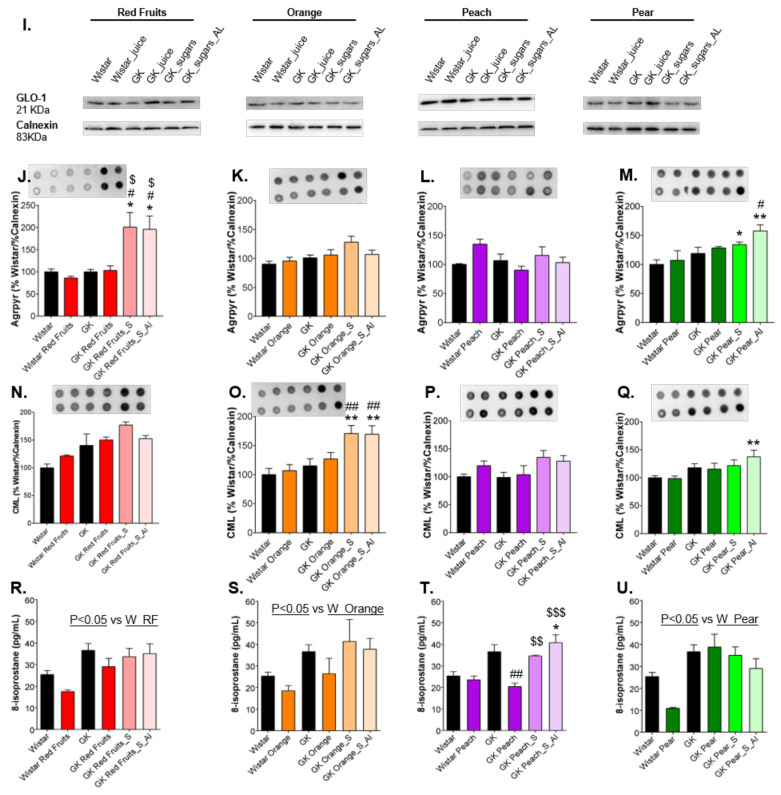
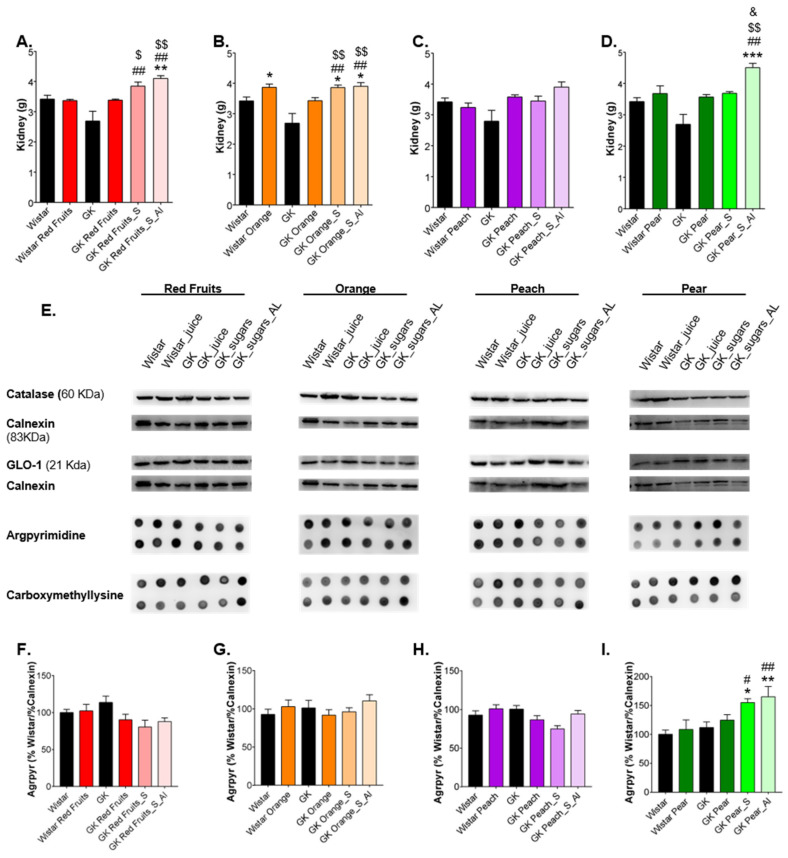
Although fruit juices are a natural source of sugars, there is a controversy whether their sugar content has similar harmful effects as beverages' added-sugars. We aimed to study the role of fruit juice sugars in inducing overweight, hyperglycaemia, glycation and oxidative stress in normal and diabetic animal models. In diabetic Goto-Kakizaki (GK) rats, we compared the effects of four different fruit juices (4-weeks) with sugary solutions having a similar sugar profile and concentration. In vitro, the sugary solutions were more susceptible to AGE formation than fruit juices, also causing higher postprandial glycaemia and lower erythrocytes' antioxidant capacity in vivo (single intake). In GK rats, ad libitum fruit juice consumption (4-weeks) did not change body weight, glycaemia, oxidative stress nor glycation. Consumption of a matched volume of sugary solutions aggravated fasting glycaemia but had a moderate impact on caloric intake and oxidative stress/glycation markers in tissues of diabetic rats. Ad libitum availability of the same sugary solutions impaired energy balance regulation, leading to higher caloric intake than ad libitum fruit juices and controls, as well as weight gain, fasting hyperglycaemia, insulin intolerance and impaired oxidative stress/glycation markers in several tissues. We demonstrated the distinct role of sugars naturally present in fruit juices and added sugars in energy balance regulation, impairing oxidative stress, glycation and glucose metabolism in an animal model of type 2 diabetes.
Keywords: fruit juices; glycation; hyperglycaemia; natural and added sugars; oxidative stress.
Conflict of interest statement
The study was supported by SUMOL + COMPAL S.A., which is a producer of nectars, soft drinks and 100% fruit juices, having products with only naturally present and with added sugars in their portfolio.
Figures


Similar articles
-
Food sources of fructose-containing sugars and glycaemic control: systematic review and meta-analysis of controlled intervention studies.BMJ. 2018 Nov 21;363:k4644. doi: 10.1136/bmj.k4644. BMJ. 2018. PMID: 30463844 Free PMC article.
-
High orange juice consumption with or in-between three meals a day differently affects energy balance in healthy subjects.Nutr Diabetes. 2018 Apr 25;8(1):19. doi: 10.1038/s41387-018-0031-3. Nutr Diabetes. 2018. PMID: 29695707 Free PMC article. Clinical Trial.
-
Sugar in Infants, Children and Adolescents: A Position Paper of the European Society for Paediatric Gastroenterology, Hepatology and Nutrition Committee on Nutrition.J Pediatr Gastroenterol Nutr. 2017 Dec;65(6):681-696. doi: 10.1097/MPG.0000000000001733. J Pediatr Gastroenterol Nutr. 2017. PMID: 28922262 Review.
-
Are Fruit Juices Healthier Than Sugar-Sweetened Beverages? A Review.Nutrients. 2019 May 2;11(5):1006. doi: 10.3390/nu11051006. Nutrients. 2019. PMID: 31052523 Free PMC article. Review.
-
Are all sugars equal? Role of the food source in physiological responses to sugars with an emphasis on fruit and fruit juice.Eur J Nutr. 2024 Aug;63(5):1435-1451. doi: 10.1007/s00394-024-03365-3. Epub 2024 Mar 16. Eur J Nutr. 2024. PMID: 38492022 Free PMC article. Review.
Cited by
-
New Therapeutic Strategies for Obesity and Its Metabolic Sequelae: Brazilian Cerrado as a Unique Biome.Int J Mol Sci. 2023 Oct 25;24(21):15588. doi: 10.3390/ijms242115588. Int J Mol Sci. 2023. PMID: 37958572 Free PMC article. Review.
-
Improvement of Glycaemia and Endothelial Function by a New Low-Dose Curcuminoid in an Animal Model of Type 2 Diabetes.Int J Mol Sci. 2022 May 18;23(10):5652. doi: 10.3390/ijms23105652. Int J Mol Sci. 2022. PMID: 35628465 Free PMC article.
-
Dietary habits and risk of diabetic kidney disease: a two-sample and multivariate Mendelian randomization study.Ren Fail. 2025 Dec;47(1):2438848. doi: 10.1080/0886022X.2024.2438848. Epub 2025 Mar 12. Ren Fail. 2025. PMID: 40074716 Free PMC article.
-
Impact of Diet Composition on Insulin Resistance.Nutrients. 2022 Sep 9;14(18):3716. doi: 10.3390/nu14183716. Nutrients. 2022. PMID: 36145093 Free PMC article.
References
-
- Bernardo G.L., Jomori M.M., Fernandes A.C., da Costa Proença R.P. Consumo alimentar de estudantes universitários. Rev. Nutr. 2017;30:847–865. doi: 10.1590/1678-98652017000600016. - DOI
MeSH terms
Substances
Grants and funding
LinkOut - more resources
Full Text Sources
Medical
