Randomized Controlled Trial
. 2021 Sep 18;13(9):3248.
doi: 10.3390/nu13093248.

The Gut Microbiota during a Behavioral Weight Loss Intervention

Affiliations
Randomized Controlled Trial

The Gut Microbiota during a Behavioral Weight Loss Intervention

Maggie A Stanislawski et al. Nutrients. .

Abstract

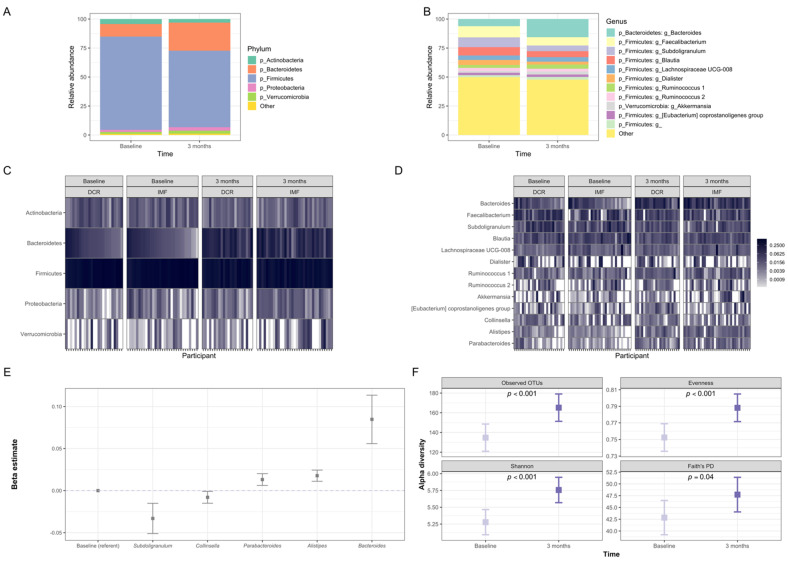
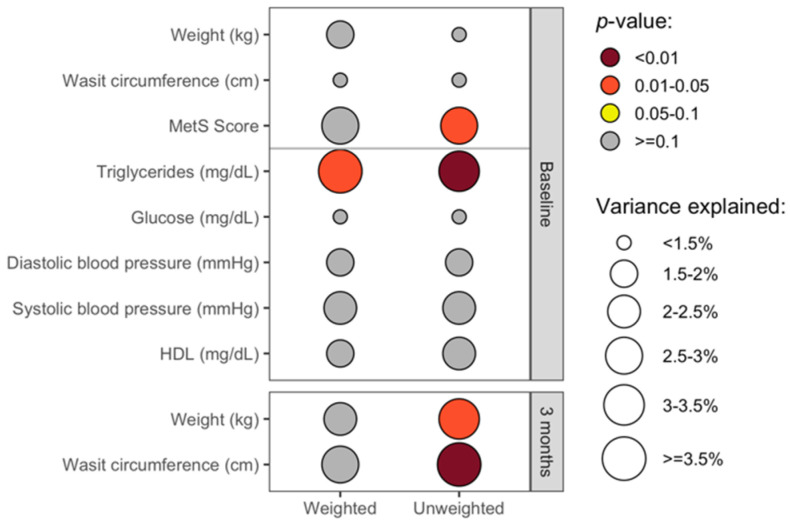
Altered gut microbiota has been linked to obesity and may influence weight loss. We are conducting an ongoing weight loss trial, comparing daily caloric restriction (DCR) to intermittent fasting (IMF) in adults who are overweight or obese. We report here an ancillary study of the gut microbiota and selected obesity-related parameters at the baseline and after the first three months of interventions. During this time, participants experienced significant improvements in clinical health measures, along with altered composition and diversity of fecal microbiota. We observed significant associations between the gut microbiota features and clinical measures, including weight and waist circumference, as well as changes in these clinical measures over time. Analysis by intervention group found between-group differences in the relative abundance of Akkermansia in response to the interventions. Our results provide insight into the impact of baseline gut microbiota on weight loss responsiveness as well as the early effects of DCR and IMF on gut microbiota.

Keywords: intermittent fasting; microbiota; obesity; weight loss.


Conflict of interest statement

The authors declare no conflict of interest.

Figures

Figure 1
Figure 1
Study design and CONSORT Diagram for DRIFT2 and this ancillary study. (A) DRIFT2 is a 12-month behavioral weight loss intervention of daily caloric restriction (DCR) versus intermittent fasting (IMF) with data collections involving anthropometry, blood and stool collections at the time increments shown. There is also a follow-up data collection six-months post-intervention. This ancillary study focuses on measures collected at baseline and three months. (B) The DRIFT2 study assessed 86 individuals and randomized 71 (34 DCR and 37 IMF) in Cohorts 1 and 2. There were nine individuals from DCR and three from IMF lost to follow-up. The gut microbiome analyses involved 25 individuals randomized to DCR and 34 to IMF.
Figure 2
Figure 2
Clinical characteristics of DRIFT2 participants. (A) From baseline to three months of the intervention, participants (n = 59) lost significant weight and waist circumference as shown in these violin plots. (B) Blood-based clinical health measures for DRIFT2 participants were assessed at baseline but not at three months. This tables shows the number of participants meeting each of the criteria for metabolic syndrome (MetS) at baseline (n = 56). (C) These violin plots show the distribution of metabolic syndrome (MetS) score (n = 56), which is the total number of components that define MetS that exceed the thresholds shown in (B), and of the components of MetS. BP: blood pressure; MetS: metabolic syndrome; HDL: high density lipoprotein.
Figure 3
Figure 3
Changes in the overall gut microbiota of DRIFT2 participants from baseline to three months. The overall gut microbiota community structure (beta-diversity) shifted significantly from baseline to three months (p < 0.001 for weighted and unweighted UniFrac metrics). (A) Average relative abundance of the most prevalent gut microbiota phyla among study participants at baseline (n = 56) and three months (n = 55). (B) Average relative abundance among study participants at baseline (n = 56) and three months (n = 55) of the most prevalent gut microbiota genera and those that changed significantly from baseline to three months. (C) Relative abundance of the most prevalent gut microbiota phyla for DCR and IMF study participants at baseline (n = 25 DCR/31 IMF) and three months (n = 22 DCR / 33 IMF). (D) Relative abundance of the most prevalent gut microbiota genera and those that changed significantly for DCR and IMF study participants at baseline (n = 25 DCR / 31 IMF) and three months (n = 22 DCR/33 IMF). (E) Gut microbiota taxa showing significant (FDR p < 0.1) overall change from baseline to three months. The y-axis shows the regression estimate from longitudinal models (using the ANCOM method, controlling for age, sex, intervention group, time and an interaction between intervention group and time, for n = 104 samples from 52 individuals) for the scaled proportion relative abundance of each taxa (with one unit corresponding to one standard deviation) on the x-axis at three months relative to baseline. (F) These plots show the change from baseline to three months for four indices of alpha-diversity: Observed OTUs, Evenness, Shannon diversity index, and Faith’s Phylogenetic Diversity. These indices reflect different aspects of diversity, such as the richness, evenness, and phylogenetic relatedness of the organisms detected in the samples. All alpha-diversity indices increased significantly over the first three months of the intervention based on linear mixed models of the 111 samples from 59 individuals, controlling for age, sex, intervention group, and time (interactions between intervention group and time were not significant and, thus, not included). OTUs: operational taxonomic units (clusters of organisms that are grouped by gene sequence similarity); PD: Phylogenetic Diversity.
Figure 4
Figure 4
Cross-sectional associations between the gut microbiota and clinical health measures. This plot shows the cross-sectional associations between clinical health measures and the overall gut microbiota composition at baseline (upper panel; n = 56) and three months (lower panel; n = 55) based on permutational ANOVA models, controlling for age and sex, as well as intervention group for analyses of data from three months. The color shows the p-value for the association, and the size of the circles represents the amount of variation explained (R2) in the overall gut microbiota composition as quantified by weighted (left) and unweighted (right) UniFrac metrics. While numerous clinical measures were collected at baseline, including all of the components of MetS, weight and waist circumference were the primary clinical measures collected at three months.
Figure 5
Figure 5
Associations between the gut microbiota and change in clinical health measures. (A) Abundance of the plotted genera were identified as the most predictive at baseline of percent change in weight and in waist circumference from baseline to three months using a random forest-based prediction method called VSURF (n = 56). Linear regression modeling (controlling for age, sex, and intervention group, and evaluating the interaction between the taxon and intervention group) was used to help interpret the results. The forest plot shows regression estimates (x-axis) for one standard deviation change in the relative abundance of the taxon in models predicting percent change in the clinical measure. Lower beta values indicate that greater abundance of the taxon correlate with greater decreases in the clinical measure and vice versa. Some of the selected taxa show different relationships with the outcomes among DCR (red) versus IMF (blue). For example, greater abundance of Subdoligranulum was associated with greater weight loss among IMF but not among DCR. Some selected predictors do not show statistically significant linear relationships with change in the clinical measure, but they may interact with each other in complex ways in relation to the outcome. “Other” genera indicate sequences that could only be classified to the family-level. (B) Change in the abundance of the shown taxa from baseline to three months were identified as the most predictive of percent change in weight and in waist circumference from baseline to three months using a random forest-based prediction method called VSURF (n = 52). Linear regression modeling (controlling for age, sex, and intervention group, and evaluating the interaction between the taxon and intervention group) was used to help interpret the results. Lachnospiraceae other showed a different relationship with percent weight loss among DCR versus IMF, with increases in abundance associated with greater weight loss only among DCR. While some selected predictors do not show statistically significant linear relationships with change in the clinical measure (shown in grey), these selected taxa may interact with each other in complex ways in relation to the outcome. “Other” genera indicate sequences that could only be classified to the family-level. MetS: Metabolic syndrome; HDL: High density lipoprotein; DCR: Daily caloric restriction; IMF: Intermittent fasting.
Figure 6
Figure 6
Changes in the gut microbiota of DRIFT2 participants from baseline to three months by intervention group. (A) This plots shows the change from baseline to three months by intervention group of four indices of alpha-diversity: Observed OTUs, Evenness, Shannon diversity index, and Faith’s Phylogenetic Diversity (PD), which reflect different aspects of alpha-diversity, such as the richness, evenness, and phylogenetic relatedness of the organisms detected in the samples. All alpha-diversity indices, except Faith’s PD, showed significant increases over time in both DCR (n = 47 samples from 25 individuals) and IMF (n = 64 samples from 34 individuals) groups based on linear mixed models by intervention group, controlling for age, sex, and time. There were not significant differences between intervention groups (DCR versus IMF) in the change in alpha-diversity over time (interaction p-values ≥ 0.48). (B) Only one gut microbiota taxon (Akkermansia) showed significant differences between intervention groups in terms of the relative abundance change from baseline to three months. The y-axis shows the regression estimate from longitudinal models (using the ANCOM method using the ANCOM method, controlling for age, sex, intervention group, time, and an interaction between intervention group and time, for n = 104 samples from 52 individuals; 22 DCR and 30 IMF) for the change in proportion relative abundance relative to DCR at baseline. The * indicates significant change over time within the intervention group.

References

    1. Virani Salim S., Alvaro A., Benjamin Emelia J., Bittencourt Marcio S., Callaway Clifton W., Carson April P., Chamberlain Alanna M., Chang Alexander R., Cheng S., Delling Francesca N., et al. Heart Disease and Stroke Statistics—2020 Update: A Report From the American Heart Association. Circulation. 2020;141:e139–e596. doi: 10.1161/CIR.0000000000000757. - DOI - PubMed
    1. Mattson M.P., Wan R. Beneficial Effects of Intermittent Fasting and Caloric Restriction on the Cardiovascular and Cerebrovascular Systems. J. Nutr. Biochem. 2005;16:129–137. doi: 10.1016/j.jnutbio.2004.12.007. - DOI - PubMed
    1. Jensen M.D., Ryan D.H., Apovian C.M., Ard J.D., Comuzzie A.G., Donato K.A., Hu F.B., Hubbard V.S., Jakicic J.M., Kushner R.F., et al. 2013 AHA/ACC/TOS Guideline for the Management of Overweight and Obesity in Adults: A Report of the American College of Cardiology/American Heart Association Task Force on Practice Guidelines and The Obesity Society. J. Am. Coll. Cardiol. 2014;63:2985–3023. doi: 10.1016/j.jacc.2013.11.004. - DOI - PubMed
    1. Marek R.J., Coulon S.M., Brown J.D., Lydecker J.A., Marek S., Malcolm R., O’Neil P.M. Characteristics of Weight Loss Trajectories in a Comprehensive Lifestyle Intervention. Obesity. 2017;25:2062–2067. doi: 10.1002/oby.21942. - DOI - PubMed
    1. Greaves C., Poltawski L., Garside R., Briscoe S. Understanding the Challenge of Weight Loss Maintenance: A Systematic Review and Synthesis of Qualitative Research on Weight Loss Maintenance. Health Psychol. Rev. 2017;11:145–163. doi: 10.1080/17437199.2017.1299583. - DOI - PubMed

Publication types