. 2021 Sep 9;10(9):1870.
doi: 10.3390/plants10091870.

The Arabinogalactan Protein Family of Centaurium erythraea Rafn

Affiliations

The Arabinogalactan Protein Family of Centaurium erythraea Rafn

Danijela M Paunović et al. Plants (Basel). .

Abstract

Centaurium erythraea (centaury) is a medicinal plant with exceptional developmental plasticity in vitro and vigorous, often spontaneous, regeneration via shoot organogenesis and somatic embryogenesis, during which arabinogalactan proteins (AGPs) play an important role. AGPs are highly glycosylated proteins belonging to the super family of O-glycosylated plant cell surface hydroxyproline-rich glycoproteins (HRGPs). HRGPs/AGPs are intrinsically disordered and not well conserved, making their homology-based mining ineffective. We have applied a recently developed pipeline for HRGP/AGP mining, ragp, which is based on machine learning prediction of proline hydroxylation, to identify HRGP sequences in centaury transcriptome and to classify them into motif and amino acid bias (MAAB) classes. AGP sequences with low AG glycomotif representation were also identified. Six members of each of the three AGP subclasses, fasciclin-like AGPs, receptor kinase-like AGPs and AG peptides, were selected for phylogenetic and expression analyses. The expression of these 18 genes was recorded over 48 h following leaf mechanical wounding, as well as in 16 tissue samples representing plants from nature, plants cultivated in vitro, and developmental stages during shoot organogenesis and somatic embryogenesis. None of the selected genes were upregulated during both wounding recovery and regeneration. Possible functions of AGPs with the most interesting expression profiles are discussed.

Keywords: FLAs; MAAB classes; arabinogalactan proteins; gene expression; hydroxyproline-rich glycoproteins; mechanical wounding; organogenesis; protein kinases; ragp; somatic embryogenesis.


Conflict of interest statement

The authors declare no conflict of interest.

Figures

Figure 1
Figure 1
The number of C. erythraea Trinity transcripts and predicted protein sequences passing through different filters of the ragp pipeline.
Figure 2
Figure 2
Distribution of identified HRGP sequences in C. erythraea transcriptome. (A) Distribution of HRGP MAAB classes. (B) Distribution of Pfam domains in sequences identified as one of the MAAB classes. (C) Distribution of Pfam domains (top 15 by frequency) in sequences containing clusters of AG motifs, using a relaxed scan (three AG motifs no more than 10 amino acids apart) and a strict scan (four AG motifs no more than four amino acids apart). Unique domains per sequence were counted. Only AG motifs with prolines likely to be hydroxylated were considered. AG motifs linked to three or more continuous prolines/hydroxyprolines were omitted from the scan (example AOOO). Domains were predicted with hmmscan 3.3.2 and using Pfam-A33 database using a cutoff of 0.01 for independent e-value.
Figure 3
Figure 3
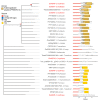
Phylogenetic relationship of six C. erythraea FLA protein sequences with homologues from other plant species. The phylogenetic tree represents an unrooted maximum likelihood tree constructed using the WAG amino acid model. Cluster stability was evaluated using 100 replicates of nonparametric bootstrap. Clusters with ≥80/100 bootstrap support are indicated with a red number. Clusters with ≤50/100 bootstrap support were collapsed into multichotomies. Protein schematic diagrams were constructed using ragp R package: N-sp as predicted by Signalp4.1 are represented with red segments on the N-terminus; GPI addition sites (omega sites) as predicted using NetGPI1.1 are represented with blue diamonds; domains as predicted with hmmscan 3.3.2 and using Pfam-A33 database are represented according to the color legend; transmembrane domains (TM) as predicted using Phobius1.01 are represented using yellow rectangles. Proteins with predicted TM extracellular regions are indicated with dashed lines above the sequence diagrams; hydroxyprolines, as predicted with ragp 0.32 are indicated with bar-code-like vertical black lines, while AG motif spans (at least three AG motifs, no more than 10 amino acids apart) are indicated with light grey rectangles. Clades are labeled according to [35].
Figure 4
Figure 4
Phylogenetic relationship of six C. erythraea KLA protein sequences with homologues from other plant species. The phylogenetic tree represents an unrooted maximum likelihood tree constructed using the JTT amino acid model. Cluster stability was evaluated using 100 replicates of nonparametric bootstrap. Clusters with ≥80/100 bootstrap support are indicated with a red number. Clusters with ≤50/100 bootstrap support were collapsed into multichotomies. Intermediate (50–80) bootstrap support is indicated on major clusters. Protein schematic diagrams were constructed using ragp R package: N-sp as predicted by Signalp4.1 are represented with red segments on the N-terminus; domains as predicted with hmmscan 3.3.2 and using Pfam-A33 database are represented according to the color legend; transmembrane domains (TM) as predicted using Phobius1.01 are represented using yellow rectangles. Proteins with predicted TM extracellular regions are indicated with dashed lines above the protein diagram, while the intracellular regions are indicated with dashed lines below the protein diagrams; hydroxyprolines as predicted with ragp 0.32 are indicated with bar-code-like vertical black lines, while AG motif spans (at least three AG motifs, no more than 10 amino acids apart) are indicated with light grey rectangles.
Figure 5
Figure 5
Phylogenetic relationship of six C. erythraea AGp protein sequences with homologues from other plant species. The phylogenetic tree represents an unrooted neighbor joining tree constructed based on an alignment-free distance matrix (3-mer count as implemented in kmer R package). Cluster stability was evaluated using 100 replicates of nonparametric bootstrap. Clusters with ≥80/100 bootstrap support are indicated with a red number. Clusters with ≤50/100 bootstrap support were collapsed into multichotomies. Protein schematic diagram was constructed using ragp R package: N-sp as predicted by Signalp4.1 are represented with red segments on the N-terminus; GPI addition sites (omega sites) as predicted using NetGPI1.1 are represented with blue diamonds; domains as predicted with hmmscan 3.3.2 and using Pfam-A33 database are represented according to the color legend; trans-membrane domains (TM) as predicted using Phobius1.01 are represented using yellow rectangles; proteins with predicted TM extracellular regions are indicated with dashed lines above the sequence diagrams, while intracellular regions are indicated with dashed lines below the sequence diagrams; hydroxyprolines as predicted with ragp 0.32 are indicated with bar-code-like vertical black lines, while AG motif spans (at least three AG motifs, no more than 10 amino acids apart) are indicated with light grey rectangles.
Figure 6
Figure 6
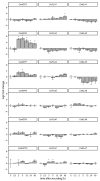
Temporal gene expression profiles for the 18 studied AGp, FLA and KLA genes obtained after cutting of leaf explants. Mean and standard deviation is shown for three biological replicates. Immediately frozen tissue after wounding (0 min) was used as control sample. Asterisks indicate significant difference obtained via Student’s t-test between a specific time point and the appropriate control sample. Multiple comparison correction was performed jointly for all performed comparisons using the Benjamini and Holcberg method.
Figure 7
Figure 7
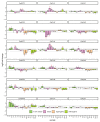
Expression profiles for the 18 studied AGp, FLA and KLA genes in 16 different developmental stages, tissues and plant organs. Sample abbreviations are provided in Table 1. Mean and standard deviation is shown for three biological replicates. The samples correspond to the experimental system explained in more depth in [34]. The horizontal dashed lines represent a log2 fold change of 2 and −2 compared to the rosette leaves (rl) grown in vitro. Statistical comparison of the means was performed between each sample and the rosette leaves (rl) grown in vitro (control sample) using Welch’s t-test. Multiple comparison correction was performed jointly for all performed comparisons using the Benjamini and Holcberg method. One asterisk (*) indicates that the mean expression in the sample is significantly different compared to the mean control expression (adjusted p-value < 0.05), while two (**) correspond to highly significant difference in expression (p-values < 0.01). Red asterisks indicate that the comparison of the means is significant and that the difference in the means is higher than 2 log2 fold.
Figure 8
Figure 8
Pearson correlation heatmap of relative gene expression. Pairwise correlation coefficients are given in the lower diagonal triangle, while statistical significance of the pairwise association is shown in the upper triangle: * for p-value < 0.05, ** for p-value < 0.01 and *** for p-value < 0.001. Rows and columns of the heatmap are arranged according to hierarchical cluster analyses performed on a matrix of correlation distances (1–corPear). Cluster agglomeration was performed using complete linkage and the dendrograms are shown on top and left of the heatmap. Emphasized cells (enclosed with rectangles) correspond to the top 5% pairs based on Jackknife bias corrected mutual information.

References

    1. Deepak S., Shailasree S., Kini R.K., Muck A., Mithöfer A., Shetty S.H. Hydroxyproline-rich Glycoproteins and Plant Defence. J. Phytopathol. 2010;158:585–593. doi: 10.1111/j.1439-0434.2010.01669.x. - DOI
    1. Hijazi M., Velasquez S.M., Jamet E., Estevez J.M., Albenne C. An update on post-translational modifications of hydroxyproline-rich glycoproteins: Toward a model highlighting their contribution to plant cell wall architecture. Front. Plant Sci. 2014;5:395. doi: 10.3389/fpls.2014.00395. - DOI - PMC - PubMed
    1. Kieliszewski M.J., Lamport D.T.A., Tan L., Cannon M.C. Hydroxyproline-Rich Glycoproteins: Form and Function. Annu. Plant Rev. 2010;41:321–342. doi: 10.1002/9781444391015.ch13. - DOI
    1. Johnson K.L., Cassin A.M., Lonsdale A., Bacic A., Doblin M.S., Schultz C.J. A motif and amino acid bias bioinformatics pipeline to identify hydroxyproline-rich glycoproteins. Plant Physiol. 2017;174:886–903. doi: 10.1104/pp.17.00294. - DOI - PMC - PubMed
    1. Ellis M., Egelund J., Schultz C.J., Bacic A. Arabinogalactan-Proteins: Key Regulators at the Cell Surface? Plant Physiol. 2010;153:403–419. doi: 10.1104/pp.110.156000. - DOI - PMC - PubMed

LinkOut - more resources