. 2021 Dec 1;81(23):5935-5947.
doi: 10.1158/0008-5472.CAN-21-0752. Epub 2021 Sep 27.

Elimination of Radiation-Induced Senescence in the Brain Tumor Microenvironment Attenuates Glioblastoma Recurrence

Affiliations

Elimination of Radiation-Induced Senescence in the Brain Tumor Microenvironment Attenuates Glioblastoma Recurrence

Eliot Fletcher-Sananikone et al. Cancer Res. .

Abstract

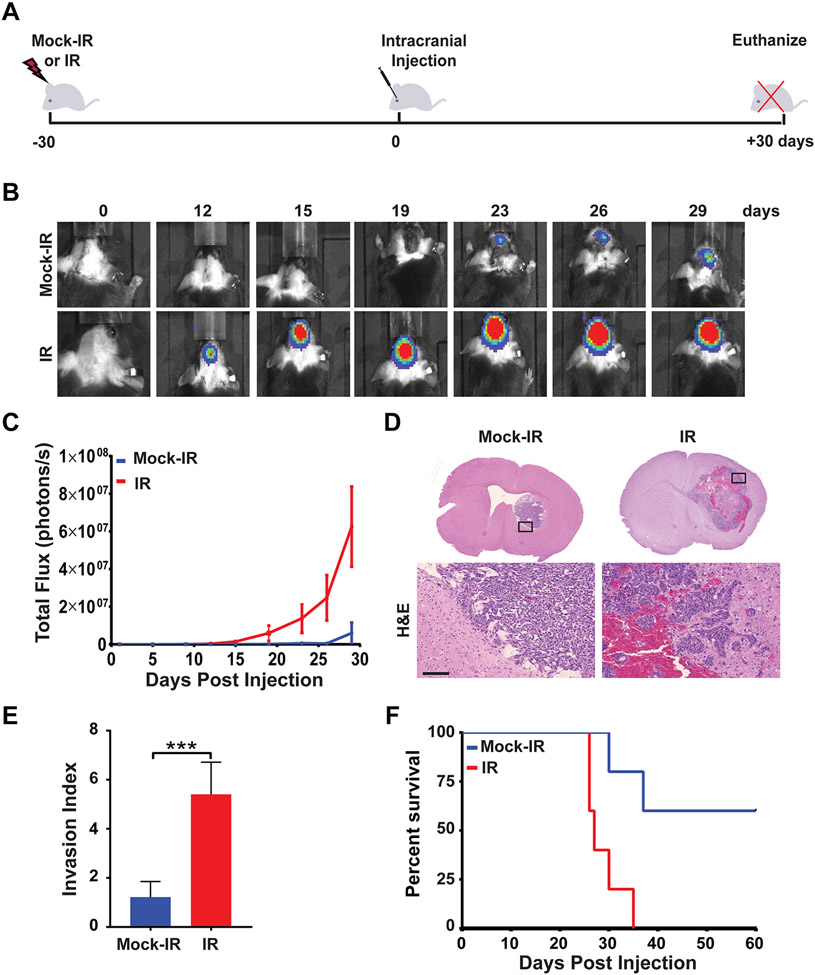
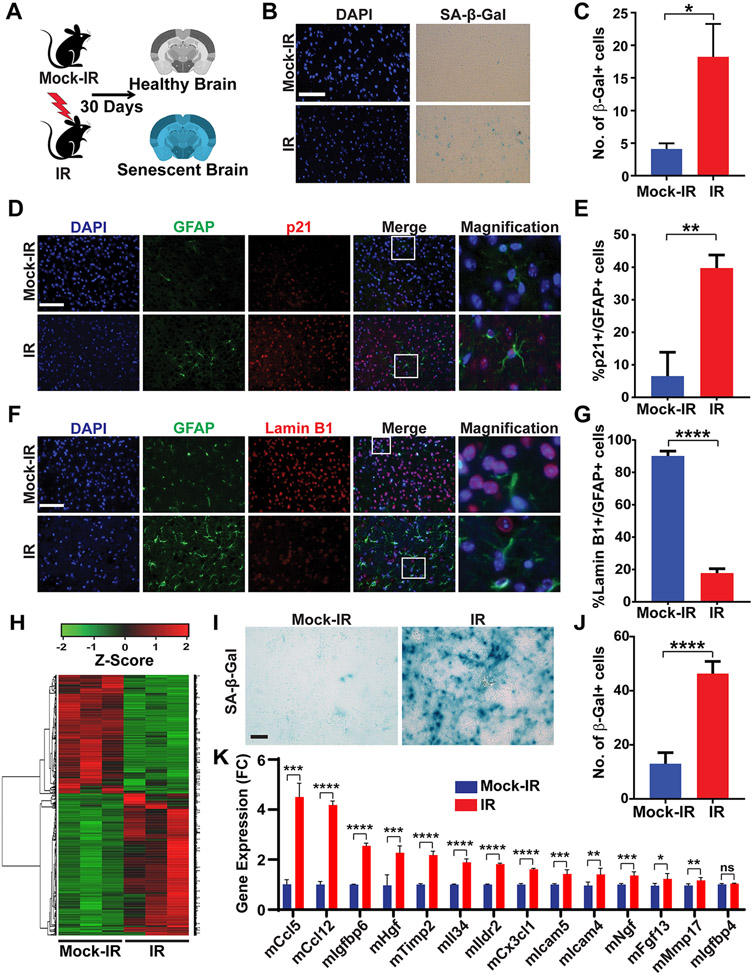
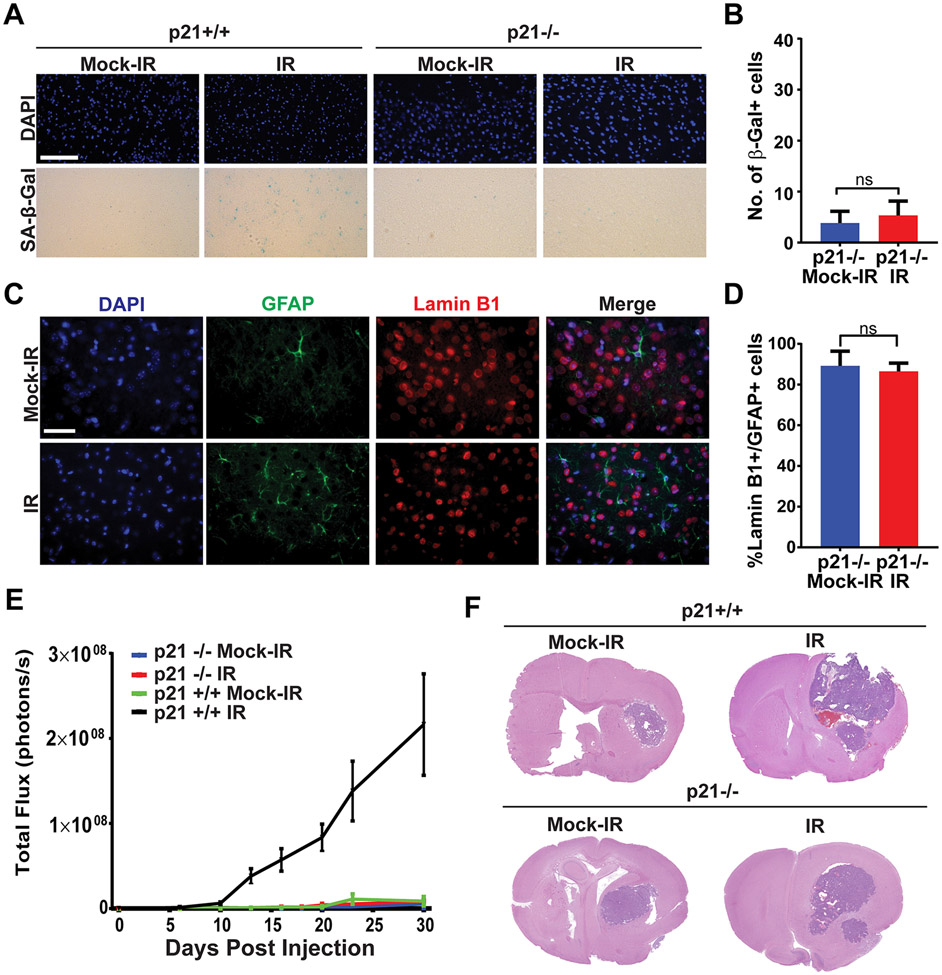
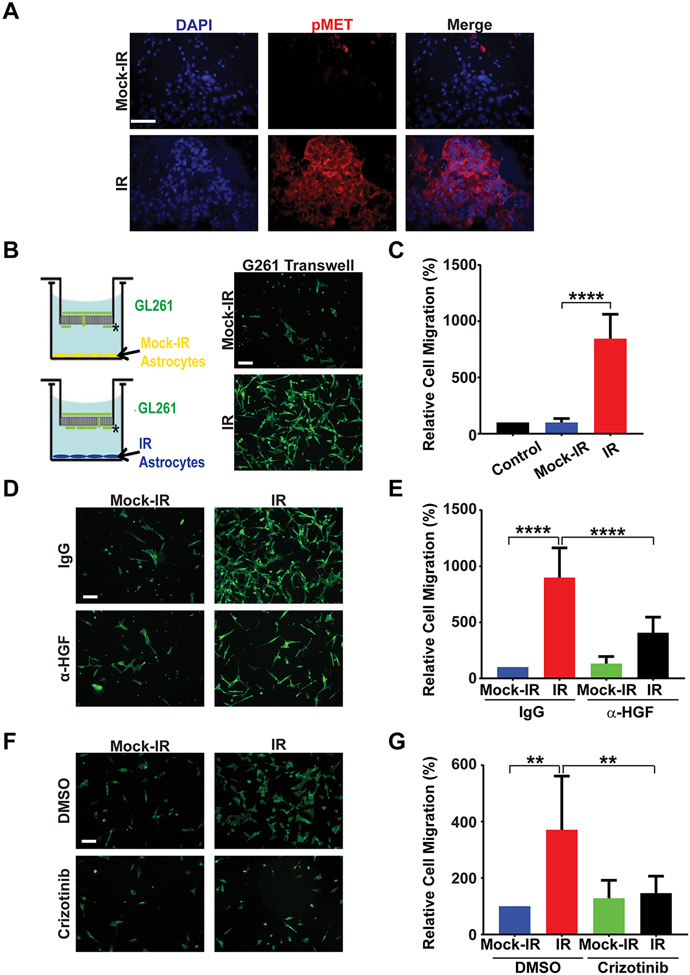
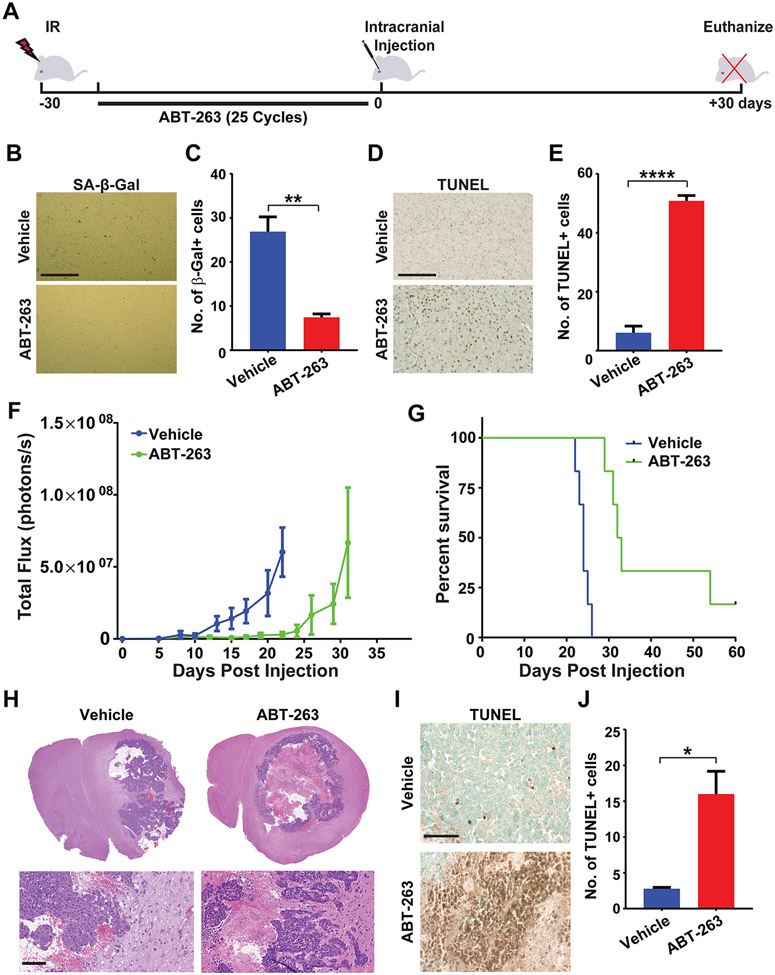
Glioblastomas (GBM) are routinely treated with ionizing radiation (IR) but inevitably recur and develop therapy resistance. During treatment, the tissue surrounding tumors is also irradiated. IR potently induces senescence, and senescent stromal cells can promote the growth of neighboring tumor cells by secreting factors that create a senescence-associated secretory phenotype (SASP). Here, we carried out transcriptomic and tumorigenicity analyses in irradiated mouse brains to elucidate how radiotherapy-induced senescence of non-neoplastic brain cells promotes tumor growth. Following cranial irradiation, widespread senescence in the brain occurred, with the astrocytic population being particularly susceptible. Irradiated brains showed an altered transcriptomic profile characterized by upregulation of CDKN1A (p21), a key enforcer of senescence, and several SASP factors, including HGF, the ligand of the receptor tyrosine kinase (RTK) Met. Preirradiation of mouse brains increased Met-driven growth and invasiveness of orthotopically implanted glioma cells. Importantly, irradiated p21-/- mouse brains did not exhibit senescence and consequently failed to promote tumor growth. Senescent astrocytes secreted HGF to activate Met in glioma cells and to promote their migration and invasion in vitro, which could be blocked by HGF-neutralizing antibodies or the Met inhibitor crizotinib. Crizotinib also slowed the growth of glioma cells implanted in preirradiated brains. Treatment with the senolytic drug ABT-263 (navitoclax) selectively killed senescent astrocytes in vivo, significantly attenuating growth of glioma cells implanted in preirradiated brains. These results indicate that SASP factors in the irradiated tumor microenvironment drive GBM growth via RTK activation, underscoring the potential utility of adjuvant senolytic therapy for preventing GBM recurrence after radiotherapy. SIGNIFICANCE: This study uncovers mechanisms by which radiotherapy can promote GBM recurrence by inducing senescence in non-neoplastic brain cells, suggesting that senolytic therapy can blunt recurrent GBM growth and aggressiveness.


Conflict of interest statement

Conflict of interest: R.H. is a board member and has equity in Dialectic Therapeutics

Figures

Figure 1.
Figure 1.. Irradiation of the brain promotes GBM growth and aggressiveness.
A, Schematic of experimental design. B, C57BL/6J mice were mock irradiated (Mock-IR) or cranially irradiated (IR) with 10 Gy of X-rays (6 mice per cohort). After 30 days, mice were intra-cranially implanted with 2,500 GL261 cells expressing firefly luciferase. Tumor growth was monitored by BLI imaging over a 30-day period. BLI images show tumor progression in a representative mouse for each cohort. C, Plot represents average signal intensity (photons per second) for each cohort versus time post-injection. Note marked increase in the rate of tumor growth (red line) in pre-irradiated mouse brains (P=0.0278, error bars S.E.M). D, H&E-stained sections of mock-irradiated or irradiated mouse brains bearing GL261 tumors. High magnifications show representative areas spanning the tumor borders. Note marked increase in tumor size and infiltration in the pre-irradiated mouse brain. Scale bar=100 μm. E, Plot depicts average Invasion Index for mock-irradiated or irradiated cohorts (P= 0.0002, error bars S.D). F, Kaplan-Meier curves show survival of mock-irradiated or pre-irradiated mice implanted with GL261 cells and then monitored over a 60-day period (n=6 per cohort, P=0.0086).
Figure 2.
Figure 2.. Ionizing radiation triggers senescence and the SASP in the brain.
A, Schematic of experimental design. B, Mice were mock-irradiated or irradiated with 10 Gy of X-rays and then allowed to recover for 30 days (3 mice per cohort). Senescence was measured at 30 days post-irradiation by staining brain sections for SA-β-Gal activity. Representative Images of SA-β-Gal and DAPI (blue) staining of the cortex of brains of mock-irradiated and irradiated mice are shown. Scale bar=100 μm. C, Plot shows numbers of SA-β-Gal cells per 40X microscopic field in brains of mock-irradiated and irradiated mice (n=3 for each cohort, P=0.0372, error bars S.D). D, Images show immunofluorescence staining of the cortex of mock-irradiated and irradiated brains for GFAP (green), p21 (red) and DAPI (blue). Scale bar=50 μm. E, Plot shows the percentage of GFAP-positive cells that stain positive for p21 in mock-irradiated and irradiated brains (n=3 per cohort, P=0.0058, error bars S.D). F, Images show immunofluorescence staining of the cortex of mock-irradiated and irradiated brains for GFAP (green), Lamin B1 (red) and DAPI (blue). Scale bar=50 μm. G, Plot shows the percentage of GFAP-positive cells that stain positive for Lamin B1 in mock-irradiated and irradiated brains (n=3 per cohort, P <0.0001, error bars S.D). Note that irradiated brains exhibit positivity for multiple markers of senescence. H, Heatmap of differentially expressed genes in brain tissues from mice that were mock-irradiated or irradiated with 10 Gy of X-rays and then allowed to recover for 30 days (3 mice per cohort). I, Representative image of SA-β-Gal staining of primary mouse astrocytes mock-irradiated or irradiated with 10 Gy of X-rays and then allowed to recover for 10 days. Scale bar=100 μm. J, Plot shows number of SA-β-Gal-positive cells per 40X microscopic field (n=3, P<0.0001, error bars S.D). K, Plot shows relative expression of SASP-related genes in mock-irradiated versus irradiated astrocytes as quantified by qRT-PCR. (n=3; *, P ≤ 0.05; **, P ≤ 0.01; ***, P ≤ 0.001 ****, P ≤ 0.0001; error bars S.D).
Figure 3.
Figure 3.. Senescence induction and tumor promotion by ionizing radiation are p21-dependent.
A, p21+/+ or p21−/− mice were mock-irradiated or irradiated with 10 Gy of X-rays and then allowed to recover for 30 days (6 mice per cohort). Senescence was measured at 30 days post-IR by staining brain sections for SA-β-Gal activity. Representative Images of SA-β-Gal and DAPI (blue) staining of the cortex of brains of mock-irradiated and irradiated mice are shown. Scale bar=100 μm. B, Plot shows numbers of SA-β-Gal cells per 40X microscopic field in brains of mock-irradiated and irradiated mice (n=6 for each cohort, P=0.3371, error bars S.D). C, Images show immunofluorescence staining of the cortex of mock-irradiated and irradiated p21−/− brains for GFAP (green), Lamin B1 (red) and DAPI (blue). Scale bar=50 μm. D, Plot shows the percentage of GFAP-positive cells that stain positive for Lamin B1 in mock-irradiated and irradiated brains (n=3 per cohort, P= 0.6117, error bars S.D). Note that irradiated p21−/− brains do not stain for senescence markers. E, p21+/+ or p21−/− mice were mock irradiated or cranially irradiated with 10 Gy of X-rays (6 mice per cohort). After 30 days, mice were intra-cranially implanted with 2,500 GL261 cells expressing firefly luciferase. Tumor growth was monitored by BLI imaging. Plot represents average signal intensity (photons per second) for each cohort versus time post-injection. Note promotion of tumor growth in irradiated p21+/+ mice but not in p21−/− mice (p21−/− IR vs p21+/+ IR P= 0.0082, p21−/− Mock vs p21−/− IR P=0.6448, error bars S.E.M). F, H&E-stained sections of mock-irradiated or irradiated p21+/+ and p21−/− mouse brains bearing GL261 tumors.
Figure 4.
Figure 4.. Senescent astrocytes promote migration of GBM cells in vitro.
A, GL261 tumors growing in mock-irradiated or pre-irradiated (10 Gy, 30 days) brains were sectioned and stained for phospho-Met (Y1234/1235; red) and DAPI (blue). Representative images are shown (n=3 per cohort). Note robust Met activation in tumor growing in pre-irradiated brain. Scale bar=50 μm. B, Schematic of Boyden Chamber Assay with GL261 cells in the top chamber and mock-irradiated or irradiated (10 Gy, 10 days) primary mouse astrocytes in the bottom chamber. Representative images of GL261 cells on the bottom surface of the trans-well membrane (indicated by *) stained with Alexa Fluor 488 Phalloidin (green). Scale bar=100 μm. C, Plot shows percentage of cells per 40X microscopic field migrating towards the bottom chamber relative to migration towards media alone (n=3, P<0.0001, error bars S.D). Control represents assay with only cell culture media in the bottom chamber (no astrocytes). D, Representative fluorescence images of GL261 cells treated with either IgG or α-HGF antibody in a Boyden Chamber migration assay with mock-irradiated or irradiated primary astrocytes in the bottom chamber. Scale bar=100 μM. E, Plot shows percentage of cells per 40X microscopic field migrating towards the bottom chamber relative to migration towards IgG-treated mock-irradiated astrocytes (n=3, IR/IgG vs IR/αHGF P<0.0001, error bars S.D). F, Representative fluorescence images of GL261 cells treated with either DMSO or Crizotnib in a Boyden Chamber migration assay with mock-irradiated or irradiated primary astrocytes in the bottom chamber. Scale bar=100 μm. G, Plot shows percentage of cells per 40X microscopic field migrating towards the bottom chamber relative to migration towards DMSO-treated mock-irradiated astrocytes (n=3, IR/DMSO vs IR/Crizotinib P=0.0047, error bars S.D).
Figure 5.
Figure 5.. ABT-263 eliminates senescent cells in vivo and attenuates GBM growth.
A, Schematic of experimental design. B, C57BL/6J mice were cranially irradiated with 10 Gy of X-rays (3 mice per cohort). After 5 days, mice were treated with either vehicle or ABT-263 (50 mg/kg) daily for 25 days. Senescence was measured at 30 days post-IR by staining brain sections for SA-β-Gal activity. Representative Images of SA-β-Gal staining of the cortex of brains of cranially irradiated mice treated with vehicle or ABT-263 are shown. Scale bar=100 μm. C, Plot shows numbers of SA-β-Gal cells per 40X microscopic field in brains of vehicle or ABT-263 treated mice (n=3 for each cohort, P= 0.0072, error bars S.D). D, Representative Images of TUNEL staining of the cortex of brains of cranially irradiated mice treated with vehicle or ABT-263 are shown. Scale bar=100 μm. E, Plot shows number of TUNEL-positive cells per 40X microscopic field in brains of vehicle- or ABT-263-treated mice (n=3 for each cohort, P<0.0001, error bars S.D). F, C57BL/6J mice were mock irradiated or cranially irradiated with 10 Gy of X-rays (6 mice per cohort). After 5 days, mice were treated with either vehicle or ABT-263 (50 mg/kg) daily for 25 days. At 30 days post-IR, mice were intra-cranially implanted with 2,500 GL261 cells expressing firefly luciferase. Tumor growth was monitored by BLI imaging over a 30-day period. Plot represents average signal intensity (photons per second) for each cohort versus time post-injection. (P=0.0074, error bars S.E.M). Note marked delay in tumor growth (green line) in mouse brains pre-treated with ABT-263. G, Kaplan-Meier curves show survival of pre-irradiated mice, treated with vehicle or ABT-263, implanted with GL261 cells and then monitored over a 60-day period. (n=6 per cohort, P=0.0005). H, H&E-stained sections of GL261 tumors in pre-irradiated mouse brains treated with vehicle or ABT-263 prior to tumor cell implantation. Note: tumors in ABT-263-treated mice are highly necrotic with undefined borders. Scale bar =100 μM. I, Representative TUNEL images of GL261 tumors in vehicle or ABT-263 treated irradiated mouse brains. Scale bar=100 μm. J, Plot shows number of TUNEL-positive cells per 40X microscopic field in GL261 tumors in vehicle or ABT-263 treated mice (n=3 for each cohort, P=0.0184, error bars S.D).

References

    1. Osuka S, Van Meir EG. Overcoming therapeutic resistance in glioblastoma: the way forward. The Journal of clinical investigation 2017;127:415–26 - PMC - PubMed
    1. Stupp R, Mason WP, van den Bent MJ, Weller M, Fisher B, Taphoorn MJ, et al. Radiotherapy plus concomitant and adjuvant temozolomide for glioblastoma. The New England journal of medicine 2005;352:987–96 - PubMed
    1. Barbagallo GM, Jenkinson MD, Brodbelt AR. 'Recurrent' glioblastoma multiforme, when should we reoperate? Br J Neurosurg 2008;22:452–5 - PubMed
    1. Scoccianti S, Perna M, Olmetto E, Delli Paoli C, Terziani F, Ciccone LP, et al. Local treatment for relapsing glioblastoma: A decision-making tree for choosing between reirradiation and second surgery. Crit Rev Oncol Hematol 2021;157:103184. - PubMed
    1. Wernicke AG, Smith AW, Taube S, Mehta MP. Glioblastoma: Radiation treatment margins, how small is large enough? Pract Radiat Oncol 2016;6:298–305 - PubMed

Publication types

MeSH terms