. 2022 Feb 15;28(4):662-676.
doi: 10.1158/1078-0432.CCR-21-2105.

Losartan Blocks Osteosarcoma-Elicited Monocyte Recruitment, and Combined With the Kinase Inhibitor Toceranib, Exerts Significant Clinical Benefit in Canine Metastatic Osteosarcoma

Affiliations

Losartan Blocks Osteosarcoma-Elicited Monocyte Recruitment, and Combined With the Kinase Inhibitor Toceranib, Exerts Significant Clinical Benefit in Canine Metastatic Osteosarcoma

Daniel P Regan et al. Clin Cancer Res. .

Abstract

Purpose: There is increasing recognition that progress in immuno-oncology could be accelerated by evaluating immune-based therapies in dogs with spontaneous cancers. Osteosarcoma (OS) is one tumor for which limited clinical benefit has been observed with the use of immune checkpoint inhibitors. We previously reported the angiotensin receptor blocker losartan suppressed metastasis in preclinical mouse models through blockade of CCL2-CCR2 monocyte recruitment. Here we leverage dogs with spontaneous OS to determine losartan's safety and pharmacokinetics associated with monocyte pharmacodynamic endpoints, and assess its antitumor activity, in combination with the kinase inhibitor toceranib.

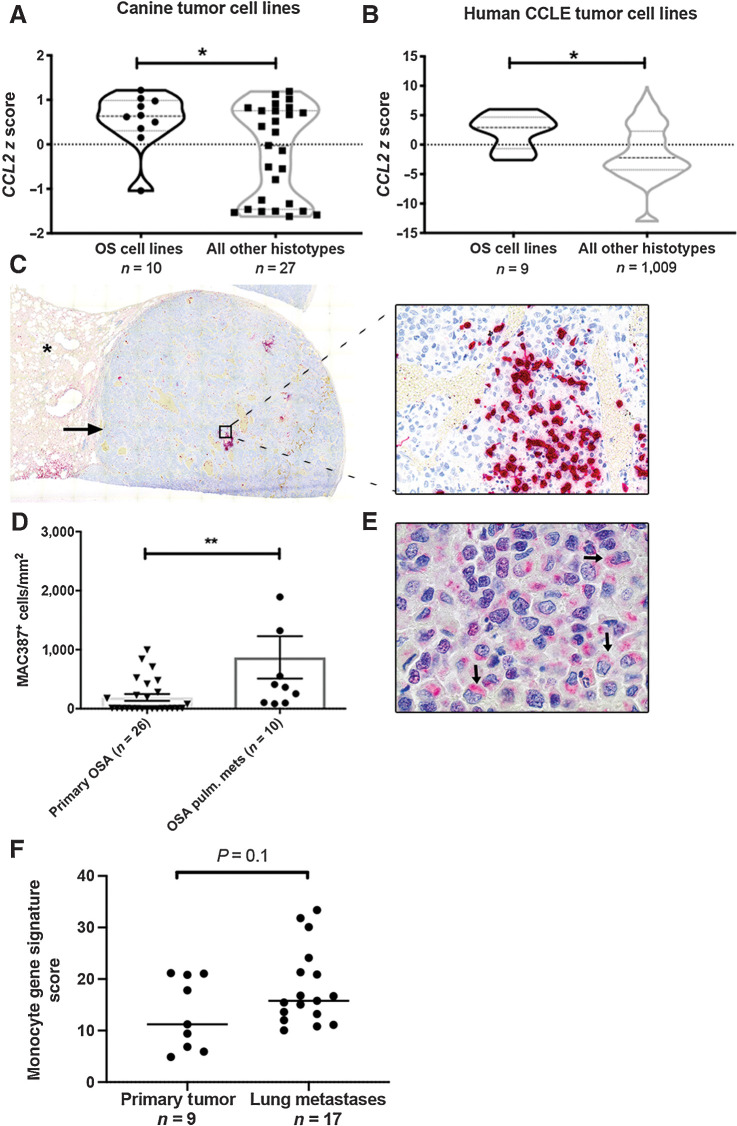
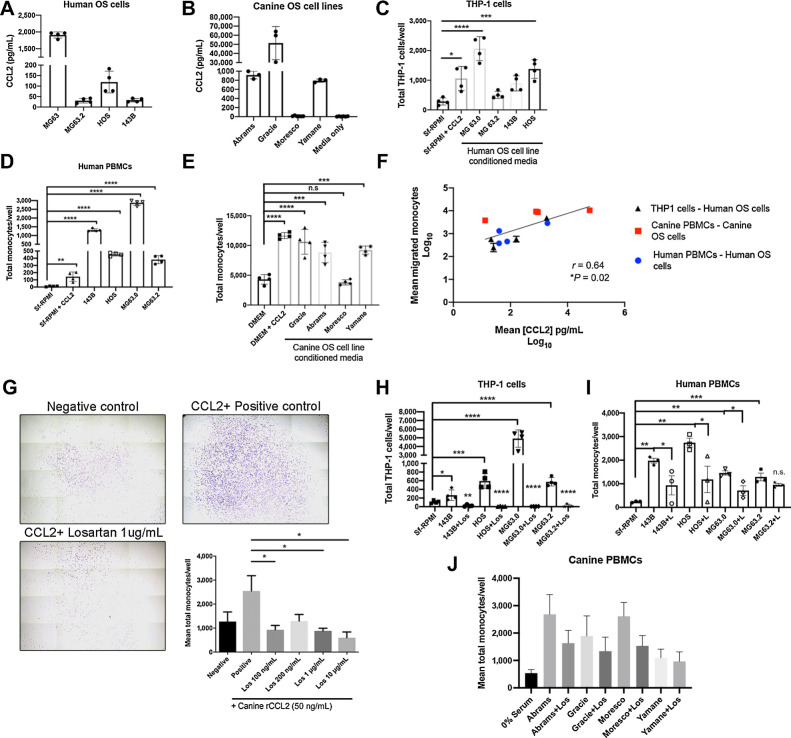
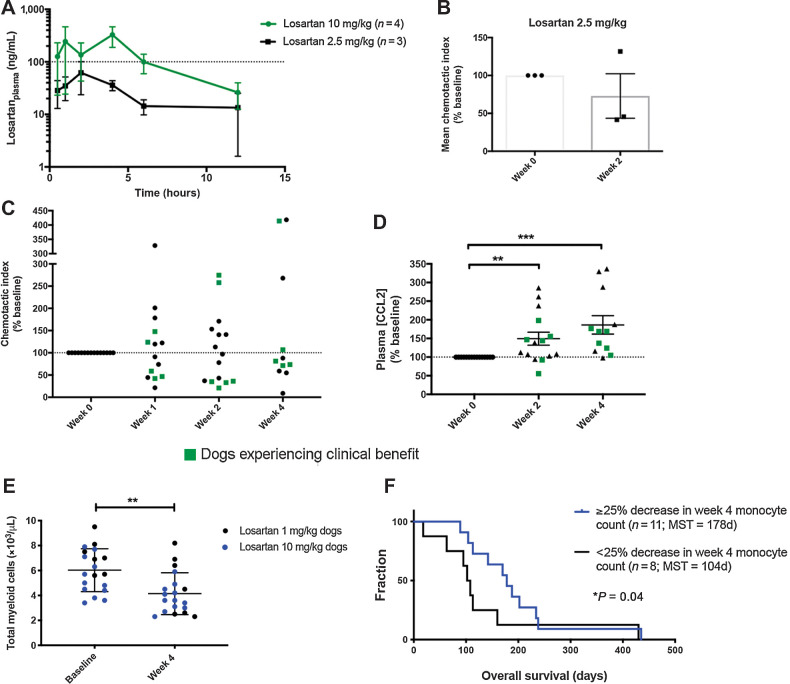
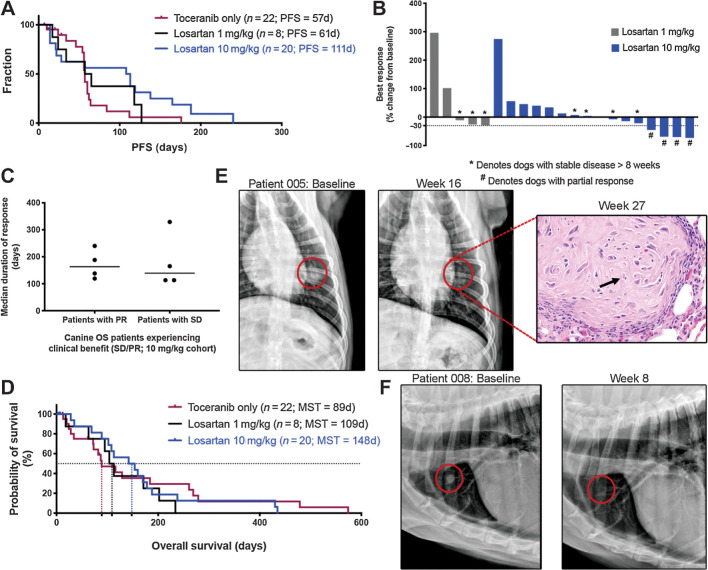
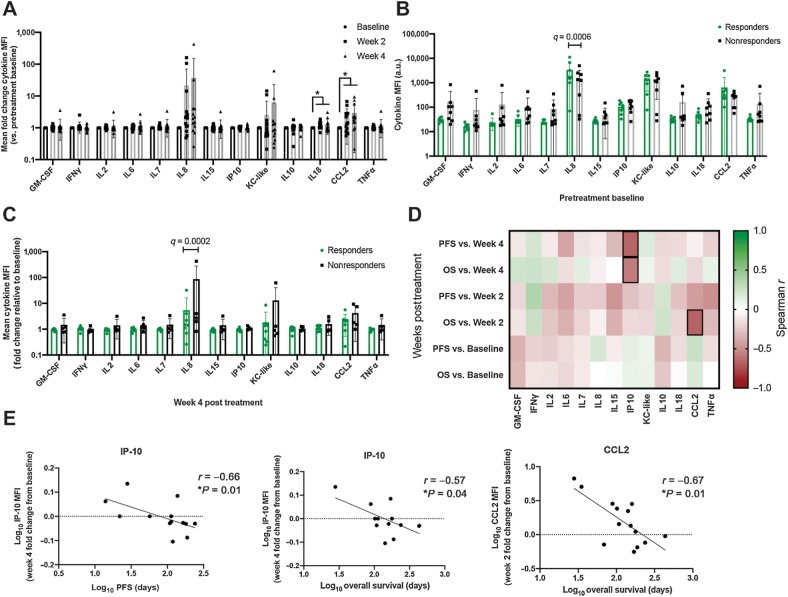
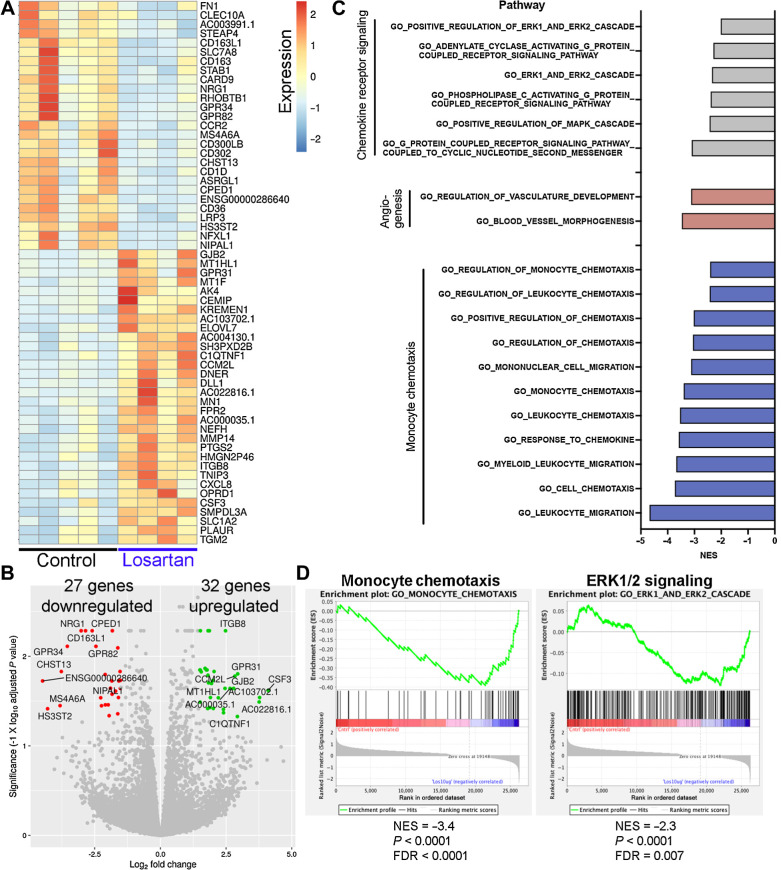
Patients and methods: CCL2 expression, monocyte infiltration, and monocyte recruitment by human and canine OS tumors and cell lines were assessed by gene expression, ELISA, and transwell migration assays. Safety and efficacy of losartan-toceranib therapy were evaluated in 28 dogs with lung metastatic OS. Losartan PK and monocyte PD responses were assessed in three dose cohorts of dogs by chemotaxis, plasma CCL2, and multiplex cytokine assays, and RNA-seq of losartan-treated human peripheral blood mononuclear cells.

Results: Human and canine OS cells secrete CCL2 and elicit monocyte migration, which is inhibited by losartan. Losartan PK/PD studies in dogs revealed that a 10-fold-higher dose than typical antihypertensive dosing was required for blockade of monocyte migration. Treatment with high-dose losartan and toceranib was well-tolerated and induced a clinical benefit rate of 50% in dogs with lung metastases.

Conclusions: Losartan inhibits the CCL2-CCR2 axis, and in combination with toceranib, exerts significant biological activity in dogs with metastatic osteosarcoma, supporting evaluation of this drug combination in patients with pediatric osteosarcoma. See related commentary by Weiss et al., p. 571.


Figures

Figure 1. Canine and human OS cells express CCL2 and are enriched for monocytes within pulmonary metastases. A, CCL2 mRNA expression in canine OS cells, as compared with all cell lines of non-OS histotype. *P = 0.04, unpaired two-tailed Student t test. B, CCL2 mRNA expression in human OS cells as compared with all cell lines of non-OS histotype within the Broad Institute Cancer Cell Line Encyclopedia (CCLE). *P = 0.01, unpaired two-tailed Student t test. C, Subgross overview and corresponding 400× magnification image of a canine OS pulmonary metastasis containing extensive intratumoral infiltrates of MAC387+ monocytes and macrophages (cells labeled in red; asterisk denotes normal lung parenchyma). D, Quantitative image analysis of MAC387+ myeloid cells in OS pulmonary metastases as compared with primary tumors (n = 10 and 26 animals per group, respectively). **P = 0.004, two-tailed Mann–Whitney test, data plotted as mean ± SEM. E, 1,000× magnification image of the same metastatic lesion shown in (C) demonstrating strong cytoplasmic, perinuclear positive immunolabeling of canine OS tumor cells for CCL2 (arrows). F, Mean expression of monocyte immune signature genes in human OS pulmonary metastases versus primary tumors using RNA-seq data obtained from Wu and colleagues. P = 0.1, unpaired two-tailed Student t test.
Figure 1.
Canine and human OS cells express CCL2 and are enriched for monocytes within pulmonary metastases. A, CCL2 mRNA expression in canine OS cells, as compared with all cell lines of non-OS histotype. *P = 0.04, unpaired two-tailed Student t test. B, CCL2 mRNA expression in human OS cells as compared with all cell lines of non-OS histotype within the Broad Institute Cancer Cell Line Encyclopedia (CCLE). *P = 0.01, unpaired two-tailed Student t test. C, Subgross overview and corresponding 400× magnification image of a canine OS pulmonary metastasis containing extensive intratumoral infiltrates of MAC387+ monocytes and macrophages (cells labeled in red; asterisk denotes normal lung parenchyma). D, Quantitative image analysis of MAC387+ myeloid cells in OS pulmonary metastases as compared with primary tumors (n = 10 and 26 animals per group, respectively). **P = 0.004, two-tailed Mann–Whitney test, data plotted as mean ± SEM. E, 1,000× magnification image of the same metastatic lesion shown in (C) demonstrating strong cytoplasmic, perinuclear positive immunolabeling of canine OS tumor cells for CCL2 (arrows). F, Mean expression of monocyte immune signature genes in human OS pulmonary metastases versus primary tumors using RNA-seq data obtained from Wu and colleagues. P = 0.1, unpaired two-tailed Student t test.
Figure 2. Losartan inhibits in vitro monocyte migration elicited by canine and human OS cell secretion of CCL2. A, CCL2 secretion by human OS cells quantified via ELISA. B, CCL2 secretion by canine OS cells quantified via ELISA. C, THP-1 monocyte trans-well migration to human OS cell line conditioned media. Data represent mean ± SD, analyzed by one-way ANOVA with Tukey posttest, *, P = 0.01, ***, P < 0.001, ****, P < 0.0001. D, Primary human donor PBMC trans-well migration to human OS cell line conditioned media. Data represent mean ± SD, analyzed by one-way ANOVA with Tukey posttest (**, P < 0.01; ****, P < 0.0001). E, Primary canine donor PBMC trans-well migration to canine OS cell line conditioned media. Data represent mean ± SD, analyzed by one-way ANOVA with Tukey posttest (***, P < 0.001; ****, P < 0.0001). F, Correlation of log10 transformed mean CCL2 secretion (pg/mL) in both canine and human OS cell line conditioned media with log10 transformed mean human THP-1 monocyte, human PBMC, and canine PBMC trans-well migration. Spearman r = 0.64. G, Representative whole well images (10× magnification) and quantification of losartan inhibition of CCL2 directed canine peripheral blood monocyte migration (n = 4 canine donors). Crystal violet staining. Data represent mean ± SEM of each donor, analyzed by one-way ANOVA with Tukey posttest (*, P < 0.05). H, Losartan inhibition of THP-1 monocyte migration to human OS cell line conditioned media. Data represent mean ± SD, analyzed by one-way ANOVA with Tukey posttest (*, P < 0.05; **, P < 0.01; ***, P < 0.001; ****, P < 0.0001). I, Losartan inhibition of human PBMC migration to human OS cell line conditioned media. Data represent mean ± SD, analyzed by one-way ANOVA with Tukey posttest (*, P < 0.05; **, P < 0.01; ***, P < 0.001). J, Losartan inhibition of canine PBMC migration to canine OS cell line conditioned media, n = 5 independent canine donors. All THP-1, human PBMC, and canine PBMC trans-well migration assays were performed in technical triplicate or quadruplicate and are representative of a minimum of two different canine or human blood donors or three independent experiments (THP-1 cells).
Figure 2.
Losartan inhibits in vitro monocyte migration elicited by canine and human OS cell secretion of CCL2. A, CCL2 secretion by human OS cells quantified via ELISA. B, CCL2 secretion by canine OS cells quantified via ELISA. C, THP-1 monocyte trans-well migration to human OS cell line conditioned media. Data represent mean ± SD, analyzed by one-way ANOVA with Tukey posttest, *, P = 0.01, ***, P < 0.001, ****, P < 0.0001. D, Primary human donor PBMC trans-well migration to human OS cell line conditioned media. Data represent mean ± SD, analyzed by one-way ANOVA with Tukey posttest (**, P < 0.01; ****, P < 0.0001). E, Primary canine donor PBMC trans-well migration to canine OS cell line conditioned media. Data represent mean ± SD, analyzed by one-way ANOVA with Tukey posttest (***, P < 0.001; ****, P < 0.0001). F, Correlation of log10 transformed mean CCL2 secretion (pg/mL) in both canine and human OS cell line conditioned media with log10 transformed mean human THP-1 monocyte, human PBMC, and canine PBMC trans-well migration. Spearman r = 0.64. G, Representative whole well images (10× magnification) and quantification of losartan inhibition of CCL2 directed canine peripheral blood monocyte migration (n = 4 canine donors). Crystal violet staining. Data represent mean ± SEM of each donor, analyzed by one-way ANOVA with Tukey posttest (*, P < 0.05). H, Losartan inhibition of THP-1 monocyte migration to human OS cell line conditioned media. Data represent mean ± SD, analyzed by one-way ANOVA with Tukey posttest (*, P < 0.05; **, P < 0.01; ***, P < 0.001; ****, P < 0.0001). I, Losartan inhibition of human PBMC migration to human OS cell line conditioned media. Data represent mean ± SD, analyzed by one-way ANOVA with Tukey posttest (*, P < 0.05; **, P < 0.01; ***, P < 0.001). J, Losartan inhibition of canine PBMC migration to canine OS cell line conditioned media, n = 5 independent canine donors. All THP-1, human PBMC, and canine PBMC trans-well migration assays were performed in technical triplicate or quadruplicate and are representative of a minimum of two different canine or human blood donors or three independent experiments (THP-1 cells).
Figure 3. Dose-escalation of losartan in healthy and OS metastasis-bearing dogs is associated with modulation of CCL2–CCR2 pharmacodynamic endpoints. A, Mean (±SEM) plasma losartan concentration over time following oral administration of losartan at 2.5 or 10 mg/kg twice daily for 14 consecutive days (n = 3 or 4 dogs/group). B, Pharmacodynamic assessment of ex vivo CCL2-directed monocyte migration pre- and 14 days post-dosing of losartan at 2.5 mg/kg twice daily in healthy dogs. C, Pharmacodynamic assessment of ex vivo CCL2-directed monocyte migration pre- and 7, 14, and 28 days post-oral dosing of losartan (10 mg/kg twice daily) plus toceranib (2.75 mg/kg EOD; day 28) in OS-bearing dogs. D, Plasma CCL2 concentration at week 0 and weeks 2 and 4 post-losartan 10 mg/kg dosing, as measured by ELISA (expressed as % of week 0 baseline). E, Peripheral blood total myeloid cell counts (combined absolute monocyte and neutrophil counts) at baseline and week 4 post-losartan treatment. F, Kaplan–Meier curve comparing overall survival in dogs experiencing a greater than 25% decrease in week 4 posttreatment total monocyte counts below baseline (n = 11), versus those that did not (n = 8), for evaluable dogs in both the 1 and 10 mg/kg cohorts (P = 0.04, Gehan–Breslow–Wilcoxon test). Results for B and C represent the mean chemotactic index (fold-change of CCL2-directed migration over negative control wells), as percentage of week 0 baseline. Data expressed as means ± SEM and were analyzed by a two-tailed paired t test (n = 15–17 dogs/group/time-point; **, P < 0.01; ***, P < 0.001).
Figure 3.
Dose-escalation of losartan in healthy and OS metastasis-bearing dogs is associated with modulation of CCL2–CCR2 pharmacodynamic endpoints. A, Mean (±SEM) plasma losartan concentration over time following oral administration of losartan at 2.5 or 10 mg/kg twice daily for 14 consecutive days (n = 3 or 4 dogs/group). B, Pharmacodynamic assessment of ex vivo CCL2-directed monocyte migration pre- and 14 days post-dosing of losartan at 2.5 mg/kg twice daily in healthy dogs. C, Pharmacodynamic assessment of ex vivo CCL2-directed monocyte migration pre- and 7, 14, and 28 days post-oral dosing of losartan (10 mg/kg twice daily) plus toceranib (2.75 mg/kg EOD; day 28) in OS-bearing dogs. D, Plasma CCL2 concentration at week 0 and weeks 2 and 4 post-losartan 10 mg/kg dosing, as measured by ELISA (expressed as % of week 0 baseline). E, Peripheral blood total myeloid cell counts (combined absolute monocyte and neutrophil counts) at baseline and week 4 post-losartan treatment. F, Kaplan–Meier curve comparing overall survival in dogs experiencing a greater than 25% decrease in week 4 posttreatment total monocyte counts below baseline (n = 11), versus those that did not (n = 8), for evaluable dogs in both the 1 and 10 mg/kg cohorts (P = 0.04, Gehan–Breslow–Wilcoxon test). Results for B and C represent the mean chemotactic index (fold-change of CCL2-directed migration over negative control wells), as percentage of week 0 baseline. Data expressed as means ± SEM and were analyzed by a two-tailed paired t test (n = 15–17 dogs/group/time-point; **, P < 0.01; ***, P < 0.001).
Figure 4. High-dose losartan results in objective responses in dogs with metastatic OS. A, Kaplan–Meier curve comparing PFS in dogs treated with either single-agent toceranib (n = 22), low-dose losartan (1 mg/kg) + toceranib (n = 8), or high-dose losartan (10 mg/kg) + toceranib (n = 20). Log rank test for trend P = 0.058. B, Best responses to losartan–palladia combination therapy, as determined by RECIST criteria (shown as % change from baseline) for dogs that remained on study for at least one cycle of repeat thoracic radiographs. *, Dogs with stable disease; #, dogs experiencing a partial response. C, Median duration of response for those dogs experiencing clinical benefit (stable disease or partial response) in the high-dose losartan (10 mg/kg) cohort. D, Kaplan–Meier curve comparing overall survival in dogs treated with either single-agent toceranib (n = 22), low-dose losartan (1 mg/kg) + toceranib (n = 8), or high-dose losartan (10 mg/kg) + toceranib (n = 20). Log-rank test for trend P = 0.84. E and F, Baseline versus 16- and 8-week posttreatment thoracic radiographs, respectively, of two patients in the 10 mg/kg high-dose losartan cohort experiencing partial regression of pulmonary metastases. Both dogs experienced an ∼70% reduction in the sum diameter of their target lesions. For the patient shown in E, this response was initially noted at week 8, remained stable to further reduced at weeks 16 and 24, and no grossly visible OS pulmonary metastases were evident on necropsy of this patient at 27 weeks post treatment. Only a single residual poorly cellular, matrix-rich microscopic metastasis (shown at right), with individual tumor cell necrosis (arrows), was observed in the lung.
Figure 4.
High-dose losartan results in objective responses in dogs with metastatic OS. A, Kaplan–Meier curve comparing PFS in dogs treated with either single-agent toceranib (n = 22), low-dose losartan (1 mg/kg) + toceranib (n = 8), or high-dose losartan (10 mg/kg) + toceranib (n = 20). Log rank test for trend P = 0.058. B, Best responses to losartan–palladia combination therapy, as determined by RECIST criteria (shown as % change from baseline) for dogs that remained on study for at least one cycle of repeat thoracic radiographs. *, Dogs with stable disease; #, dogs experiencing a partial response. C, Median duration of response for those dogs experiencing clinical benefit (stable disease or partial response) in the high-dose losartan (10 mg/kg) cohort. D, Kaplan–Meier curve comparing overall survival in dogs treated with either single-agent toceranib (n = 22), low-dose losartan (1 mg/kg) + toceranib (n = 8), or high-dose losartan (10 mg/kg) + toceranib (n = 20). Log-rank test for trend P = 0.84. E and F, Baseline versus 16- and 8-week posttreatment thoracic radiographs, respectively, of two patients in the 10 mg/kg high-dose losartan cohort experiencing partial regression of pulmonary metastases. Both dogs experienced an ∼70% reduction in the sum diameter of their target lesions. For the patient shown in E, this response was initially noted at week 8, remained stable to further reduced at weeks 16 and 24, and no grossly visible OS pulmonary metastases were evident on necropsy of this patient at 27 weeks post treatment. Only a single residual poorly cellular, matrix-rich microscopic metastasis (shown at right), with individual tumor cell necrosis (arrows), was observed in the lung.
Figure 5. Multiplex cytokine profiling of patient peripheral blood for evaluation of immune correlates associated with response to losartan therapy. A, Mean fold change in peripheral blood cytokine median fluorescence intensity (MFI) at 2 and 4 weeks post-losartan treatment for evaluable patients in the high-dose losartan (10 mg/kg) cohort (n = 13–16 dogs/timepoint). P value calculated by mixed-effects analysis with Benjamini, Krieger, and Yekutieli multicomparison correction (FDR q value). *, q = 0.01 (IL18 week-2 vs. baseline), q = 0.07 (IL18 week-4 vs. baseline), q = 0.03 (CCL2 week-2 and week-4 vs. baseline). B, Comparison of baseline pretreatment mean peripheral blood cytokine MFI values in responders (dogs experiencing clinical benefit, n = 8) versus nonresponders (n = 8) in the high-dose losartan (10 mg/kg) cohort. P value calculated by multiple unpaired t test with Benjamini, Krieger, and Yekutieli multicomparison correction, FDR q = 0.0006 (IL8). C, Mean fold change, relative to pretreatment baseline, in peripheral blood cytokine MFI values at 4 weeks post-losartan treatment, in responders (dogs experiencing clinical benefit, n = 8) versus nonresponders (n = 5) in the high-dose losartan (10 mg/kg) cohort. P value calculated by multiple unpaired t test with Benjamini, Krieger, and Yekutieli multicomparison correction, FDR q = 0.0002 (IL8). D, Correlation matrix between peripheral blood cytokine levels at baseline, week 2, and week 4 posttreatment with patient PFS and overall survival. Spearman r values, green = 1, or strong positive correlation; red = −1 or strong negative correlation; white = 0, no correlation. Outlined boxes indicate Spearman P < 0.05. E, Individual Spearman correlation plots for those cytokines significantly correlated with clinical outcome, as outlined in D.
Figure 5.
Multiplex cytokine profiling of patient peripheral blood for evaluation of immune correlates associated with response to losartan therapy. A, Mean fold change in peripheral blood cytokine median fluorescence intensity (MFI) at 2 and 4 weeks post-losartan treatment for evaluable patients in the high-dose losartan (10 mg/kg) cohort (n = 13–16 dogs/timepoint). P value calculated by mixed-effects analysis with Benjamini, Krieger, and Yekutieli multicomparison correction (FDR q value). *, q = 0.01 (IL18 week-2 vs. baseline), q = 0.07 (IL18 week-4 vs. baseline), q = 0.03 (CCL2 week-2 and week-4 vs. baseline). B, Comparison of baseline pretreatment mean peripheral blood cytokine MFI values in responders (dogs experiencing clinical benefit, n = 8) versus nonresponders (n = 8) in the high-dose losartan (10 mg/kg) cohort. P value calculated by multiple unpaired t test with Benjamini, Krieger, and Yekutieli multicomparison correction, FDR q = 0.0006 (IL8). C, Mean fold change, relative to pretreatment baseline, in peripheral blood cytokine MFI values at 4 weeks post-losartan treatment, in responders (dogs experiencing clinical benefit, n = 8) versus nonresponders (n = 5) in the high-dose losartan (10 mg/kg) cohort. P value calculated by multiple unpaired t test with Benjamini, Krieger, and Yekutieli multicomparison correction, FDR q = 0.0002 (IL8). D, Correlation matrix between peripheral blood cytokine levels at baseline, week 2, and week 4 posttreatment with patient PFS and overall survival. Spearman r values, green = 1, or strong positive correlation; red = −1 or strong negative correlation; white = 0, no correlation. Outlined boxes indicate Spearman P < 0.05. E, Individual Spearman correlation plots for those cytokines significantly correlated with clinical outcome, as outlined in D.
Figure 6. Transcriptional profiling of losartan-treated human PBMCs reveals downregulation of genes associated with M2 macrophage polarization, monocyte migration, and chemokine receptor signaling. A, Heatmap of the 59 differentially expressed genes (adjusted P value <0.05 and log2 fold change of ±1.5) between control (n = 5) and losartan-treated (n = 4; 10 μg/mL) human PBMCs. B, Volcano plot of differentially expressed genes. The top 10 up- and downregulated genes are highlighted in green and red, respectively. C, Normalized enrichment scores (NES) for pathways related to CCL2–CCR2 signaling and monocyte chemotaxis, which were significantly downregulated (FDR q < 0.05) in losartan-treated PBMCs versus control, identified by GSEA using the GO-Biological Processes gene sets from the Molecular Signatures database (MSigDB). D, GSEA negative enrichment plots for monocyte chemotaxis and ERK1/2 signaling genetic signatures in losartan-treated human PBMCs.
Figure 6.
Transcriptional profiling of losartan-treated human PBMCs reveals downregulation of genes associated with M2 macrophage polarization, monocyte migration, and chemokine receptor signaling. A, Heatmap of the 59 differentially expressed genes (adjusted P value <0.05 and log2 fold change of ±1.5) between control (n = 5) and losartan-treated (n = 4; 10 μg/mL) human PBMCs. B, Volcano plot of differentially expressed genes. The top 10 up- and downregulated genes are highlighted in green and red, respectively. C, Normalized enrichment scores (NES) for pathways related to CCL2–CCR2 signaling and monocyte chemotaxis, which were significantly downregulated (FDR q < 0.05) in losartan-treated PBMCs versus control, identified by GSEA using the GO-Biological Processes gene sets from the Molecular Signatures database (MSigDB). D, GSEA negative enrichment plots for monocyte chemotaxis and ERK1/2 signaling genetic signatures in losartan-treated human PBMCs.

Comment in

References

    1. Valastyan S, Weinberg RA. Tumor metastasis: molecular insights and evolving paradigms. Cell 2011;147:275–92. - PMC - PubMed
    1. Lim SY, Yuzhalin AE, Gordon-Weeks AN, Muschel RJ. Targeting the CCL2-CCR2 signaling axis in cancer metastasis. Oncotarget 2016;7:28697–710. - PMC - PubMed
    1. Qian BZ, Li J, Zhang H, Kitamura T, Zhang J, Campion LR, et al. CCL2 recruits inflammatory monocytes to facilitate breast-tumour metastasis. Nature 2011;475:222–5. - PMC - PubMed
    1. Nakasone ES, Askautrud HA, Kees T, Park JH, Plaks V, Ewald AJ, et al. Imaging tumor-stroma interactions during chemotherapy reveals contributions of the microenvironment to resistance. Cancer Cell 2012;21:488–503. - PMC - PubMed
    1. Piao C, Cai L, Qiu S, Jia L, Song W, Du J. Complement 5a enhances hepatic metastases of colon cancer via monocyte chemoattractant protein-1-mediated inflammatory cell infiltration. J Biol Chem 2015;290:10667–76. - PMC - PubMed

Publication types