. 2021 Dec 1;27(23):6602-6612.
doi: 10.1158/1078-0432.CCR-21-1681. Epub 2021 Sep 27.

Organoids Derived from Neoadjuvant FOLFIRINOX Patients Recapitulate Therapy Resistance in Pancreatic Ductal Adenocarcinoma

Affiliations

Organoids Derived from Neoadjuvant FOLFIRINOX Patients Recapitulate Therapy Resistance in Pancreatic Ductal Adenocarcinoma

Elham Aida Farshadi et al. Clin Cancer Res. .

Abstract

Purpose: We investigated whether organoids can be generated from resected tumors of patients who received eight cycles of neoadjuvant FOLFIRINOX chemotherapy before surgery, and evaluated the sensitivity/resistance of these surviving cancer cells to cancer therapy.

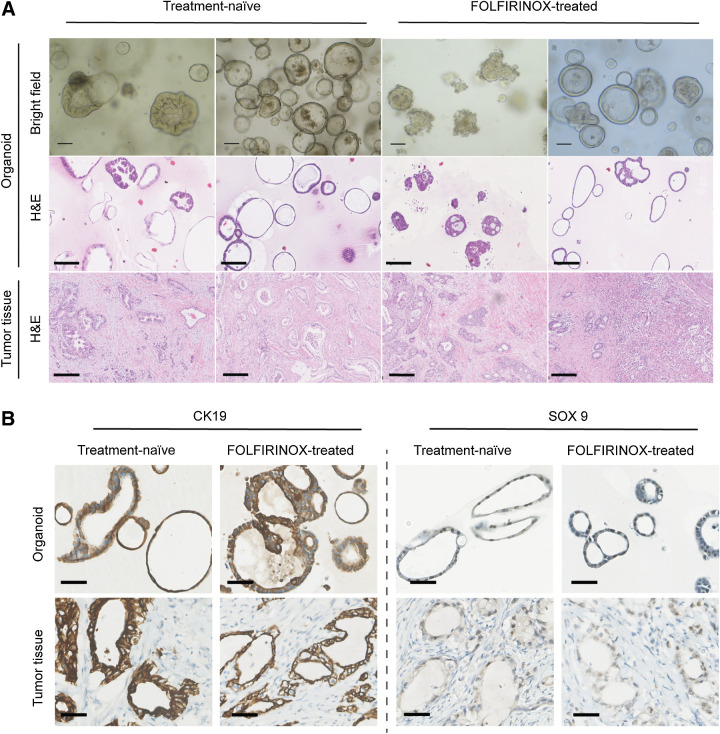
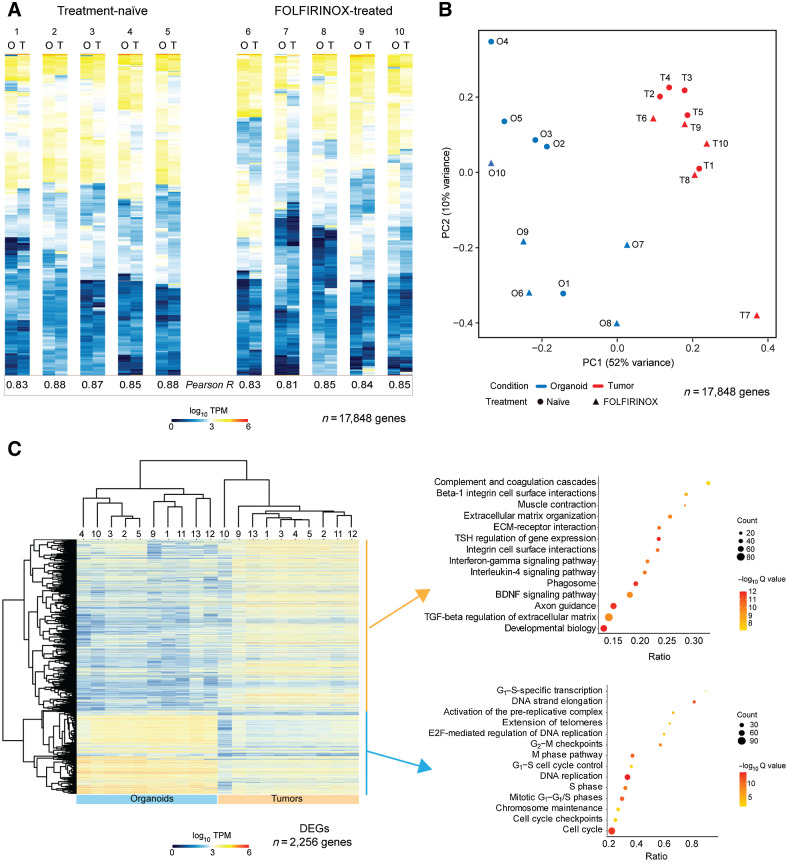
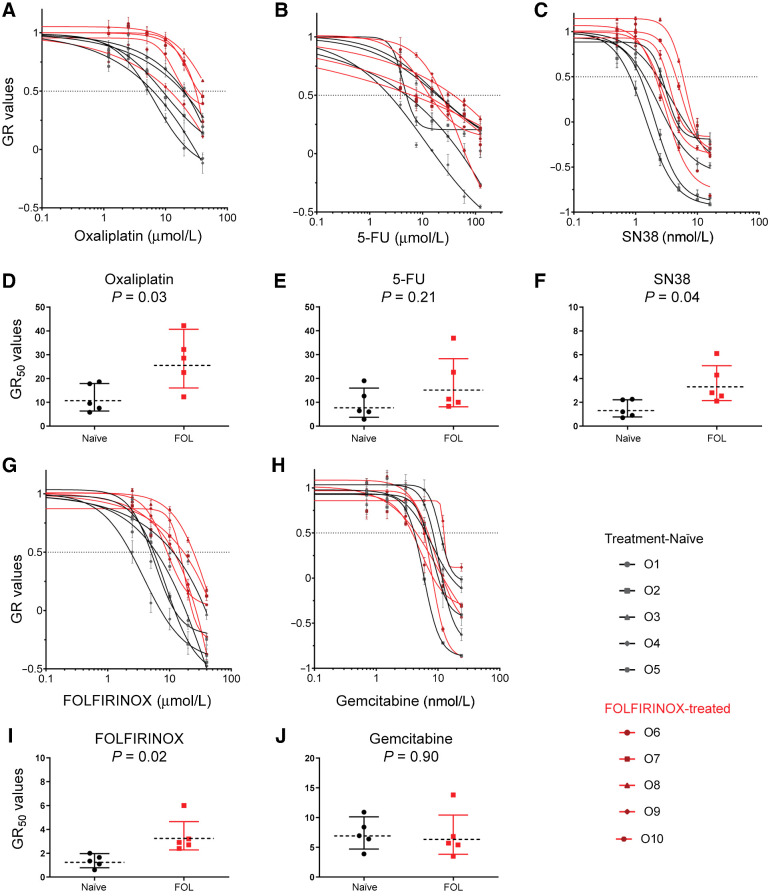
Experimental design: We generated a library of 10 pancreatic ductal adenocarcinoma (PDAC) organoid lines: five each from treatment-naïve and FOLFIRINOX-treated patients. We first assessed the histologic, genetic, and transcriptional characteristics of the organoids and their matched primary PDAC tissue. Next, the organoids' response to treatment with single agents-5-FU, irinotecan, and oxaliplatin-of the FOLFIRINOX regimen as well as combined regimen was evaluated. Finally, global mRNA-seq analyses were performed to identify FOLFIRINOX resistance pathways.

Results: All 10 patient-derived PDAC organoids recapitulate histologic, genetic, and transcriptional characteristics of their primary tumor tissue. Neoadjuvant FOLFIRINOX-treated organoids display resistance to FOLFIRINOX (5/5), irinotecan (5/5), and oxaliplatin (4/5) when compared with treatment-naïve organoids (FOLFIRINOX: 1/5, irinotecan: 2/5, oxaliplatin: 0/5). 5-Fluorouracil treatment responses between naïve and treated organoids were similar. Comparative global transcriptome analysis of treatment-naïve and FOLFIRINOX samples-in both organoids and corresponding matched tumor tissues-uncovered modulated pathways mainly involved in genomic instability, energy metabolism, and innate immune system.

Conclusions: Resistance development in neoadjuvant FOLFIRINOX organoids, recapitulating their primary tumor resistance, suggests continuation of FOLFIRINOX therapy as an adjuvant treatment may not be advantageous for these patients. Gene-expression profiles of PDAC organoids identify targetable pathways involved in chemoresistance development upon neoadjuvant FOLFIRINOX treatment, thus opening up combination therapy possibilities.


Figures

Figure 1. Overview of treatment algorithm, organoid cultures, and their mutational landscape. A, Schematic representation of two groups of PDAC patients, and establishment of organoid cultures. Passage 10 corresponds to the success rate for organoid culture. B, Targeted sequencing analysis of primary tumors and their corresponding patient-derived organoids. The type of mutations detected in each sample is indicated with colored boxes. If multiple mutations in a gene occurred, only one mutation is shown in this table. ND/BC, not detected/below cutoff. C, Bar graph showing prevalence of driver mutations for each group. Blue bars indicate treatment-naïve samples, and orange bars indicate FOLFIRINOX-treated samples. Lighter bars represent tumor samples, and darker bars represent organoids.
Figure 1.
Overview of treatment algorithm, organoid cultures, and their mutational landscape. A, Schematic representation of two groups of PDAC patients, and establishment of organoid cultures. Passage 10 corresponds to the success rate for organoid culture. B, Targeted sequencing analysis of primary tumors and their corresponding patient-derived organoids. The type of mutations detected in each sample is indicated with colored boxes. If multiple mutations in a gene occurred, only one mutation is shown in this table. ND/BC, not detected/below cutoff. C, Bar graph showing prevalence of driver mutations for each group. Blue bars indicate treatment-naïve samples, and orange bars indicate FOLFIRINOX-treated samples. Lighter bars represent tumor samples, and darker bars represent organoids.
Figure 2. Histologic features of patient-derived PDAC organoids and the corresponding primary tumor tissues. A, Representative bright field images of organoid cultures (top), H&E staining (middle) of fixed and sectioned organoids, and H&E staining (bottom) of sectioned parental primary PDAC tissues, from the two patient groups. Scale bars, 100 μm (top row, bright field images) and 250 μmol/L (middle and bottom rows). B, Representative images of fixed and sectioned PDAC organoid cultures and parental tumor tissues, immunohistochemically stained for Keratin 19 (CK19), and transcription factor SOX9 protein expression. Images were taken with 40× magnification. Scale bars, 50 μm.
Figure 2.
Histologic features of patient-derived PDAC organoids and the corresponding primary tumor tissues. A, Representative bright field images of organoid cultures (top), H&E staining (middle) of fixed and sectioned organoids, and H&E staining (bottom) of sectioned parental primary PDAC tissues, from the two patient groups. Scale bars, 100 μm (top row, bright field images) and 250 μmol/L (middle and bottom rows). B, Representative images of fixed and sectioned PDAC organoid cultures and parental tumor tissues, immunohistochemically stained for Keratin 19 (CK19), and transcription factor SOX9 protein expression. Images were taken with 40× magnification. Scale bars, 50 μm.
Figure 3. Transcriptome profiles of organoids and matched primary tumors. A, Heatmaps of hierarchically clustered genes of 10 organoid lines (O) and their matched primary tumors (T) from two patient groups. Pearson correlation for each organoid–tumor pair is displayed below the heatmap. TPM represents transcripts per million reads. B, Principal component analysis (PCA) of the normalized transcript counts. Organoid samples are marked in blue, and tumor samples are marked in red. Treatment-naïve and FOLFIRINOX-treated samples are indicated in closed circles and closed triangles, respectively. C, Heatmap of hierarchically clustered DEGs between 10 organoids and 10 tumor samples (left). Right, top 14 KEGG pathways enriched among the upregulated genes (top) and downregulated genes (bottom). Dot size represents the number of genes in each involved pathway. Dot color shows −log10 (Q value) in each term enrichment. X-axis is ratio of the genes to all the DEGs.
Figure 3.
Transcriptome profiles of organoids and matched primary tumors. A, Heatmaps of hierarchically clustered genes of 10 organoid lines (O) and their matched primary tumors (T) from two patient groups. Pearson correlation for each organoid–tumor pair is displayed below the heatmap. TPM represents transcripts per million reads. B, Principal component analysis (PCA) of the normalized transcript counts. Organoid samples are marked in blue, and tumor samples are marked in red. Treatment-naïve and FOLFIRINOX-treated samples are indicated in closed circles and closed triangles, respectively. C, Heatmap of hierarchically clustered DEGs between 10 organoids and 10 tumor samples (left). Right, top 14 KEGG pathways enriched among the upregulated genes (top) and downregulated genes (bottom). Dot size represents the number of genes in each involved pathway. Dot color shows −log10 (Q value) in each term enrichment. X-axis is ratio of the genes to all the DEGs.
Figure 4. Drug-sensitivity assay of patient-derived organoids. Dose–response curves of 10 patient-derived organoid cultures (passage 7/8) exposed to (A) oxaliplatin, (B) 5-FU, and (C) SN38. Black lines represent treatment-naïve, and red lines represent FOLFIRINOX-treated organoids. X-axis shows the logarithmic transformed drug concentrations; Y-axis represents the growth rate inhibition values (GR) at 72 hours after drug exposure. Each data point corresponds to the mean of six replicates (two biological experiments with three technical replicates each); error bars, standard error. D–F, GR50 values for oxaliplatin, 5-FU, and SN38, respectively. Dose–response curves for FOLFIRINOX and gemcitabine are displayed in G and H, respectively. I and J, GR50 values for FOLFIRINOX and gemcitabine, respectively. Drug responses were compared using an unpaired t test with Welch correction.
Figure 4.
Drug-sensitivity assay of patient-derived organoids. Dose–response curves of 10 patient-derived organoid cultures (passage 7/8) exposed to (A) oxaliplatin, (B) 5-FU, and (C) SN38. Black lines represent treatment-naïve, and red lines represent FOLFIRINOX-treated organoids. X-axis shows the logarithmic transformed drug concentrations; Y-axis represents the growth rate inhibition values (GR) at 72 hours after drug exposure. Each data point corresponds to the mean of six replicates (two biological experiments with three technical replicates each); error bars, standard error. DF, GR50 values for oxaliplatin, 5-FU, and SN38, respectively. Dose–response curves for FOLFIRINOX and gemcitabine are displayed in G and H, respectively. I and J, GR50 values for FOLFIRINOX and gemcitabine, respectively. Drug responses were compared using an unpaired t test with Welch correction.
Figure 5. Comparative transcriptome analyses of primary tumor and organoid samples. A, Venn diagram of DEGs between treatment-naïve and FOLFIRINOX-treated groups of both primary tumors and organoids. B, Heatmap of DEGs in FOLFIRINOX-treated samples versus treatment naïve that overlap in the tumors and organoids. Genes are hierarchically clustered. C, Gene ontology (GO) analysis of overlapping upregulated and downregulated genes in the FOLFIRINOX-treated samples. The Reactome database is used to identify significant pathways using a cutoff of P < 0.05.
Figure 5.
Comparative transcriptome analyses of primary tumor and organoid samples. A, Venn diagram of DEGs between treatment-naïve and FOLFIRINOX-treated groups of both primary tumors and organoids. B, Heatmap of DEGs in FOLFIRINOX-treated samples versus treatment naïve that overlap in the tumors and organoids. Genes are hierarchically clustered. C, Gene ontology (GO) analysis of overlapping upregulated and downregulated genes in the FOLFIRINOX-treated samples. The Reactome database is used to identify significant pathways using a cutoff of P < 0.05.

References

    1. Yu J, Blackford AL, dal Molin M, Wolfgang CL, Goggins M. Time to progression of pancreatic ductal adenocarcinoma from low-to-high tumour stages. Gut 2015;64:1783. - PMC - PubMed
    1. Oettle H, Neuhaus P, Hochhaus A, Hartmann JT, Gellert K, Ridwelski K, et al. Adjuvant chemotherapy with gemcitabine and long-term outcomes among patients with resected pancreatic cancer: the CONKO-001 randomized trial. JAMA 2013;310:1473. - PubMed
    1. Khorana AA, Mangu PB, Berlin J, Engebretson A, Hong TS, Maitra A, et al. Potentially curable pancreatic cancer: American Society of Clinical Oncology Clinical Practice Guideline. JCO 2016;34:2541–56. - PubMed
    1. Conroy T, Desseigne F, Ychou M, Bouché O, Guimbaud R, Bécouarn Y, et al. FOLFIRINOX versus gemcitabine for metastatic pancreatic cancer. N Engl J Med 2011;364:1817–25. - PubMed
    1. Conroy T, Hammel P, Hebbar M, Ben Abdelghani M, Wei AC, Raoul J-L, et al. FOLFIRINOX or gemcitabine as adjuvant therapy for pancreatic cancer. N Engl J Med 2018;379:2395–406. - PubMed

Publication types

MeSH terms