. 2021 Sep;9(9):e002922.
doi: 10.1136/jitc-2021-002922.

Eosinophilic features in clear cell renal cell carcinoma correlate with outcomes of immune checkpoint and angiogenesis blockade

Affiliations

Eosinophilic features in clear cell renal cell carcinoma correlate with outcomes of immune checkpoint and angiogenesis blockade

Takashi Yoshida et al. J Immunother Cancer. 2021 Sep.

Abstract

Background: Clear cell renal cell carcinoma (ccRCC) displays heterogeneity in appearance-a distinctive pale clear to eosinophilic cytoplasm; however, little is known about the underlying mechanisms and clinical implications. We investigated the role of these eosinophilic features in ccRCC on oncological outcomes and response to tyrosine kinase inhibitors (TKIs) and immune checkpoint inhibitors (ICIs).

Methods: One-hundred and thirty-eight ccRCC cases undergoing radical surgery (cohort 1) and 54 metastatic ccRCC cases receiving either TKIs or ICIs (cohort 2) were included. After histological evaluation, all cases were divided into three phenotypes based on the eosinophilic features at the highest-grade area: clear, mixed, or eosinophilic type. Gene expression and immunohistochemical analyses were performed to explore the potential mechanisms of these phenotypes in cohort 1. Further, the association of the three phenotypes with the best objective response to TKI or ICI, clinical benefit (complete/partial response or stable disease), and overall survival (OS) was assessed in cohort 2.

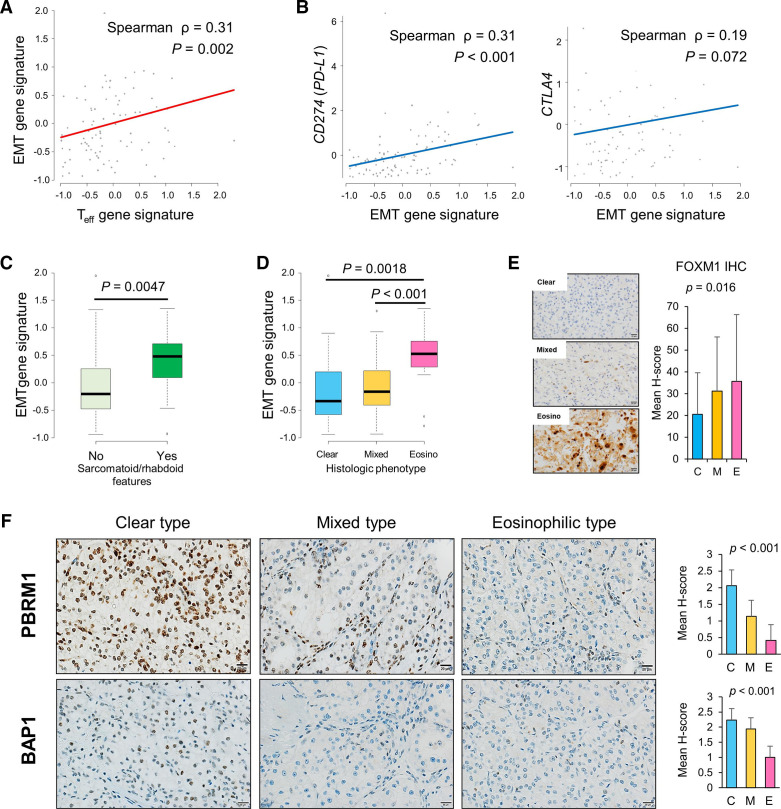
Results: The clear type was significantly associated with increased hypoxia as well as angiogenesis gene signatures compared with the eosinophilic type. Gene signatures and protein expression related to effector T cell and immune checkpoint molecules were elevated to a greater extent in the eosinophilic type, followed by the mixed and clear types. The mixed and eosinophilic types exhibited greater PBRM1-negativity and increased prevalence of the epithelial-mesenchymal transition gene signature than the clear type. In the mixed/eosinophilic types of cohort 2, significant clinical benefit was observed in the ICI therapy group versus the TKI therapy group (p=0.035), and TKI therapy vs ICI therapy was an independent factor for worse prognosis of OS (HR 3.236; p=0.012).

Conclusion: The histological phenotype based on the eosinophilic features, which are linked to major immunological mechanisms of ccRCC, was significantly correlated with therapeutic efficacy.

Keywords: biomarkers; immunohistochemistry; immunotherapy; kidney neoplasms; neovasularization; pathologic; tumor.


Conflict of interest statement

Competing interests: None declared.

Figures

Figure 1
Figure 1
Clinicopathological features and histological phenotypes in ccRCC undergoing radical surgery. (A) Cytoplasmic patterns of histological phenotype at the highest-grade area defining the clear type (tumor cells with clear, pale cytoplasm), mixed type (some tumor cells are clear, and some are eosinophilic), and eosinophilic type (tumor cells with eosinophilic cytoplasm). (B) Percentage of the cases of each phenotype classified by pathological factors; χ² test was used for statistics. (C, D) Kaplan–Meier curves of relapse-free survival and CSS stratified by histological phenotypes; a Cox proportional hazards model adjusting for age and sex was used for statistics. ccRCC, clear cell renal cell carcinoma; CSS, cancer-specific survival; RFS, relapse-free survival.
Figure 2
Figure 2
mRNA and protein expression analyses for the histological subtypes. (A) Hierarchical cluster analysis using the IMmotion 150 gene signature. The color bar on the top of the heatmap represents, from top to bottom, the cluster, WHO/ISUP grade, necrosis, ClearCode34 molecular subtype, sarcomatoid/rhabdoid features, and histological phenotype. Comparison of gene and protein expression (mean Z-score, H-score, density score, or % microvessel area) between histological phenotypes; (B, C) Hypoxia-related genes and protein, CA9 IHC. (D) Correlation between angio gene signature score and HIF2a expression; the Spearman’s rank correlation test was used for statistical analysis. (E, F) Angio gene signature score and CD31 IHC. (G, H) Teff gene signature score and CD8+ TILs IHC. (I, J) CD274 (PD-L1) expression, PD-L1 IHC tumor cell (TC) score, and tumor-infiltrating IC scores. (K) CTLA-4 expression. Data are presented as mean±SD or median (range). One-way analysis of variance with Tukey test or Kruskal-Wallis test with Holm’s method was used. angio, angiogenesis; ARNT, aryl hydrocarbon receptor nuclear translocator; C, clear type; CA9, carbonic anhydrase IX; CD274, cluster of differentiation 274; CD31, cluster of differentiation 31; CD8, cluster of differentiation 8; CTLA-4, cytotoxic T-lymphocyte associated antigen-4; E, eosinophilic type; EPAS1, endothelial PAS domain-containing protein 1; HIF1β, hypoxia-inducible factor 1-beta; HIF2α, hypoxia-inducible factor 2-alpha; IC, immune cell; IHC, immunohistochemistry; ISUP, International Society of Urological Pathology; M, mixed type; PDL-1, programmed death-ligand 1; Teff, T-effector; TIL, tumor-infiltrating lymphocyte.
Figure 4
Figure 4
Clinical outcomes and histological phenotypes in metastatic ccRCC (cohort 2). (A) Percentage of cases of each phenotype based on pathological factors; χ² test was used for statistics. (B, C) Kaplan-Meier curve of OS stratified by histological phenotypes, and concordance indices of the IMDC risk classification and histological phenotyping. The log-rank test was used for statistics. (C) Maximum change from baseline in tumor burden after systemic therapy initiation in cohort 2. (D) Percentage of cases with the best objective response to the tyrosine-kinase inhibitor or immune checkpoint inhibitor. Clinical benefit indicates CR, PR, or SD. The χ² test was used for statistical analysis. (E, F) Kaplan-Meier curves of OS stratified by the therapeutic group combined with histological phenotypes; for example, TKI-C, ICI-M, and TKI-M/E. The log-rank test with Holm’s method was used for statistics. CR, complete response; IMDC, International Metastatic RCC Database Consortium; OS, overall survival; PD, progression disease; PR, partial response; SD, stable disease; TKI-C, clear type treated with TKI, ICI-M, mixed type treated with ICI; TKI-M/E, mixed and eosinophilic types treated with TKI.
Figure 3
Figure 3
Potential markers of response to immune checkpoint blockade. Correlation between EMT gene signature and immune-related factors; (A) EMT and Teff gene signature scores; (B) EMT gene signature score and expression levels of CD274 (PD-L1) or CTLA-4; The Spearman’s rank correlation test was used for statistical analysis. Correlation between EMT gene signature and histological factors: (C) sarcomatoid/rhabdoid features; (D) histological phenotypes. (E) FOXM1 IHC and histological phenotypes. (F) Representative stains of PBRM1, BAP1. Mean H-scores were compared between histological phenotypes. Error bars are SD. One-way analysis of variance with the Tukey test was used for statistics. BAP1, breast cancer 1-associated protein 1; C, clear type; CD274, cluster of differentiation 274; CTLA-4, cytotoxic T-lymphocyte associated antigen-4; E, eosinophilic type; FOXM1, forkhead box M1; IHC, immunohistochemical; M, mixed type; PBRM1, polybromo-1; PDL-1, programmed death-ligand 1; Teff, T-effector.

References

    1. Verine J, Colin D, Nheb M, et al. . Architectural patterns are a relevant morphologic grading system for clear cell renal cell carcinoma prognosis assessment: comparisons with WHO/ISUP grade and integrated staging systems. Am J Surg Pathol 2018;42:423–41. 10.1097/PAS.0000000000001025 - DOI - PubMed
    1. Choueiri TK, Kaelin WG. Targeting the HIF2-VEGF axis in renal cell carcinoma. Nat Med 2020;26:1519–30. 10.1038/s41591-020-1093-z - DOI - PubMed
    1. Nilsson H, Lindgren D, Axelson H, et al. . Features of increased malignancy in eosinophilic clear cell renal cell carcinoma. J Pathol 2020;252:384–97. 10.1002/path.5532 - DOI - PMC - PubMed
    1. Motzer RJ, Jonasch E, Boyle S, et al. . NCCN guidelines insights: kidney cancer, version 1.2021. J Natl Compr Canc Netw 2020;18:1160–70. 10.6004/jnccn.2020.0043 - DOI - PMC - PubMed
    1. Miao D, Margolis CA, Gao W, et al. . Genomic correlates of response to immune checkpoint therapies in clear cell renal cell carcinoma. Science 2018;359:801–6. 10.1126/science.aan5951 - DOI - PMC - PubMed

Publication types

Substances