. 2021 Sep 27;12(1):5671.
doi: 10.1038/s41467-021-25929-1.

Bardet-Biedl syndrome proteins modulate the release of bioactive extracellular vesicles

Affiliations

Bardet-Biedl syndrome proteins modulate the release of bioactive extracellular vesicles

Ann-Kathrin Volz et al. Nat Commun. .

Abstract

Primary cilia are microtubule based sensory organelles important for receiving and processing cellular signals. Recent studies have shown that cilia also release extracellular vesicles (EVs). Because EVs have been shown to exert various physiological functions, these findings have the potential to alter our understanding of how primary cilia regulate specific signalling pathways. So far the focus has been on lgEVs budding directly from the ciliary membrane. An association between cilia and MVB-derived smEVs has not yet been described. We show that ciliary mutant mammalian cells demonstrate increased secretion of small EVs (smEVs) and a change in EV composition. Characterisation of smEV cargo identified signalling molecules that are differentially loaded upon ciliary dysfunction. Furthermore, we show that these smEVs are biologically active and modulate the WNT response in recipient cells. These results provide us with insights into smEV-dependent ciliary signalling mechanisms which might underly ciliopathy disease pathogenesis.


Conflict of interest statement

António Domingues is currently an employee of Dewpoint Therapeutics. The remaining authors declare no competing interests.

Figures
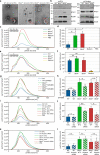
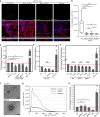
Fig. 1
Fig. 1. Characterisation of control and ciliary mutant extracellular vesicles.
Extracellular vesicles (EVs) were isolated from ciliated kidney medullary (KM) cell culture supernatant using differential ultracentrifugation. a Morphological properties of isolated EVs were determined via negative staining followed by transmission electron microscopy and revealed 100–150 nm vesicles (scale bars: 100 nm; experiment was repeated two times). b Western blot analysis identified known EV markers (Tsg101, Flot-1, CD81 and CD9). We observed differences in protein expression between samples. The experiment was repeated three times. Original blots are provided as the source data file. c, d Nano Particle Tracking Analysis (NTA) measurements from ciliated wild-type cells show less smEV release compared to ciliated Bbs4−/− and Bbs6−/− cells (NWT, Bbs4−/−, medium, PBS = four independent experiments; NBbs6−/− = three independent experiments; unpaired t test pWT vs. Bbs4−/− = 0.038; pWT vs. Bbs6−/− = 0.043). Most particles were between 50 and 200 nm in size. Medium and PBS control contained no particles. e, f NTA measurements from serum-fed KM cells showed less vesicles. It was no difference in particle number between WT, Bbs4−/− and Bbs6−/− observed. (NWT, Bbs4−/−, Bbs6−/−, medium = three independent experiments; unpaired t test pWT vs. Bbs4−/− = 0.382; pWT−/−vs Bbs6−/− = 0.927; pBbs4−/− vs. Bbs6−/− = 0.669). g, h NTA of KM cells treated with GW4869 showed a decrease in particle number in Bbs4−/− samples compared to untreated Bbs4−/− KM cells. WT and Bbs6−/− vesicle number was not reduced upon treatment (NWT = five independent experiments; NBbs4−/−, Bbs6−/− = four independent experiments; paired t test pWT = 0.748; pBbs4−/− = 0.02; pBbs6−/− = 0.542). i, j Alix knockdown via siRNA significantly decreased the number of vesicles released from ciliary mutant cells. EV release was unchanged in control cells upon knockdown (NWT = five independent experiments; NBbs4−/− = three independent experiments; NBbs6−/− = four independent experiments; unpaired t test pWT = 0.695; pBbs4−/− = 0.007; pBbs6−/− = 0.038). k, l EV release was unchanged in control and cilia mutant cells upon Annexin1 (Anxa1) knockdown (NWT, Bbs4−/−, Bbs6−/− = 3 independent experiments; unpaired t test pWT=0.576; pBbs4−/− = 0.943; pBbs6−/− = 0.930). d, f, h, j, l Data are presented as mean values + /− SEM. n.s., P > 0.05, *P ≤ 0.05, **P < 0.01, ***P < 0.001. Source data are provided as a Source Data file.
Fig. 2
Fig. 2. Specific proteins exhibit unique modes of EV release.
a Comparison of EV protein content identified with LC-MS from ciliated (serum-starved) and less ciliated (serum-fed) KM cells showed less proteins released from serum-fed cells. b, c Proteins identified via liquid chromatography-mass spectrometry analysis in four out of six (smEV and mixed EV) or three out of four (lgEV) pellets isolated from ciliated control KM supernatant. Each point represents one protein. Its location on the x axis depicts its relative abundance. b Proteins listed on the ExoCarta Top 100 protein list are marked in blue (exocarta.org). ExoCarta proteins were predominantly found in the middle cluster, therefore equally abundant in small vs. large EVs. c Proteins localising to the left cluster were considered enriched in lgEVs and absent from smEVs. Significantly enriched lgEVs (relative abundance ≤ −10 and a significance −log ≥2) are labelled red. Significantly enriched lgEVs that were also identified in separate lgEV preparations are labelled purple. d Absolute numbers of different protein populations depicted in (c, d). e In all, 93 out of the 100 ExoCarta proteins were detected. f Graphical representation of smEV protein abundance. g Absolute numbers of Wnt signalling proteins identified in different populations as determined by Uniprot or GetGo (uniport.org; getgo.russelllab.org). bf Source data are provided as Source and Supplementary data file.
Fig. 3
Fig. 3. Cilia dysfunction alters EV protein composition.
ac Proteins identified via liquid chromatography-mass spectrometry analysis in four out of six pellets isolated from control and ciliated mutant KM cell supernatant. Source data are provided as a Supplementary data file. a Repeat of scatter plot in Fig. 2c depicted to demonstrate change in the mode of protein release from lgEVs in control to smEVs upon cilia dysfunction for the subset of proteins. b, c Proteins identified in smEV preparations from control vs. cilia mutant cells. Proteins in the right cluster were enriched in smEVs released from mutant cells. Proteins demarked in red and purple were proteins considered enriched in control lgEVs and absent from control smEVs. Their shift to the right cluster suggests an altered method of release from mutant cells. d Simplified schematic representation of possible modes of EV release. lgEVs are released at the ciliary tip and smEVs from the cell membrane. Upon ciliary dysfunction, this is hampered and increased MVB-derived smEVs are released directly from the cell membrane (figure created by V.Kretschmer). e Absolute numbers of different protein populations depicted in (b, c). Bbs4−/− and Bbs6−/− smEVs contained twice as many proteins compared to control. f Number of proteins significantly enriched (P value −log ≥2) in Bbs4−/− and Bbs6−/− smEVs compared to the control.
Fig. 4
Fig. 4. smEVs released from cilia mutant cells contain differentially loaded miRNAs involved in Wnt signalling.
a, b Volcano blots of miRNAs isolated from three independent smEV prepartions from Bbs4−/− (a) and Bbs6−/− (b) cells compared to control. Upregulated miRNAs are depicted by red dots, downregulated by blue dots. c, d Heatmaps of all differentially loaded miRNAs with a log2 fold change ≥2 or ≤ −2 and adjusted P value <0.1 compared to control. miRNAs with target genes related to the Wnt signalling pathway are marked in purple. Source data are provided as a Supplementary data file.
Fig. 5
Fig. 5. Small EVs are bioactive and modulate the cellular Wnt response.
a HEK293T cells (Phalloidin (cell membrane), DAPI (nuclei)) were able to take up fluorescently labelled EVs (green dots, PKH67 staining) harvested from ciliated control and mutant KM supernatant. Medium controls show low background staining (scale bar = 25 µm; figure shows representative images from three independent experiments). b Quantification of fluorescently labelled EV signal per µm2 as shown in (a). A significantly higher fluorescent signal was detected in HEK293T cells incubated with smEVs derived from control KM cells compared to cilia mutant cells (NWT, Bbs4−/−, Bbs6−/− EVs, medium = 13 analysed images from three independent experiments; two-sided Mann–Whitney U test pWT EV vs. Bbs4−/− EV = 0.00013; pWT EV vs. Bbs6−/− EV = 0.000072; pWT EV vs. medium = 1.923E-7; pBbs4−/− EV vs. medium = 0.064; pBbs6−/− EV vs. medium = 0.05). c Purification of smEVs and application on TCF/LEF reporter-HEK293T cells. Relative Wnt activity of smEV-treated TCF/LEF HEK cells as measured via luminescence. Vesicle number was measured via NTA. The applied vesicle number was normalised to control EV number. Application of smEVs derived from all ciliated KM cells significantly decreased the Wnt response of target cells (NWT, Bbs4−/−, Bbs6−/− = four independent experiments; two-sided Mann–Whitney U test pWT vs. TCF = 0.028; pBbs4−/− vs. TCF = 0.028; pBbs6−/− vs. TCF = 0.047) with no significant difference between the smEVs derived from control or ciliary mutant samples (two-sided Mann–Whitney U test pWT vs. Bbs4−/− = 0.713; pWT vs. Bbs6−/− = 0.551). Medium control shows no difference in Wnt readout (NMedium = three independent experiments). WNT3a conditioned media was used as a positive control and serum-starved (ss) cells were used as a negative control. d Luciferase assay with control KM EVs purified via differential centrifugation (UT) and magnetic beads (Beads) showed no difference in the ability to dampen Wnt signalling in target cells (NWT EV UT, WT EV Beads = five independent experiments; two-sided Mann–Whitney U test pWT EV UT vs. WT EV Beads = 0.690. e Dicer siRNA-mediated knockdown inside control and mutant KM cells prior EV purification showed no difference in capability to dampen Wnt signalling inside target cells. (NDicer NTC, Dicer kd = three independent experiments; two-sided Mann–Whitney U test pWT NTC vs WT Dicer = 0.7; unpaired t test pBbs4−/− NTC vs. Bbs4−/− Dicer=0.775; pBbs6−/− NTC vs. Bbs6−/− Dicer = 0.893). f Morphological properties of isolated UREC EVs were determined via negative staining followed by transmission electron microscopy and revealed 100–150 nm vesicles (scale bars: 100 nm, experiment was done two times). g Nano Particle Tracking Analysis (NTA) measurements from control UREC cells show less smEV release compared to BBS10 cells. Medium control contained no particles (NControl, BBS10, medium = three independent experiments). h Luciferase assay of isolated UREC EVs showed reduced Wnt signalling in target cells upon application of BBS10 EVs (NBBS10 = three independent experiments). EVs from control cells showed no effect (NControl = three independent experiments; unpaired t test pUT vs. BBS10 EV = 0.05; pUT vs. control EV = 0.385). b Boxplots show median, interquartile range, and maximum and minimum within 1.5 interquartile range. ce, h Data are presented as mean values + /− SEM. n.s., P > 0.05, *P ≤ 0.05, **P < 0.01, ***P < 0.001.
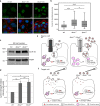
Fig. 6
Fig. 6. Control and ciliary mutant cells show differences in Wnt signalling.
a Representative immunofluorescent images of nuclear Cyclin D1 (green) staining in control and ciliary mutant KM cells (Phalloidin (cell membrane), DAPI (nuclei)). b Quantification of Cyclin D1 intensity inside the nucleus showed significantly stronger intensities inside the ciliary mutant cells, indicating an upregulation of Wnt signalling (NWT = 389 cells; NBbs4−/− = 330 cells, NBbs6−/− = 428 cells; two-sided Mann–Whitney U test pWT vs. Bbs4−/− = 4.19E-27; pWT vs. Bbs6−/− = 1.09E-15; pBbs4−/− vs. Bbs6−/− = 0.02). c Representative western blot image of Cyclin D1 in control and ciliary mutant KM cells. The experiment was done four times. d Quantification of Cyclin D1 relative band intensity identified a significant difference between control and Bbs6−/− KM cells (N = 4; unpaired t test pWT vs. Bbs6−/− = 0.046, Data are presented as mean values + /− SEM), but no difference between both ciliary mutants or WT and Bbs4−/− cells (N = 4; unpaired t test pBbs4−/− vs. Bbs6−/− = 0.767; pWT vs. Bbs6−/− = 0.056, Data are presented as mean values + /− SEM). e, f Possible schematic representation of EV shedding from control and ciliary mutant cells and its effect on target cells. e Ciliary mutant cells release more MVB-derived EVs with different content from the plasma membrane. Mutant cells exhibit higher levels of WNT signalling (figure created by V.Kretschmer). f Application of the same number of EVs on target cells leads to a Wnt dampening effect. Since less Bbs4−/− and Bbs6−/− EVs are taken up than control EVs, it suggests that an individual Bbs4−/− or Bbs6−/− EV exerts a stronger Wnt dampening effect (figure created by V.Kretschmer). b Boxplots show median, interquartile range, and maximum and minimum within 1.5 interquartile range. n.s., P > 0.05, *P ≤ 0.05, **P < 0.01, ***P < 0.001.

References

    1. Anvarian Z, Mykytyn K, Mukhopadhyay S, Pedersen LB, Christensen ST. Cellular signalling by primary cilia in development, organ function and disease. Nat. Rev. Nephrol. 2019;15:199–219. doi: 10.1038/s41581-019-0116-9. - DOI - PMC - PubMed
    1. Wheway G, Nazlamova L, Hancock JT. Signaling through the primary cilium. Front. Cell Dev. Biol. 2018;6:8. doi: 10.3389/fcell.2018.00008. - DOI - PMC - PubMed
    1. Satir P, Pedersen LB, Christensen ST. The primary cilium at a glance. J. Cell Sci. 2010;123:499–503. doi: 10.1242/jcs.050377. - DOI - PMC - PubMed
    1. Braun DA, Hildebrandt F. Ciliopathies. Cold Spring Harb. Perspect. Biol. 2017;9:a028191. doi: 10.1101/cshperspect.a028191. - DOI - PMC - PubMed
    1. Forsythe E, Beales PL. Bardet-Biedl syndrome. Eur. J. Hum. Genet. 2013;21:8–13. doi: 10.1038/ejhg.2012.115. - DOI - PMC - PubMed

Publication types

Substances