. 2021 Sep 27;12(1):5668.
doi: 10.1038/s41467-021-25962-0.

Spatial immunophenotypes predict response to anti-PD1 treatment and capture distinct paths of T cell evasion in triple negative breast cancer

Affiliations

Spatial immunophenotypes predict response to anti-PD1 treatment and capture distinct paths of T cell evasion in triple negative breast cancer

Dora Hammerl et al. Nat Commun. .

Abstract

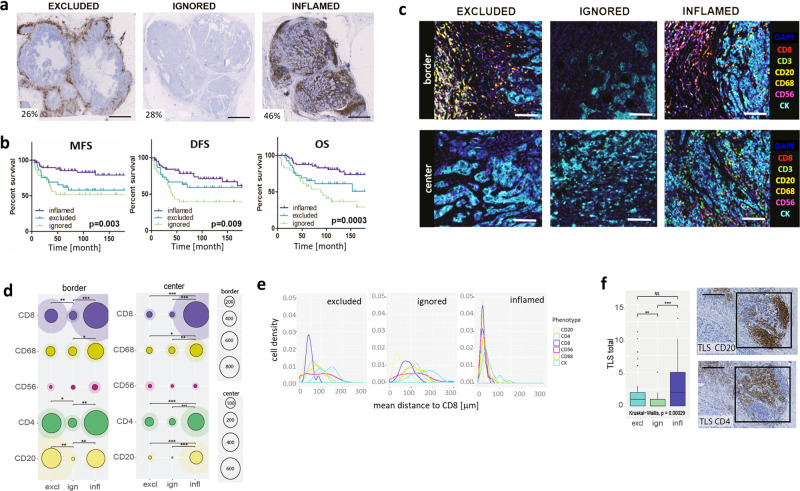
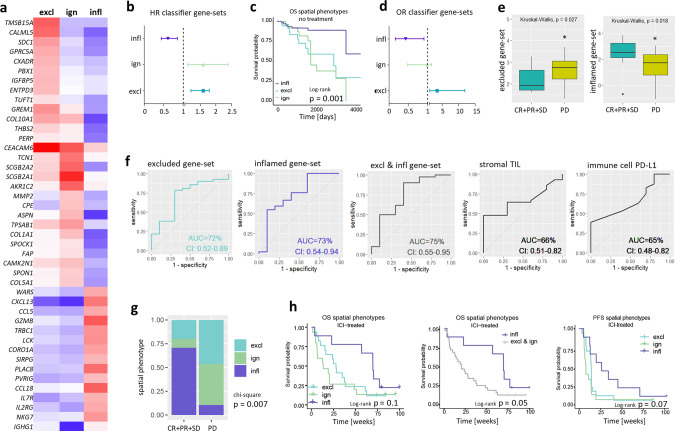
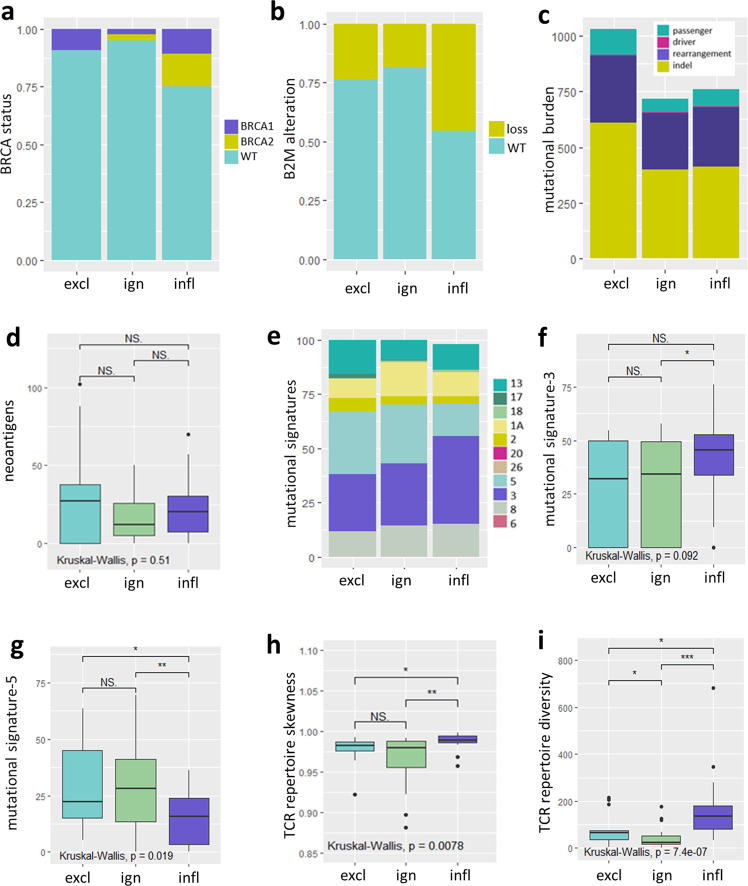
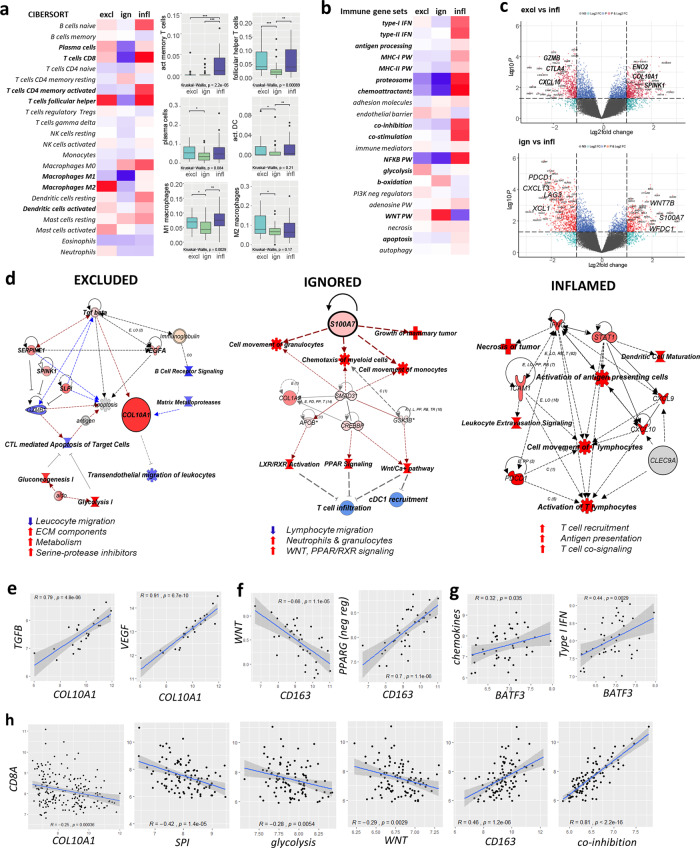
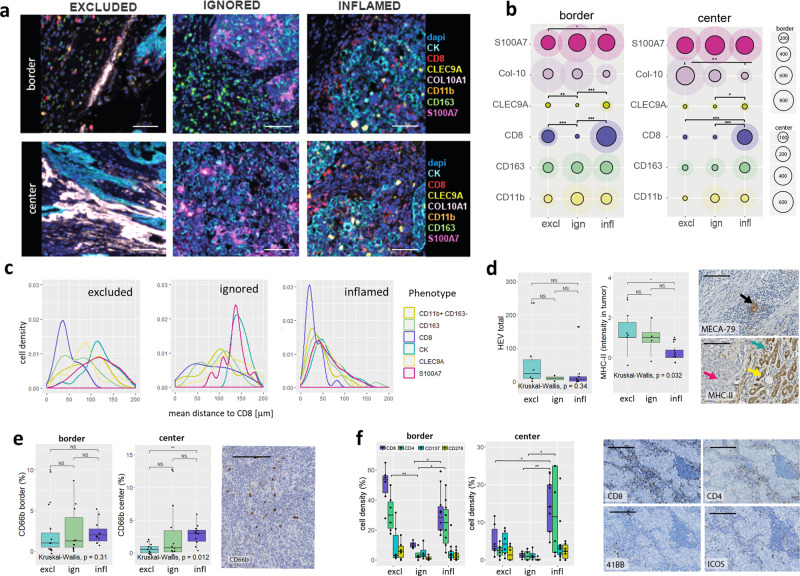
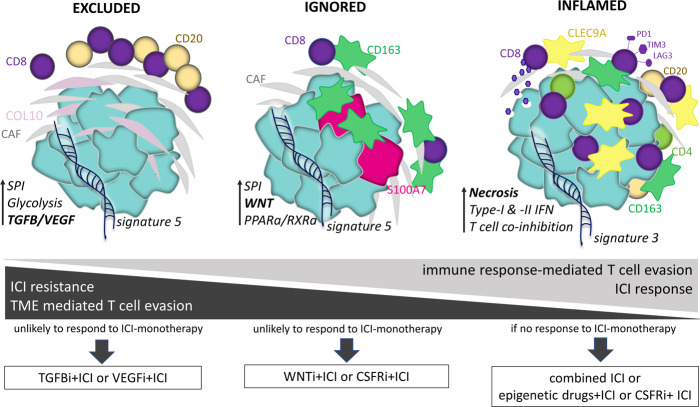
Only a subgroup of triple-negative breast cancer (TNBC) responds to immune checkpoint inhibitors (ICI). To better understand lack of response to ICI, we analyze 681 TNBCs for spatial immune cell contextures in relation to clinical outcomes and pathways of T cell evasion. Excluded, ignored and inflamed phenotypes can be captured by a gene classifier that predicts prognosis of various cancers as well as anti-PD1 response of metastatic TNBC patients in a phase II trial. The excluded phenotype, which is associated with resistance to anti-PD1, demonstrates deposits of collagen-10, enhanced glycolysis, and activation of TGFβ/VEGF pathways; the ignored phenotype, also associated with resistance to anti-PD1, shows either high density of CD163+ myeloid cells or activation of WNT/PPARγ pathways; whereas the inflamed phenotype, which is associated with response to anti-PD1, revealed necrosis, high density of CLEC9A+ dendritic cells, high TCR clonality independent of neo-antigens, and enhanced expression of T cell co-inhibitory receptors.


Conflict of interest statement

The authors declare no competing interests.

Figures

Fig. 1
Fig. 1. Spatial immune contexture is prognostic in TNBC.
a, b Representative whole slide images of CD8+ T cell spatial phenotypes with the percentage of patients per phenotype (scalebar corresponds to 5 mm) (A) and corresponding Kaplan–Meier curves for metastasis-free survival (MFS), disease-free survival (DFS), and overall survival (OS) (B, p values show two-sided log-rank test; time is displayed in months, n = 122 LNN TNBC, of which n = 32 excluded, n = 27 ignored, and n = 61 inflamed). c Representative multiplex IF images of immune effector cells at the tumor border and center of each spatial phenotype (CD8+: red, CD3+: green, CD20+:yellow, CD68+: orange, CD56+: magenta, CK:cyan, DAPI: blue; scalebar corresponds to 50 μm). d Circle plots show mean and SD of immune cell densities (cells/mm2) at border and center for CD8+ (purple), CD68+ (dark yellow), CD56+ (magenta), CD4+ (green), CD20+ (pale yellow), (n = 64 LNN TNBC, of which n = 18 excluded, n = 19 ignored, and n = 27 inflamed). e Histograms show mean distances in μm between CD8+ T cells and CD8+ (purple), CD68+ (dark yellow), CD56+ (magenta), CD4+ (green), CD20+ (pale yellow) CK+ (cyan) cells (x-axis) versus cell densities (cells/mm2, y-axis). f Boxplots show median with 25th–75th percentile, range, and outliers displayed as dots of the total number of tertiary lymphoid structures (TLS, identified by consecutive stainings of CD20+ B cells (top) and CD4+ T cells (bottom), see black squares in images, scalebar corresponds to 100 μm; n = 134 LNN TNBC, of which n = 32 excluded, n = 21 ignored, and n = 61 inflamed). Significant differences are: ***p < 0.001; **p < 0.01; *p < 0.05, NS, p > 0.5 (Kruskal–Wallis, one-sided). Source data are provided within the source data file.
Fig. 2
Fig. 2. Gene classifier assigns spatial phenotypes of CD8+ T cells and stratifies metastasized TNBC patients according to ICI response.
a Heatmap showing median expression of classifier genes per spatial phenotype in the discovery set (red: high expression, blue: low expression; Cohort A1, n = 101 TNBC). b Forestplots showing HRs and CIs (error bars) of classifier gene-sets (Cohort B, n = 196 basal-like BC). c Kaplan–Meier curves of assigned spatial phenotypes in primary TNBC patients (Cohort E, n = 137 TNBC, p-value shows two-sided log-rank test). d Forestplots showing Odds Ratios (OR) and CIs (error bars) for response to anti-PD-1 treatment of classifier gene-sets (Cohort D, TONIC trial, n = 53 metastatic TNBC). e Boxplots displaying the median with 25th–75th percentile and range (outliers are displayed as dots) of the average expression of classifier gene-sets in responding (CR + PR + SD > 24 weeks) and nonresponding (PD) patients (Cohort D, n = 53  metastatic TNBC, of which n = 10 CR + PR + PD, and n = 43 PD). f ROC curves predicting clinical response (PR + CR + SD) with areas under the curve (AUC) and CIs for gene sets of excluded-, inflamed- or a combination of the two phenotypes (average expression of respective gene-sets was used) (first three panels), or for standardly used predictive markers, such as frequency of stromal TILs and PDL1 positivity of immune cells (Cohort D) (last two panels). g Proportions of assigned spatial phenotypes (excluded: cyan, ignored: green and inflamed: purple) in patients with metastatic TNBC responding or not responding to anti-PD-1 treatment (pretreatment biopsies, n = 51) and h corresponding survival curves (Cohort D, p value shows two-sided log-rank test). Source data are provided within the source data file or can be retrieved under controlled access (see ref. for details).
Fig. 3
Fig. 3. Genomic features of spatial phenotypes.
The following parameters were tested for differential presence in spatial phenotypes (determined by the gene-classifier) in TNBC: a BRCA status (proportion, BRCA1: purple, BRCA2: yellow, WT: cyan). b Loss of β2-microglobin (copy number, B2M-loss: yellow, B2M-wt: cyan). c Total number of different types of mutations (passenger mutations: cyan, driver mutations: magenta, structural rearrangements: purple, indels: yellow). d Total number of predicted neo-antigens. e Proportions of most abundant mutational signatures. f, g Frequencies of signatures-3 and 5. h TCR repertoire skewness (based on the gini-simpson index). i Total number of different TCR-Vβ reads. For all above parameters Cohort C (n = 66 TNBC, comprising n = 13 excluded, n = 29 ignored, and n = 24 inflamed) was used, spatial phenotypes were assigned according to the classifier. All boxplots display the median with 25th–75th percentile, range, and outliers are displayed as dots. Significant differences are: ***p < 0.001; **p < 0.01; *p < 0.05, NS, p > 0.5 (Kruskal–Wallis, one-sided). Source data are provided within the source data file.
Fig. 4
Fig. 4. Spatial phenotypes interrogated for immune determinants and evasive pathways.
a Heatmap showing scaled average frequencies of immune cells based on Cibersort deconvolution (red: high, blue: low, immune cell subsets with significant differences among spatial phenotypes are indicated in bold); corresponding boxplots show median with 25th–75th percentile and range (outliers are displayed as dots) of immune cell subsets with differential abundances among spatial phenotypes (n = 101 LNN TNBC, of which n = 24 excluded, n = 33 ignored, and n = 44 inflamed). b Heatmap showing scaled average expression of gene-sets related to T cell evasion (differential gene-sets are indicated in bold). c Volcano plot of differential gene expressions between excluded and inflamed (upper), and ignored and inflamed phenotypes (lower); top DE genes related to T cell evasion are shown in bold. d IPA analyses of cells, molecules, and pathways associated with spatial phenotypes (red: upregulated, blue:downregulated); and lists of major characteristics per spatial phenotype (bottom). e Correlations between expressions of COL10A1 and TGFB- or VEGF-signaling in the excluded phenotype. f Correlations between expressions of CD163 and WNT targets or negative regulators of PPAR genes in the ignored phenotype. g Correlations between the presence of activated dendritic cells (according to BATF3 expression) and expressions of chemokines or type-I IFN genes in the inflamed phenotype. h Correlations between expressions of CD8A and various T cell evasive genes/gene-sets (all phenotypes) (all correlations show regression coefiicients and p values). Significant differences are: ***p < 0.001; **p < 0.01; *p < 0.05, NS, p > 0.05 (Kruskal–Wallis, one-sided). Source data are provided as the source data file.
Fig. 5
Fig. 5. Spatial immunophenotypes are characterized by distinct T cell evasive mechanisms.
a Representative images of cells and molecules related to spatial phenotypes (spatial phenotype panel) at the tumor border and center (CD11b (orange), CD163 (green), CD8 (red), CK (cyan), CLEC9A (yellow), or S100A7 (magenta); scalebar corresponds to 50 μm). b Circle plots show mean and SD of cell densities at border and center regions per mm2 for CD11b (orange), CD163 (green), CD8 (purple), CK (cyan), CLEC9A (yellow), or S100A7 (magenta); Collagen-10 (pink) is displayed as positive tissue area in μm2/100 for visualization purpose (n = 68 TNBC comprising n = 20 excluded, n = 22 ignored, and n = 26 inflamed). c Histograms show mean distances in μm between CD8+ T cells and CD11b (orange), CD163 (green), CD8 (purple), CK (cyan), CLEC9A (yellow), or S100A7 (magenta) (x-axis) versus cell densities (y-axis) (n = 68 TNBC of which n = 20 excluded, n = 22 ignored, and n = 26 inflamed). d Boxplots show median with 25th–75th percentile and range (outliers are displayed as dots) of numbers of high endothelial venules (HEV, identified via MECA-79 staining, black arrow) and MHC-II expression of tumor cells for excluded (cyan), ignored (green), and inflamed (purple) TNBC (no distinction between border and center, pink arrow: tumor cells; yellow arrow: adjacent normal breast lobules; green arrow: immune cells, scalebar corresponds to 100 μm, n = 20 TNBC, of which n = 6 excluded, n = 4 ignored, and n = 10 inflamed). e Boxplots show median with 25th–75th percentile and range (outliers are displayed as dots) of neutrophil densities (CD66b+) at border and center for excluded (cyan), ignored (green), and inflamed (purple) TNBC and the representative image is shown, scalebar corresponds to 100 μm, (n = 32 TNBC, of which =11 excluded, n = 10 ignored, and n = 11 inflamed). f Boxplots show median with 25th–75th percentile and range (outliers are displayed as dots) of numbers of different T cell markers stained on consecutive slides, and representative images (CD8 (purple), CD4 (green), 41BB (cyan), and ICOS (yellow); scalebar corresponds to 100 μm, n = 20 TNBC, of which n = 6 excluded, n = 4 ignored, and n = 10 inflamed). Significant differences are: ***p < 0.001; **p < 0.01; *p < 0.05, NS, p > 0.05 (Kruskal–Wallis, one-sided). Source data are provided within source data file.
Fig. 6
Fig. 6. Illustration of immune contextures per spatial phenotype in relation to paths of T cell evasion as well as response to ICI.
Distinctive and dominant pathways (in bold), when targeted in an immunophenotype-specific manner (in boxes), would sensitize TNBC to ICI (see Discussion section for details).

References

    1. Hammerl D, et al. Breast cancer genomics and immuno-oncological markers to guide immune therapies. Semin. Cancer Biol. 2018;52:178–188. doi: 10.1016/j.semcancer.2017.11.003. - DOI - PubMed
    1. Kwa MJ, Adams S. Checkpoint inhibitors in triple-negative breast cancer (TNBC): Where to go from here. Cancer. 2018;124:2086–2103. doi: 10.1002/cncr.31272. - DOI - PubMed
    1. Schmid P, et al. Atezolizumab plus nab-paclitaxel as first-line treatment for unresectable, locally advanced or metastatic triple-negative breast cancer (IMpassion130): updated efficacy results from a randomised, double-blind, placebo-controlled, phase 3 trial. Lancet Oncol. 2020;21:44–59. doi: 10.1016/S1470-2045(19)30689-8. - DOI - PubMed
    1. Schmid P, et al. Pembrolizumab for early triple-negative. Breast Cancer N. Engl. J. Med. 2020;382:810–821. doi: 10.1056/NEJMoa1910549. - DOI - PubMed
    1. Savas P, Loi S. Expanding the role for immunotherapy in triple-negative breast cancer. Cancer Cell. 2020;37:623–624. doi: 10.1016/j.ccell.2020.04.007. - DOI - PubMed

Publication types

MeSH terms