Meta-Analysis
. 2021 Sep 27;4(1):1132.
doi: 10.1038/s42003-021-02642-9.

Genetic variants associated with platelet count are predictive of human disease and physiological markers

Affiliations
Meta-Analysis

Genetic variants associated with platelet count are predictive of human disease and physiological markers

Evgenia Mikaelsdottir et al. Commun Biol. .

Abstract

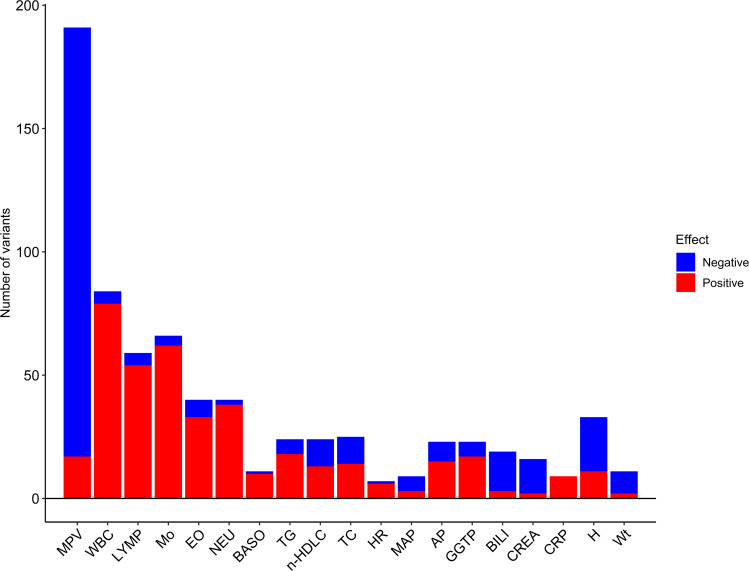
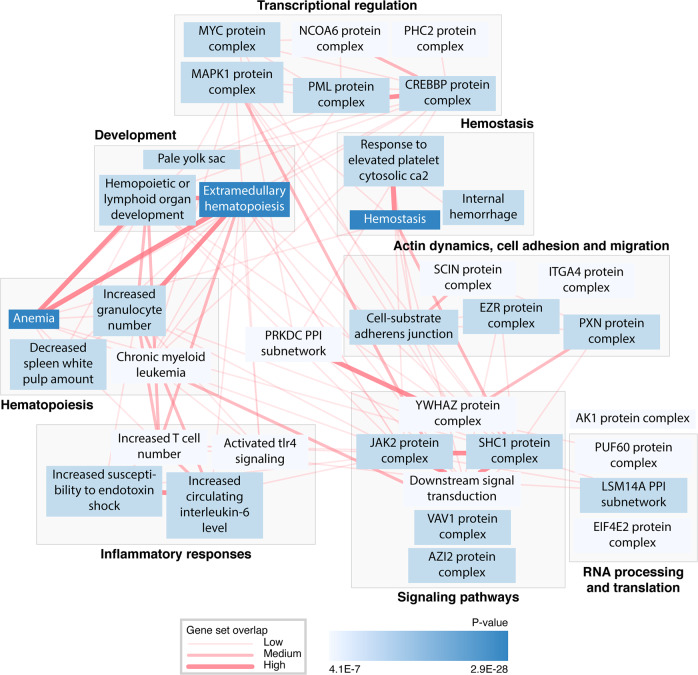
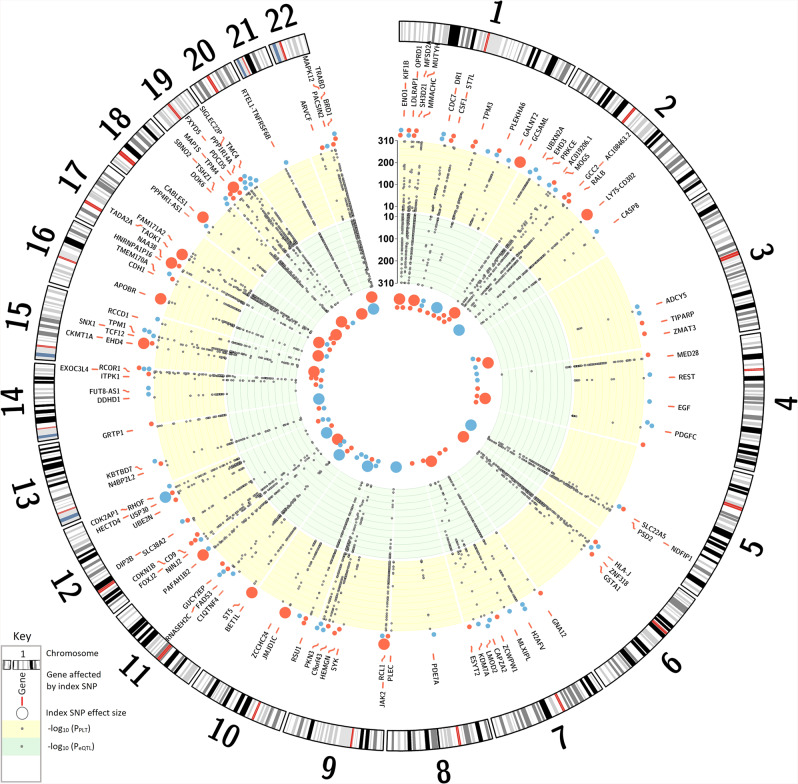
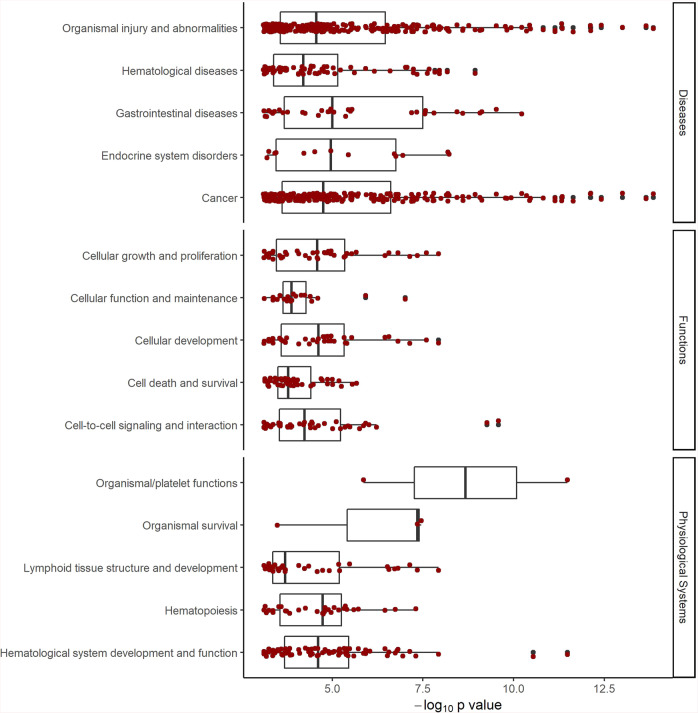
Platelets play an important role in hemostasis and other aspects of vascular biology. We conducted a meta-analysis of platelet count GWAS using data on 536,974 Europeans and identified 577 independent associations. To search for mechanisms through which these variants affect platelets, we applied cis-expression quantitative trait locus, DEPICT and IPA analyses and assessed genetic sharing between platelet count and various traits using polygenic risk scoring. We found genetic sharing between platelet count and counts of other blood cells (except red blood cells), in addition to several other quantitative traits, including markers of cardiovascular, liver and kidney functions, height, and weight. Platelet count polygenic risk score was predictive of myeloproliferative neoplasms, rheumatoid arthritis, ankylosing spondylitis, hypertension, and benign prostate hyperplasia. Taken together, these results advance understanding of diverse aspects of platelet biology and how they affect biological processes in health and disease.


Conflict of interest statement

E. Mikaelsdottir, G. Thorleifsson, L. Stefansdottir, G. Halldorsson, J.K. Sigurdsson, S.H. Lund, V. Tragante, P. Melsted, S. Rognvaldsson, K. Norland, A. Helgadottir, M. K. Magnusson, J. Gudmundsson, H. Holm, S. Saevarsdottir, I. Jonsdottir, G. Thorgeirsson, D.F. Gudbjartsson, U. Thorsteinsdottir, T. Rafnar, and K. Stefansson, who are affiliated with deCODE genetics/Amgen, declare competing financial interests as employees. The remaining authors declare no competing financial interests. There are no non-financial competing interests to declare.

Figures

Fig. 1
Fig. 1. Overview of association of the PLT variants with other quantitative traits.
Data are presented with respect to the PLT increasing allele. Significance criteria: P value ≤ 3.6 × 10−6 (“Methods”). For details on associations, see Supplementary Data 6. AP alkaline phosphatase, BASO basophil count, BILI total bilirubin, CREA serum creatinine, CRP C-reactive protein, EO eosinophil count, GGTP gamma-glutamyl transpeptidase, H height, HR heart rate, LYMP lymphocyte count, MAP mean arterial pressure, Mo monocyte count, MPV mean platelet volume, n-HDLC non-HDL cholesterol, NEU neutrophil count, TC total cholesterol, TG triglycerides, WBC white blood cell count, Wt weight.
Fig. 2
Fig. 2. A network of gene sets identified in the DEPICT analyses.
Gene sets from the gene set enrichment analysis were clustered according to their most relevant biological functions. Only the topmost gene sets of the clusters with eight or more significant gene sets are presented (significance criteria: P value ≤ 3.46 × 10−6). Connecting lines represent gene set overlap if Pearson correlation > 0.3, with thicker lines indicating higher correlation. For detailed information on gene sets, clusters, and Pearson correlation between the sets, see Supplementary Data 13 and 14.
Fig. 3
Fig. 3. The PLT variants affecting gene expression.
The Circular Manhattan plot shows genes identified in the cis-eQTL analyses whose expression is affected by the PLT variants (Supplementary Data 15). Only PLT variants affecting the expression of these genes are presented in the plot (Supplementary Data 2, Note ƚ). For variants, which affect expression of more than one gene, only the gene representing the strongest cis-eQTL (the largest effect size) is shown. Effector alleles are the same as in Supplementary Data 2. The yellow band: −log10 of P value for association of the variants with PLT. Dots outside the yellow band represent the genetic effect sizes of the index PLT SNPs, with the blue dot color indicating PLT decrease and the red representing PLT increase (see Supplementary Data 2 for details). The green band: −log10 of P value for association of the variants with cis-eQTLs. eQTL effects are shown as colored dots inside the green band. The dot size represents the effect size, and the color indicates the effect direction, where red is increase and blue is a decrease of gene expression. For scaling purposes, both PLT and cis-eQTL effects are expressed in standard deviation.
Fig. 4
Fig. 4. Association with diseases, molecular functions, and physiologic systems.
The 284 candidate causal PLT genes (Supplementary Data 16) were analyzed for association with diseases, molecular functions, and physiologic systems, using the Ingenuity Pathway Analysis (see “Methods”). Shown are P values of the identified associations along with median and interquartile ranges for each group (boxplots). Dark red dots represent individual associations, and black dots indicate outliers. For details on associations, see Supplementary Data 17.

References

    1. Mancuso ME, Santagostino E. Platelets: much more than bricks in a breached wall. Br. J. Haematol. 2017;178:209–219. doi: 10.1111/bjh.14653. - DOI - PubMed
    1. Daly ME. Determinants of platelet count in humans. Haematologica. 2011;96:10–13. doi: 10.3324/haematol.2010.035287. - DOI - PMC - PubMed
    1. Johnson B, Fletcher SJ, Morgan NV. Inherited thrombocytopenia: novel insights into megakaryocyte maturation, proplatelet formation and platelet lifespan. Platelets. 2016;27:519–525. doi: 10.3109/09537104.2016.1148806. - DOI - PMC - PubMed
    1. Lopez JA, Andrews RK, Afshar-Kharghan V, Berndt MC. Bernard-Soulier syndrome. Blood. 1998;91:4397–4418. doi: 10.1182/blood.V91.12.4397. - DOI - PubMed
    1. Hong WJ, Gotlib J. Hereditary erythrocytosis, thrombocytosis and neutrophilia. Best Pract. Res. Clin. Haematol. 2014;27:95–106. doi: 10.1016/j.beha.2014.07.002. - DOI - PubMed

Publication types