. 2021 Oct;6(10):1309-1318.
doi: 10.1038/s41564-021-00966-0. Epub 2021 Sep 27.

Precise quantification of bacterial strains after fecal microbiota transplantation delineates long-term engraftment and explains outcomes

Affiliations

Precise quantification of bacterial strains after fecal microbiota transplantation delineates long-term engraftment and explains outcomes

Varun Aggarwala et al. Nat Microbiol. 2021 Oct.

Erratum in

Abstract

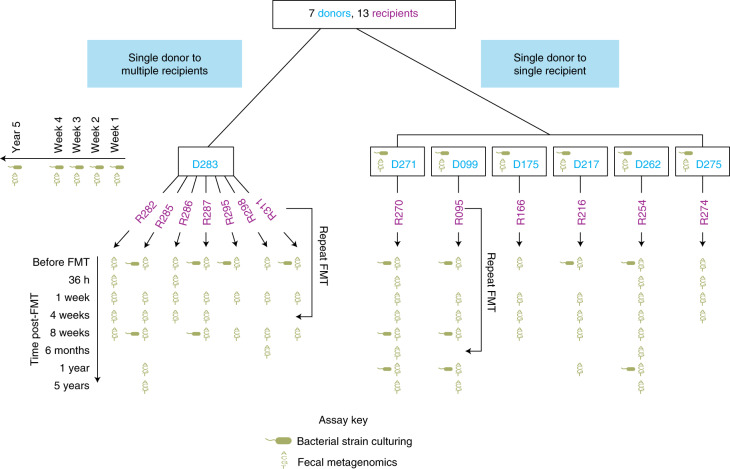
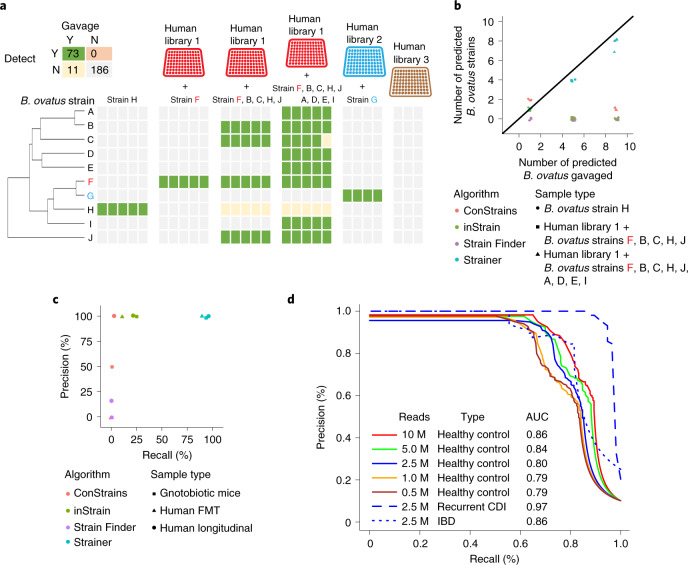
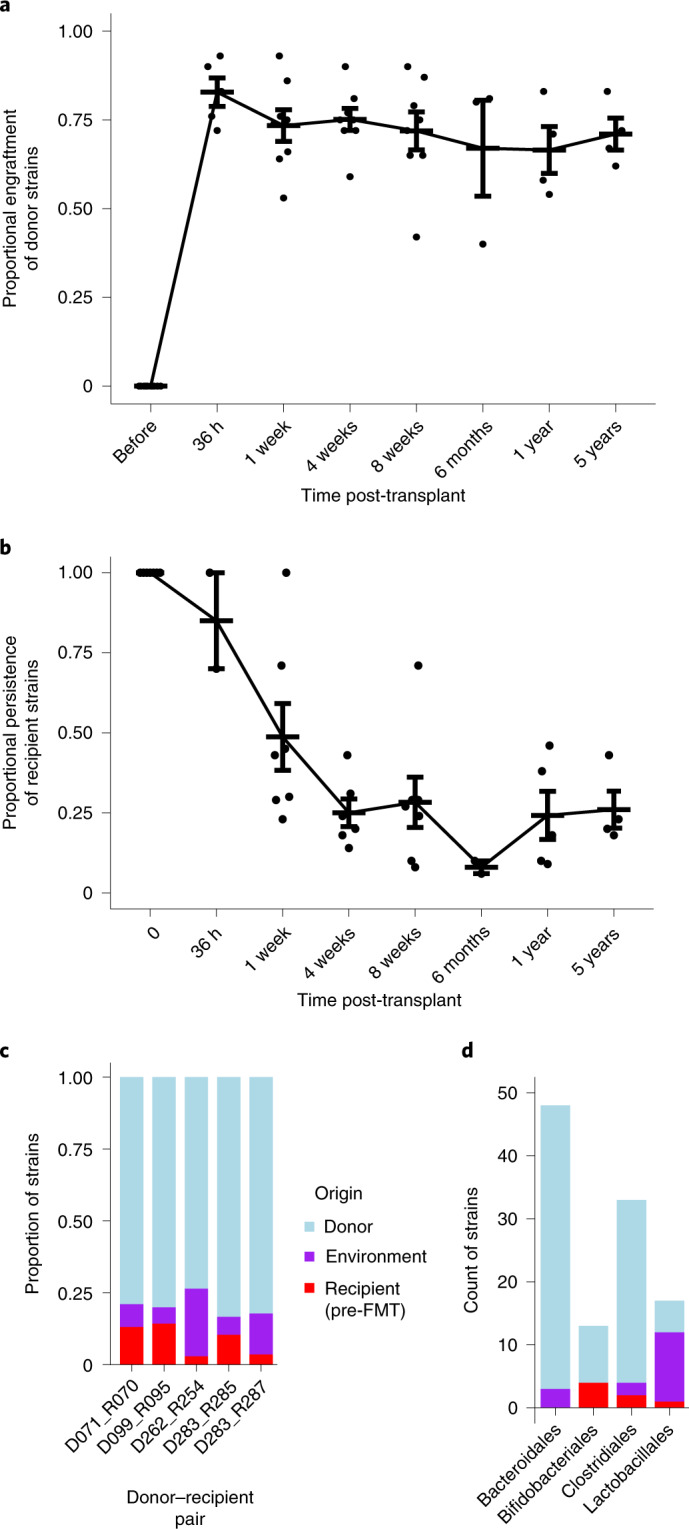
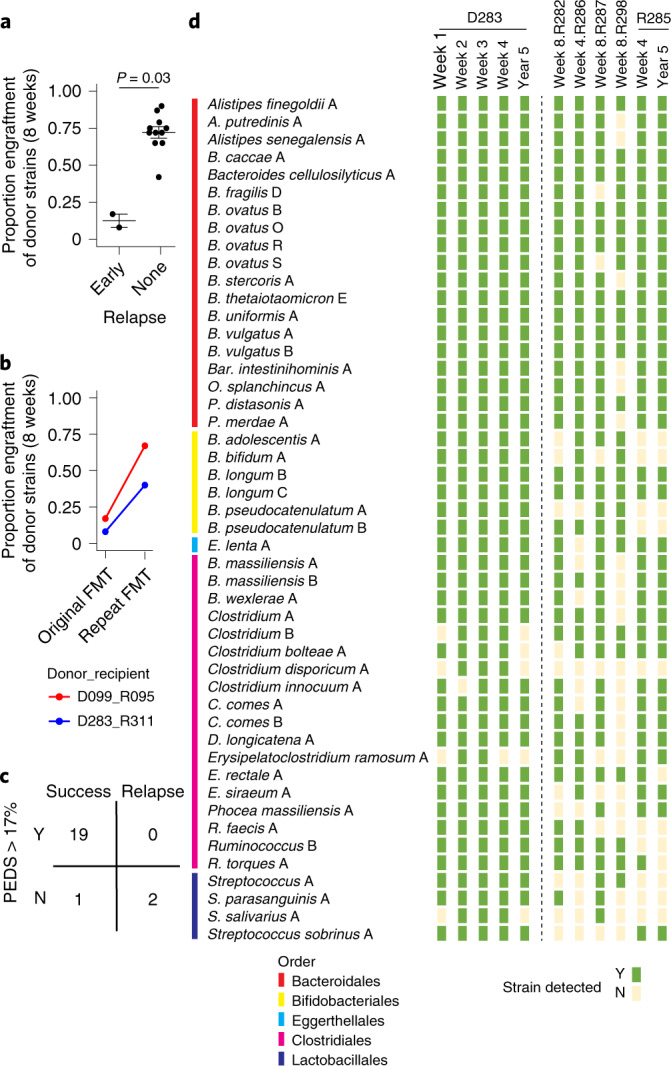
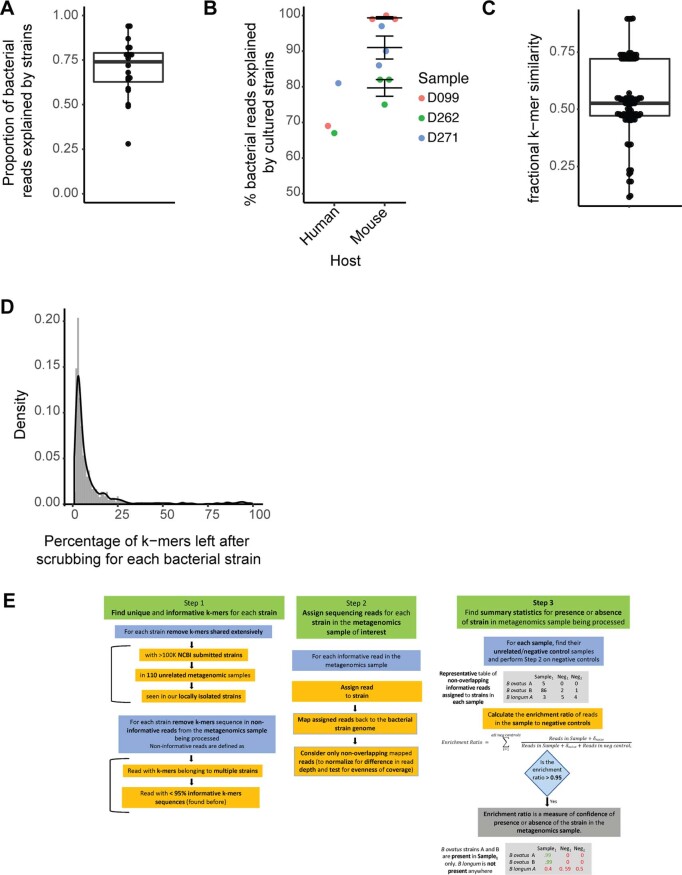
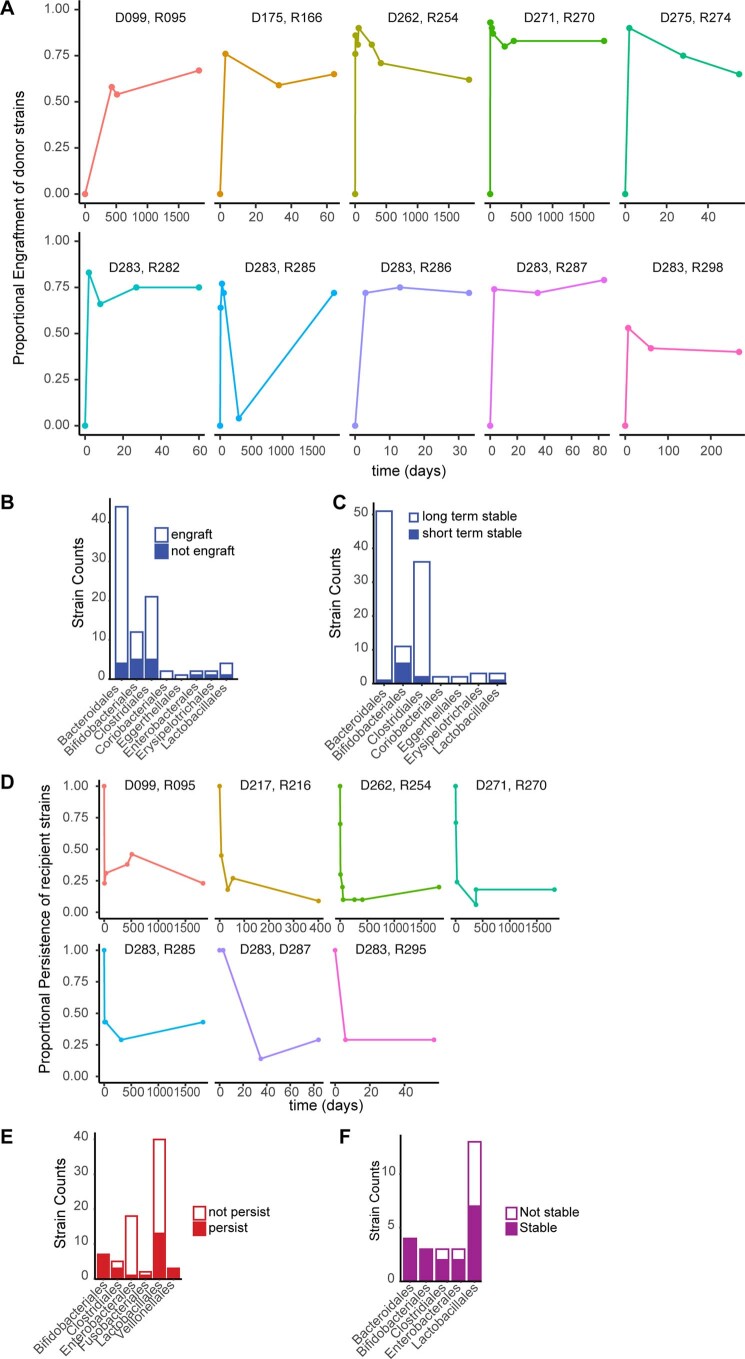
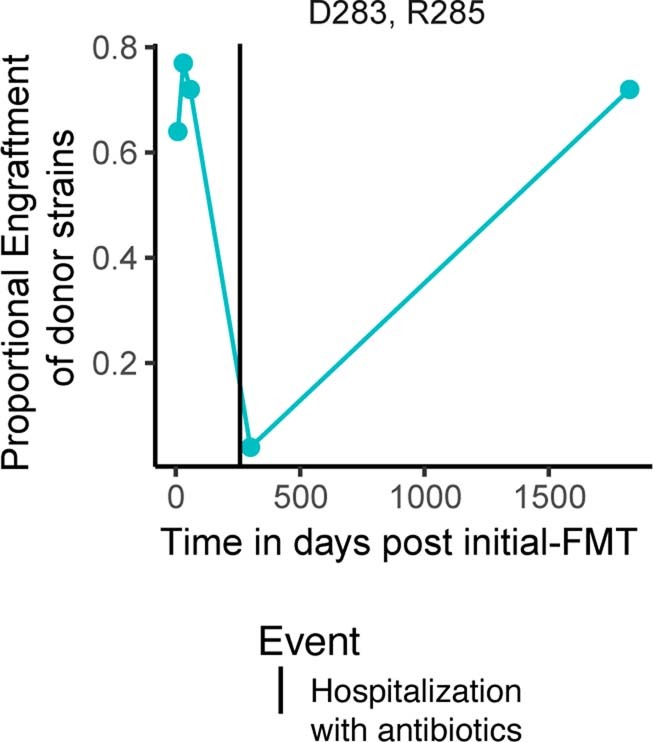
Fecal microbiota transplantation (FMT) has been successfully applied to treat recurrent Clostridium difficile infection in humans, but a precise method to measure which bacterial strains stably engraft in recipients and evaluate their association with clinical outcomes is lacking. We assembled a collection of >1,000 different bacterial strains that were cultured from the fecal samples of 22 FMT donors and recipients. Using our strain collection combined with metagenomic sequencing data from the same samples, we developed a statistical approach named Strainer for the detection and tracking of bacterial strains from metagenomic sequencing data. We applied Strainer to evaluate a cohort of 13 FMT longitudinal clinical interventions and detected stable engraftment of 71% of donor microbiota strains in recipients up to 5 years post-FMT. We found that 80% of recipient gut bacterial strains pre-FMT were eliminated by FMT and that post-FMT the strains present persisted up to 5 years later, together with environmentally acquired strains. Quantification of donor bacterial strain engraftment in recipients independently explained (precision 100%, recall 95%) the clinical outcomes (relapse or success) after initial and repeat FMT. We report a compendium of bacterial species and strains that consistently engraft in recipients over time that could be used in defined live biotherapeutic products as an alternative to FMT. Our analytical framework and Strainer can be applied to systematically evaluate either FMT or defined live bacterial therapeutic studies by quantification of strain engraftment in recipients.


Conflict of interest statement

J.F. is on the scientific advisory board of Vedanta Biosciences, reports receiving research grants from Janssen Pharmaceuticals and reports receiving consulting fees from Innovation Pharmaceuticals, Janssen Pharmaceuticals, BiomX and Vedanta Biosciences. J.-F.C. reports receiving research grants from AbbVie, Janssen Pharmaceuticals and Takeda, receiving payment for lectures from AbbVie, Amgen, Allergan, Bristol Myers Squibb, Ferring Pharmaceuticals, Shire and Takeda, receiving consulting fees from AbbVie, Amgen, Arena Pharmaceuticals, Boehringer Ingelheim, Bristol Myers Squibb, Celgene Corporation, Celltrion Healthcare, Eli Lilly, Enterome, Ferring Pharmaceuticals, Geneva Pharmaceuticals, Genentech, Gilead, Iterative Scopes, Ipsen, Imedex, Immunic, Inotrem, Janssen Pharmaceuticals, Landos, LimmaTech Biologics AG, Medimmune, Merck, Novartis, O Mass, Otsuka Pharmaceutical, Pfizer, Shire, Takeda, TiGenix and Viela Bio and holds stock options in Intestinal Biotech Development. D.G. is an employee of Janssen Research and Development. The other authors declare no competing interests. A patent has been filed on this work (Patent Cooperation Treaty application PCT/US21/71018, filed 27 July 2021).

Figures

Fig. 1
Fig. 1. Overview of the FMT study design.
Overview of the FMT study design including donors, recipients and time points when metagenomic sequencing and bacterial strain culturing was performed on fecal samples.
Fig. 2
Fig. 2. Strainer accurately detects bacterial strains in gut communities.
a, Strainer can resolve B. ovatus strain(s) from other closely related strains in gnotobiotic mice. Each column represents an independent germ-free mouse gavaged with the specific B. ovatus strain(s) with or without a diverse human gut bacterial culture library of strains. Strains F and G were contained in human culture libraries 1 and 2, respectively. Human culture library 3 contained no B. ovatus, while the remaining B. ovatus isolates were isolated from other human fecal samples. The green box indicates that the strain was introduced in the mice and detected in metagenomics (true positive); grey indicates that the strain was not detected (true negative); orange indicates the strain was detected but was not introduced (false positive); yellow indicates that the strain was not detected but was gavaged in the mice (unknown since gavaging a strain does not always lead to stable colonization). b, Performance of the SNP-based inference strain detection algorithms ConStrains, Strain Finder, inStrain and our Strainer approach on detecting the number of B. ovatus strain(s) in gnotobiotic mice. c, Precision–recall curves to assess the performance of SNP-based inference strain tracking approaches and Strainer on real datasets ranging from sequential gavaging of a defined set of strains in gnotobiotic mice, FMT donor recipient pairs and tracking strain stability in a healthy individual over time. d, Performance assessment of Strainer’s ability to match strains to the metagenome of the sample from which they were isolated. The solid lines denote the results at different sequencing depths after application of our algorithm on 261 strains isolated from healthy controls. Blue indicates the sequencing depth of 2.5 million (M) reads, while the dashed line indicates the result after application of Strainer on 56 strains isolated from patients with recurrent CDI. The dotted curve is for 54 strains from patients with IBD. The AUC of the precision–recall curves is shown in the figure. Source data
Fig. 3
Fig. 3. FMT strain dynamics in recipients for up to 5 years.
a, Strains from the donor (n = 6 biologically independent samples) remained stably engrafted in successful post-FMT patients (n = 13 biologically independent samples) for at least 5 years after transplant. Data at each time point are presented as mean values ± s.e.m. b, Strains isolated from a recipient (n = 7 biologically independent samples) before FMT were rapidly lost with a small proportion persisting at longer timescales. Data at each time point are presented as mean values ± s.e.m. c, Proportion of donor, recipient and environmental strains detected in patients post-FMT. Environmental strains are non-donor and non-recipient (before FMT) in origin, which are both cultured and metagenomically detected post-FMT. d, Count of strains detected in patients post-FMT subclassified by major phylogenetic taxa (at order level) and coloured based on their origin. Source data
Fig. 4
Fig. 4. Donor engraftment explains recurrent CDI FMT clinical outcomes.
a, PEDS at 8 weeks can predict early relapse of FMT in patients (n = 13 biologically independent samples) with recurrent CDI. A two-sided Wilcoxon test was used to estimate statistical significance. b, The PEDS metric can elucidate the successful outcome of repeat FMT in patients who relapsed with recurrent CDI after the initial FMT. c, Predictive power of our approach on all available FMT samples where clinical evaluation was independently noted. Whenever we reported clinical success we found engraftment to be above the threshold of 17% (n = 19 true positives) with 1 false negative. Clinical relapse was always independently associated with low engraftment (n = 2 true negatives) with no false negatives. d, Bacterial strain engraftment and identification of highly transmissible strains that stably engraft in multiple recipients. The first four columns are weekly metagenomic samples from the donor, while the fifth column is the donor sample from five years later. The next six columns are from the FMT recipients who did not have an early relapse. The last column is from one of the recipients five years later. Strainer was used to find the presence (green) or absence (yellow) of each bacterial strain from the corresponding metagenomics sample. Source data
Extended Data Fig. 1
Extended Data Fig. 1. Comprehensiveness of our cultured bacterial strain library and algorithm Strainer.
a, Proportion of bacterial reads in the metagenomics sample that are explained by the genome sequences of the cultured strain library for that sample (n = 20 biologically independent samples). Each point in the plot corresponds to a separate sample. The lower and upper bounds of the box in the boxplot corresponds to 25th and 75th percentile respectively, with the median line in centre. Upper whisker extends till the maxima, while the lower whisker extends till 1.5 times the inter-quartile range. Points beyond this lower limit are also plotted. b, Proportion of bacterial reads explained by the cultured strain library for a donor after gavaging (n = 3 independent replicates) germ-free mice with stool from (n = 3) corresponding human donors, and performing metagenomics on the mouse faecal samples. Each point corresponds to a separate sample. Data for mouse replicates for each different donor sample is presented as mean values ± SEM. c, Percentage similarity between (n = 96) different isolates of species Bacteriodes ovatus and the reference strain AAXF00000000.2. Similarity is found by comparing sequence k-mers of length 31 between genomes. Each point in the boxplot corresponds to a separate sample. The lower and upper bounds of the box in the boxplot corresponds to 25th and 75th percentile respectively, with the median line in centre. Upper whisker extends till the maxima, while the lower whisker extends till the minima. d, Proportion of bacterial reads in the metagenomics sample that are explained by the genome sequences of the cultured strain library for that sample. Each point in the boxplot corresponds to a separate sample. e, Overview of our algorithm Strainer. The algorithm has 3 modules, where Module-1 involves finding the unique and likely informative sequence k-mers for each strain by removing those shared extensively with unrelated sequenced strains in NCBI, unrelated metagenomics samples, and those cultured and sequenced in this study. Next, we decompose each sequencing read in the metagenomics sample of interest into its k-mers, and find reads which have k-mers belonging to multiple strains, or have <95% of informative k-mers for a single strain. We further remove these non-informative k-mers from our previous set. In Module-2 we assign sequencing reads from the metagenomics sample of interest, with a majority of informative k-mers (>95%) to each strain. Next, we map these reads to the genome of the corresponding strain, and consider the non-overlapping ones only. This step normalizes for sequencing depth across samples and checks for evenness of read distribution across the bacterial genome. Finally, in Module-3 we compare the read enrichment in a sample to unrelated samples or negative controls and present summary statistics for presence or absence of a strain in a sample. Source data
Extended Data Fig. 2
Extended Data Fig. 2. FMT strain dynamics (donor, pre-FMT recipient and environmental strains) in recipients post-FMT.
a, Trajectory of proportional strain engraftment of donor strains in each recipient at all available timepoints (in days). The donor recipient pair ids are at the top of each plot. b, Number of strains that transmit and engraft for at least 8-weeks in patients post-FMT (single FMT donor to recipient setting) grouped by taxonomic order. c, The number of strains colonized at 8 weeks (short term) that engraft for at least 6-months or more (long-term) in patients post-FMT (both single FMT donor to single and multiple recipients setting) grouped by taxonomic order. d, Trajectory of proportional persistence of recipient’s strains post-FMT at all available timepoints (in days). The donor recipient pair ids are at the top of each plot. e, The number of the recipient’s original strains that persist for at least 8-weeks post-FMT, grouped by taxonomic order. f, The number of environment strains (that is non-donor and non-recipient in origin) that engraft in patients stably over multiple timepoints (>1 week) post-FMT, grouped by taxonomic order. Source data
Extended Data Fig. 3
Extended Data Fig. 3. Clinical implications.
Engraftment of donor D283 strains in recipient R285, which did not relapse but rather had a temporary loss in detectability of the donor strains during antibiotic treatment for severe diarrhoea. Source data

References

    1. Ooijevaar RE, Terveer EM, Verspaget HW, Kuijper EJ, Keller JJ. Clinical application and potential of fecal microbiota transplantation. Annu. Rev. Med. 2019;70:335–351. doi: 10.1146/annurev-med-111717-122956. - DOI - PubMed
    1. van Nood E, Dijkgraaf MGW, Keller JJ. Duodenal infusion of feces for recurrent Clostridium difficile. N. Engl. J. Med. 2013;368:2145. doi: 10.1056/NEJMoa1205037. - DOI - PubMed
    1. Kelly CR, et al. Effect of fecal microbiota transplantation on recurrence in multiply recurrent Clostridium difficile infection a randomized trial. Ann. Intern. Med. 2016;165:609–616. doi: 10.7326/M16-0271. - DOI - PMC - PubMed
    1. Smillie CS, et al. Strain tracking reveals the determinants of bacterial engraftment in the human gut following fecal microbiota transplantation. Cell Host Microbe. 2018;23:229–240.e5. doi: 10.1016/j.chom.2018.01.003. - DOI - PMC - PubMed
    1. Li SS, et al. Durable coexistence of donor and recipient strains after fecal microbiota transplantation. Science. 2016;352:586–589. doi: 10.1126/science.aad8852. - DOI - PubMed

Publication types