

Corporate immunity to the COVID-19 pandemic
- PMID: 34580557
- PMCID: PMC8457922
- DOI: 10.1016/j.jfineco.2021.03.005
Corporate immunity to the COVID-19 pandemic
Abstract
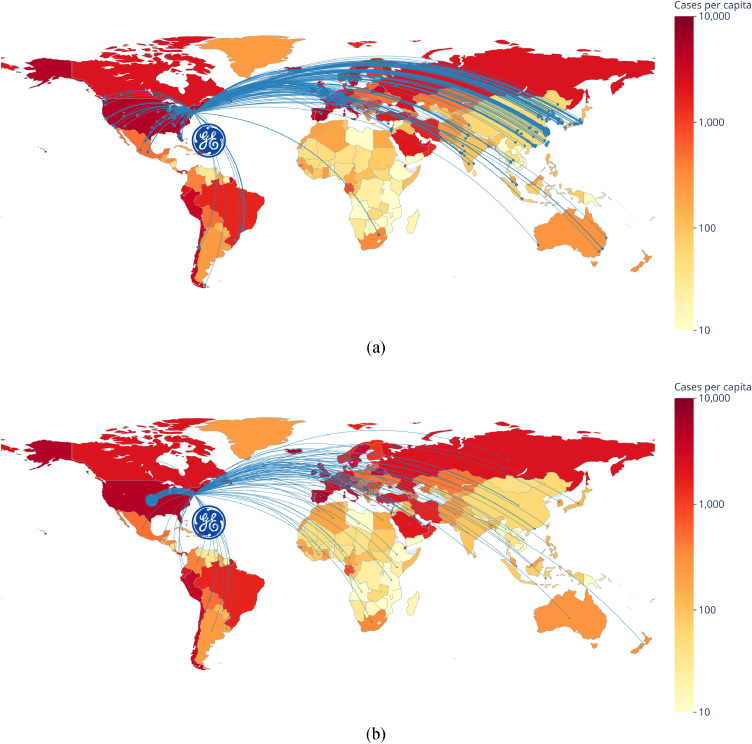
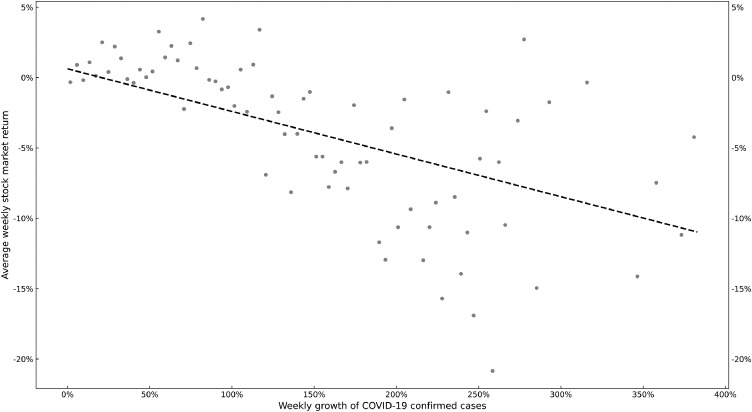
We evaluate the connection between corporate characteristics and the reaction of stock returns to COVID-19 cases using data on more than 6,700 firms across 61 economies. The pandemic-induced drop in stock returns was milder among firms with stronger pre-2020 finances (more cash and undrawn credit, less total and short-term debt, and larger profits), less exposure to COVID-19 through global supply chains and customer locations, more corporate social responsibility activities, and less entrenched executives. Furthermore, the stock returns of firms controlled by families (especially through direct holdings and with non-family managers), large corporations, and governments performed better, and those with greater ownership by hedge funds and other asset management companies performed worse. Stock markets positively price small amounts of managerial ownership but negatively price high levels of managerial ownership during the pandemic.
Keywords: CSR; Corporate governance; Corporate resilience; Financial risk; Supply chain.
© 2021 Elsevier B.V. All rights reserved.
Figures
Similar articles
-
Can corporate social responsibility protect firm value during the COVID-19 pandemic?Int J Hosp Manag. 2021 Feb;93:102759. doi: 10.1016/j.ijhm.2020.102759. Epub 2020 Nov 11. Int J Hosp Manag. 2021. PMID: 36919172 Free PMC article.
-
Firms' COVID-19 Pandemic Exposure and Corporate Cash Policy: Evidence from China.Econ Model. 2022 Nov;116:105999. doi: 10.1016/j.econmod.2022.105999. Epub 2022 Aug 21. Econ Model. 2022. PMID: 36032988 Free PMC article.
-
Returnee Executives, Corporate Social Responsibility, and Stock Price Synchronicity.Front Psychol. 2022 Jul 13;13:950436. doi: 10.3389/fpsyg.2022.950436. eCollection 2022. Front Psychol. 2022. PMID: 35911051 Free PMC article.
-
Effects of corporate social responsibility and governance on its credit ratings.ScientificWorldJournal. 2014;2014:305452. doi: 10.1155/2014/305452. Epub 2014 Oct 27. ScientificWorldJournal. 2014. PMID: 25401134 Free PMC article. Review.
-
Corporate social responsibility and financial profile of Spanish private hospitals.Heliyon. 2019 Oct 11;5(10):e02623. doi: 10.1016/j.heliyon.2019.e02623. eCollection 2019 Oct. Heliyon. 2019. PMID: 31667425 Free PMC article. Review.
Cited by
-
Sustainable mutual fund performance and flow in the recent years through the COVID-19 pandemic.Int Rev Financ Anal. 2022 Nov;84:102387. doi: 10.1016/j.irfa.2022.102387. Epub 2022 Oct 14. Int Rev Financ Anal. 2022. PMID: 36267474 Free PMC article.
-
Corporate payout, cash holdings, and the COVID-19 crisis: Evidence from the G-7 countries.Financ Res Lett. 2022 Dec;50:103275. doi: 10.1016/j.frl.2022.103275. Epub 2022 Aug 24. Financ Res Lett. 2022. PMID: 36034341 Free PMC article.
-
International taxation sentiment and COVID-19 crisis.Res Int Bus Finance. 2022 Dec;63:101783. doi: 10.1016/j.ribaf.2022.101783. Epub 2022 Oct 7. Res Int Bus Finance. 2022. PMID: 36250041 Free PMC article.
-
COVID-19 challenges and firm responses: Analysis of a city-wide census in a developing country.MDE Manage Decis Econ. 2022 Sep;43(6):2184-2195. doi: 10.1002/mde.3517. Epub 2022 Jan 5. MDE Manage Decis Econ. 2022. PMID: 35465151 Free PMC article.
-
Corporate immunity, national culture and stock returns: Startups amid the COVID-19 pandemic.Int Rev Financ Anal. 2022 Jan;79:101975. doi: 10.1016/j.irfa.2021.101975. Epub 2021 Nov 11. Int Rev Financ Anal. 2022. PMID: 36530769 Free PMC article.
References
-
- Acemoglu D., Carvalho V.M., Ozdaglar A., Tahbaz-Salehi A. The network origins of aggregate fluctuations. Econometrica. 2012;80:1977–2016.
-
- Acemoglu D., Ozdaglar A., Tahbaz-Salehi A. Microeconomic origins of macroeconomic tail risks. Am. Econ. Rev. 2017;107:54–108.
-
- Acharya V.V., Almeida H., Campello M. Is cash negative debt? A hedging perspective on corporate financial policies. J. Financ. Intermed. 2007;16:515–554.
-
- Acharya V.V., Steffen S. The risk of being a fallen angel and the corporate dash for cash in the midst of COVID. Rev. Corp. Financ. Stud. 2020;9:430–471.
-
- Adams R.B., Hermalin B.E., Weisbach M.S. The role of boards of directors in corporate governance: a conceptual framework and survey. J. Econ. Lit. 2010;48:58–107.
LinkOut - more resources
Full Text Sources