. 2021 Oct 29;374(6567):eabj3624.
doi: 10.1126/science.abj3624. Epub 2021 Oct 29.

A prenylated dsRNA sensor protects against severe COVID-19

Affiliations

A prenylated dsRNA sensor protects against severe COVID-19

Arthur Wickenhagen et al. Science. .

Abstract

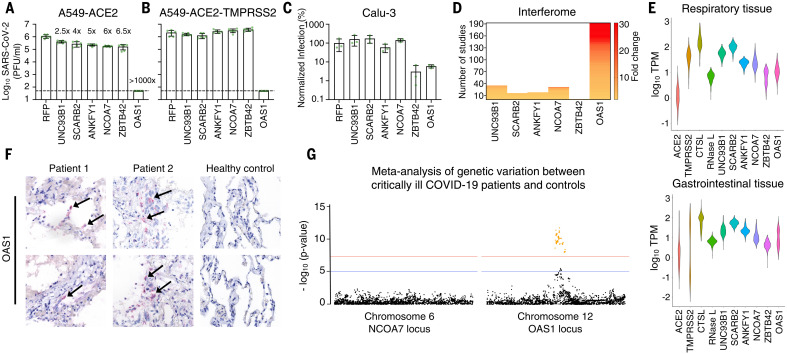
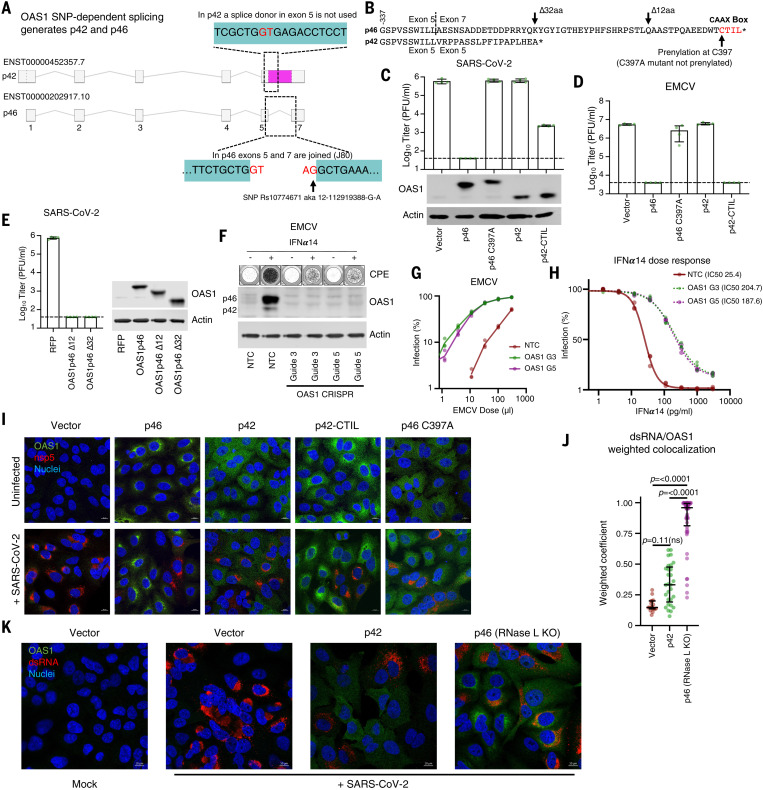
Inherited genetic factors can influence the severity of COVID-19, but the molecular explanation underpinning a genetic association is often unclear. Intracellular antiviral defenses can inhibit the replication of viruses and reduce disease severity. To better understand the antiviral defenses relevant to COVID-19, we used interferon-stimulated gene (ISG) expression screening to reveal that 2′-5′-oligoadenylate synthetase 1 (OAS1), through ribonuclease L, potently inhibits severe acute respiratory syndrome coronavirus 2 (SARS-CoV-2). We show that a common splice-acceptor single-nucleotide polymorphism (Rs10774671) governs whether patients express prenylated OAS1 isoforms that are membrane-associated and sense-specific regions of SARS-CoV-2 RNAs or if they only express cytosolic, nonprenylated OAS1 that does not efficiently detect SARS-CoV-2. In hospitalized patients, expression of prenylated OAS1 was associated with protection from severe COVID-19, suggesting that this antiviral defense is a major component of a protective antiviral response.


Figures

None
Location, location, location, and dsRNA sensing.
A common genetic polymorphism determines whether people make a membrane-associated form of OAS1, a dsRNA sensor. Prenylation targets OAS1 to sites rich in viral dsRNA. Once in the correct place, OAS1 senses dsRNA structures in the SARS-CoV-2 5′-UTR and initiates a potent block to SARS-CoV-2 replication. OAS1 based on PDB ID 4IG8.
Fig. 1.
Fig. 1.. Arrayed ISG expression screening reveals factors with candidate anti–SARS-CoV-2 activity.
(A) A549-Npro-ACE2 cells were transduced with hundreds of individual human or macaque ISGs (see fig. S1, C to E) and infected with SARS-CoV-2-EGFP (Wuhan-1) in duplicate, and the level of infection in the presence of each ISG was measured using flow cytometry at 14 and 40 hours postinfection (hpi). (B) Miniscreen of the ability of human candidate effectors identified in (A) alongside controls to inhibit SARS-CoV-2 in A549 and A549-Npro at 14 and 40 hpi (the equivalent panel for macaque ISGs presented in fig. S1L). (C and D) The ability of each human and macaque effector to either stimulate ISRE activity using A549-ISRE-EGFP cells (C) or cause toxicity (CytoTox-Glo) using supernatant from the same A549-ISRE-EGFP cells (D) at 48 hours after transduction with the relevant ISG-encoding lentiviral vector. The dashed line indicates threshold for negative selection.
Fig. 2.
Fig. 2.. The ISG OAS1 initiates a block to SARS-CoV-2 replication.
(A and B) SARS-CoV-2 isolate CVR-GLA-1 infectious titers (PFU/ml) were determined using A549-ACE2 (A) or A549-ACE2-TMPRSS2 cells (B) modified to express the candidate effectors (UNC93B1, SCARB2, ANKFY1, NCOA7, ZBTB42, or OAS1) from the screening pipeline (Fig. 1, A to D). Fold protection from SARS-CoV-2 is indicated for each gene in (A). (C) SARS-CoV-2-ZsGreen infectious titers on Calu-3 cells expressing the same hit ISGs as in (A) and (B), measured by flow cytometry at 40 hpi. (D) The “ISG-ness” of selected genes was assessed by fold change upon type I IFN stimulation as reported in studies in the Interferome v2.01 database (http://www.interferome.org/). (E) Gene expression analysis across different respiratory and gastrointestinal tissues using datasets from the GTEx database, with ACE2 and TMPRSS2 included for reference. RNase L is included as functionally linked to OAS1. (F) Detection of OAS1 gene expression by RNAscope in FFPE lung tissue of deceased COVID-19 patients compared with healthy control lung tissue. Arrows indicate staining of positive cells. (G) Meta-analysis of the COVID-19 Host Genetics Initiative (https://www.covid19hg.org/) for genetic variation between critical ill COVID-19 patients and control populations at the gene locus of the NCOA7 and OAS1 genes. The red line indicates the threshold for significant SNPs (yellow dots).
Fig. 3.
Fig. 3.. OAS1 inhibition of SARS-CoV-2 is specific and mediated through the RNase L pathway.
(A) Normalized infection in the presence of OAS1 at early or late stages of the viral life cycle, quantified in large-scale ISG expression screens (similar to Fig. 1) for a panel of viruses (described in arrayed ISG expression screening methods). (B) AAT cells were modified to express OAS1 and OAS3 and protein expression (OAS1, OAS3, and RNase L) in the cell lines, which was monitored using Western blotting. (C) The titers of SARS-CoV-2, VSV and EMCV were determined (PFU/ml) in the presence of each ISG in the cell lines characterized in (B). (D) SARS-CoV-2 replication (well clearance at 72 hpi due to cytopathic effects of virus replication) was assessed in AAT cells that were modified to express exogenous OAS1, and the OAS3 expression of which was reduced using seven different lentiviral vector-derived CRISPR guides and one NTC. The level of OAS3 KO was assessed by Western blotting, and a typical virus-induced CPE is shown. (E) SARS-CoV-2 infectious titer (PFU/ml) on HT1080-ACE2-TMPRSS2 (HAT) cells expressing RFP or OAS1. (F) Protein expression (OAS3, OAS2, and OAS1) in HAT cells in the presence and absence of pretreatment with 1000 pg/ml IFNα14, monitored by Western blotting. (G) SARS-CoV-2 replication (well clearance at 72 hpi due to cytopathic effects of virus replication) was assessed in cells with RNase L expression that was reduced using seven different lentiviral vector-derived CRIPSR guides and one NTC. The level of RNase L KO was assessed by Western blotting, and a typical virus-induced CPE is shown. (H) SARS-CoV-2 infectious titer (PFU/ml) on AAT cells expressing RFP or OAS1 was determined in the presence and absence of pretreatment with 100 U/ml IFNα14 and/or 0.5 μM ruxolitinib. (I) iCLIP2 analysis of OAS1 binding sites on SARS-CoV-2 RNA. Coverage of three replicate tracks overlaid mapped to the SARS-CoV-2 genome in the OAS1-IP and an SMI allow detection of OAS1-binding sites shown in red above the SARS-CoV-2 genome annotation. (J) Transcriptome-wide profiling of OAS1 iCLIP2 targets by gene biotypes in SARS-CoV-2 or mock infected cells. Pie charts indicate distribution of OAS1-binding sites within each transcript feature of protein-coding genes. (K) Detailed representation of OAS1 iCLIP2 targets in noncoding RNA biotypes between SARS-CoV-2 and mock infected samples. (L) Motif prediction of OAS1-binding sites in cellular transcripts using MEME or HOMER. Presence of these predicted binding motifs in the SL1 and SL2 loops of the 5′-UTR of SARS-CoV-2 (37). (M) AAT cells were modified to express RFP or OAS1. The infectious titer of SARS-CoV-2 B.1.1.7 and EMCV on these cells was determined by plaque assay. Similarly, titers of RSV-GFP and PIV3-GFP were determined using flow cytometry (24 hpi). Titers of influenza A viruses (IAV/H1N1/PR8 and IAV/H1N1/Mallard) were determined using an immunostained focus-forming assay.
Fig. 4.
Fig. 4.. OAS1 isoforms have differential antiviral activity as determined by C-terminal prenylation.
(A) Schematic representation of OAS1 splicing resulting in isoforms p42 and p46. The area shaded in pink is exonic in p42 and intronic in p46. (B) Protein sequence alignment of the p46 and p42 isoforms, indicating the CAAX box prenylation signal in p46 and locations of modifications made in this work. (C) SARS-CoV-2 infectious titer (PFU/ml) on AAT cells expressing the OAS1 isoforms p46, not prenylated p46 (p46 C397A), p42 or prenylated p42 (p42CTIL) or a vector control. Protein expression analysis of the levels of isoforms and mutants is shown by Western blot. (D) EMCV infectious titer on the cells from (B) as determined by plaque assay (PFU/ml). (E) SARS-CoV-2 infectious titer (PFU/ml) on AAT cells expressing OAS1 p46 or the p46 C-terminal truncations OAS1 p46 ∆12 and OAS1 p46 ∆32. The level of expression is shown by Western blotting. (F) EMCV replication in HAT cells with reduced OAS1 expression using two different lentiviral vector-derived CRISPR guides and one NTC guide. Well clearance at 24 hpi was assessed in the presence or absence of pretreatment with 1000 pg/ml IFNα14 (typical wells are shown in the top panel), and the level of OAS1 KO was assessed by Western blotting. (G) EMCV infectious virus titration (based on percentage well clearance) in HAT cells in which OAS1 expression was reduced using two different OAS1 KO guides compared with a NTC. (H) EMCV infection (percentage well clearance) after pretreatment of various doses of IFNα14 in same cells as in (G). (I) Representative immunofluorescence on cells from (C) infected with SARS-CoV-2 isolate CVR-GLA-1 at MOI 0.5 for 24 hours, followed by staining with anti-OAS1 (green) and anti–SARS-CoV-2-nsp5 (red) antibodies, and nuclear Hoechst stain (blue). Contrast was reduced in the p46 sample to prevent oversaturation in the green channel caused by particularly strong perinuclear concentration. Representative cells from one out of three independently performed experiments are depicted. (J) Quantification of colocalization of dsRNA with OAS1 (weighted colocalization coefficient) in infected cells represented in (K). Each data point represents a distinct region of interest encompassing an individual cell from one representative experiment. (K) Representative immunofluorescence on AAT cells modified with a vector control, OAS1 p42, or OAS1 p46 in the presence of RNase L KO, infected or mock treated with SARS-CoV-2 isolate GLA-1 at MOI 0.5 for 24 hours, followed by staining with anti-OAS1 (green) and anti-dsRNA (red) antibodies and nuclear Hoechst stain (blue). Representative cells from one out of two independently performed experiments are depicted.
Fig. 5.
Fig. 5.. Prenylated OAS1 protects against severe COVID-19.
(A) Allelic frequencies of the most common circulating p46 variants of OAS1 displayed by region. (B) Infectious titers of SARS-CoV-2 CVR-GLA-1 (PFU/ml) were determined on AAT cells modified to express each human p46 OAS1 variant. OAS1 expression was monitored using Western blotting (lower panels). (C) Frequency of alleles with G at Rs10774671 in different human populations (1000 Genomes Project). The population names are expanded in the materials and methods. (D) Transcript abundance of the p46 isoform (encoding prenylated OAS1), determined using JunctionSeq analysis (J080) of RNA-seq data from whole blood from infected patients with mild (hospitalized but not ICU admitted) or severe or lethal (ICU admitted and/or death) COVID-19. (E) Transcript abundance of the p42 isoform (E037) determined as in (E). For (D) and (E), significance was determined using a Mann–Whitney U test except where multiple comparisons were made [(E), right], and then a Kruskal-Wallis rank sum test was used. All four comparisons not highlighted were significant (P < 0.0001). (F) Prenylation status (p46-negative or p46-positive) determined by the presence or absence of p46 transcript from (D) in mild and severe COVID-19. (G) Tabulated ORs and 95% CIs of the data presented in (D) and (F). (H) SARS-CoV-2 infectious titer on AAT cells expressing the OAS1 isoforms p46 or p46 and p42. Isoform expression level (Western blot) is also shown.
Fig. 6.
Fig. 6.. Retrotransposition at the OAS1 locus has ablated the CAAX-box prenylation signal in Rhinolophoidea.
(A) Infectious titers of OC43 (PFU/ml) were determined on AAT cells modified to express OAS1 from humans (H.s p46). (B) Infectious titers of SARS-CoV-2 CVR-GLA-1 (8) (PFU/ml) were determined on AAT cells modified to express Oas1a from mouse (M. musculus), OAS proteins from cows (B. taurus), and human p46 (H.s p46). OAS1 expression was monitored by Western blotting (lower panels). (C) Infectious titers of SARS-CoV-2 (PFU/ml) were determined on AAT cells modified to express OAS1 from Pipistrellus bats (P. khulii), dromedary camels (C. dromedarius), and human p46 (H.s p46). OAS1 expression was monitored by Western blotting. (D) Schematic of genome synteny between the human OAS1 exon 7 locus (yellow) and the R. ferrumequinum genome. The exact syntenic sequence coordinates are annotated for the start of OAS1 exon 7, the start of the CAAX box encoding sequence, and the start of the upstream gene locus, OAS3 (blue). Transposable element hits on the 580-bp nonsyntenic region in the R. ferrumequinum genome are shown in the enlarged inset. Noncoding regions are shown in black. Note that the schematic is not to scale. (E) Dated phylogeny (retrieved from TimeTree; www.timetree.org) (101) of bat species with a confirmed LTR insertion in the OAS1 locus or a CAAX box–encoding sequence present in the same scaffold as their OAS1 locus. Clades are labeled by superfamily, species names, and CAAX sequence (or LTR) are annotated next to the tree tips. The approximate time period during which the LTR insertion took place is annotated in red. (F) Infectious titers of SARS-CoV-2 CVR-GLA-1 (PFU/ml) were determined on AAT cells modified to express OAS1 from humans (H.s p46) and horseshoe bats (R.f) using both NCBI and Ensembl database entries. OAS1 expression was monitored by Western blotting. (G) Pie charts of CoVs from Rhinolophoidea and Vespertilionoidea binned according to whether they are known or predicted to encode a PDE OAS antagonist. (H) Infectious titers of SARS-CoV-2 (PFU/ml) were determined on AAT cells modified to express OAS1 from the black fruit bat (P. alecto). OAS1 expression was monitored by Western blotting. (I) Infectious titers of SARS-CoV (PFU/ml) were determined on AAT cells modified to express human OAS1 p42 or p46.

Comment in

References

    1. Pairo-Castineira E., Clohisey S., Klaric L., Bretherick A. D., Rawlik K., Pasko D., Walker S., Parkinson N., Fourman M. H., Russell C. D., Furniss J., Richmond A., Gountouna E., Wrobel N., Harrison D., Wang B., Wu Y., Meynert A., Griffiths F., Oosthuyzen W., Kousathanas A., Moutsianas L., Yang Z., Zhai R., Zheng C., Grimes G., Beale R., Millar J., Shih B., Keating S., Zechner M., Haley C., Porteous D. J., Hayward C., Yang J., Knight J., Summers C., Shankar-Hari M., Klenerman P., Turtle L., Ho A., Moore S. C., Hinds C., Horby P., Nichol A., Maslove D., Ling L., McAuley D., Montgomery H., Walsh T., Pereira A. C., Renieri A., Shen X., Ponting C. P., Fawkes A., Tenesa A., Caulfield M., Scott R., Rowan K., Murphy L., Openshaw P. J. M., Semple M. G., Law A., Vitart V., Wilson J. F., Baillie J. K.; GenOMICC Investigators; ISARIC4C Investigators; COVID-19 Human Genetics Initiative; 23andMe Investigators; BRACOVID Investigators; Gen-COVID Investigators , Genetic mechanisms of critical illness in COVID-19. Nature 591, 92–98 (2021). 10.1038/s41586-020-03065-y - DOI - PubMed
    1. Bastard P., Rosen L. B., Zhang Q., Michailidis E., Hoffmann H.-H., Zhang Y., Dorgham K., Philippot Q., Rosain J., Béziat V., Manry J., Shaw E., Haljasmägi L., Peterson P., Lorenzo L., Bizien L., Trouillet-Assant S., Dobbs K., de Jesus A. A., Belot A., Kallaste A., Catherinot E., Tandjaoui-Lambiotte Y., Le Pen J., Kerner G., Bigio B., Seeleuthner Y., Yang R., Bolze A., Spaan A. N., Delmonte O. M., Abers M. S., Aiuti A., Casari G., Lampasona V., Piemonti L., Ciceri F., Bilguvar K., Lifton R. P., Vasse M., Smadja D. M., Migaud M., Hadjadj J., Terrier B., Duffy D., Quintana-Murci L., van de Beek D., Roussel L., Vinh D. C., Tangye S. G., Haerynck F., Dalmau D., Martinez-Picado J., Brodin P., Nussenzweig M. C., Boisson-Dupuis S., Rodríguez-Gallego C., Vogt G., Mogensen T. H., Oler A. J., Gu J., Burbelo P. D., Cohen J. I., Biondi A., Bettini L. R., D’Angio M., Bonfanti P., Rossignol P., Mayaux J., Rieux-Laucat F., Husebye E. S., Fusco F., Ursini M. V., Imberti L., Sottini A., Paghera S., Quiros-Roldan E., Rossi C., Castagnoli R., Montagna D., Licari A., Marseglia G. L., Duval X., Ghosn J., Tsang J. S., Goldbach-Mansky R., Kisand K., Lionakis M. S., Puel A., Zhang S.-Y., Holland S. M., Gorochov G., Jouanguy E., Rice C. M., Cobat A., Notarangelo L. D., Abel L., Su H. C., Casanova J.-L.; HGID Lab; NIAID-USUHS Immune Response to COVID Group; COVID Clinicians; COVID-STORM Clinicians; Imagine COVID Group; French COVID Cohort Study Group; Milieu Intérieur Consortium; CoV-Contact Cohort; Amsterdam UMC Covid-19 Biobank; COVID Human Genetic Effort , Autoantibodies against type I IFNs in patients with life-threatening COVID-19. Science 370, eabd4585 (2020). 10.1126/science.abd4585 - DOI - PMC - PubMed
    1. Monk P. D., Marsden R. J., Tear V. J., Brookes J., Batten T. N., Mankowski M., Gabbay F. J., Davies D. E., Holgate S. T., Ho L.-P., Clark T., Djukanovic R., Wilkinson T. M. A.; Inhaled Interferon Beta COVID-19 Study Group , Safety and efficacy of inhaled nebulised interferon beta-1a (SNG001) for treatment of SARS-CoV-2 infection: A randomised, double-blind, placebo-controlled, phase 2 trial. Lancet Respir. Med. 9, 196–206 (2021). 10.1016/S2213-2600(20)30511-7 - DOI - PMC - PubMed
    1. Channappanavar R., Fehr A. R., Vijay R., Mack M., Zhao J., Meyerholz D. K., Perlman S., Dysregulated type I interferon and inflammatory monocyte-macrophage responses cause lethal pneumonia in SARS-CoV-infected mice. Cell Host Microbe 19, 181–193 (2016). 10.1016/j.chom.2016.01.007 - DOI - PMC - PubMed
    1. Kane M., Zang T. M., Rihn S. J., Zhang F., Kueck T., Alim M., Schoggins J., Rice C. M., Wilson S. J., Bieniasz P. D., Identification of interferon-stimulated genes with antiretroviral activity. Cell Host Microbe 20, 392–405 (2016). 10.1016/j.chom.2016.08.005 - DOI - PMC - PubMed

Publication types

MeSH terms

Grants and funding