. 2021 Nov 1;220(11):e202006033.
doi: 10.1083/jcb.202006033. Epub 2021 Sep 28.

LPHN2 inhibits vascular permeability by differential control of endothelial cell adhesion

Affiliations

LPHN2 inhibits vascular permeability by differential control of endothelial cell adhesion

Chiara Camillo et al. J Cell Biol. .

Abstract

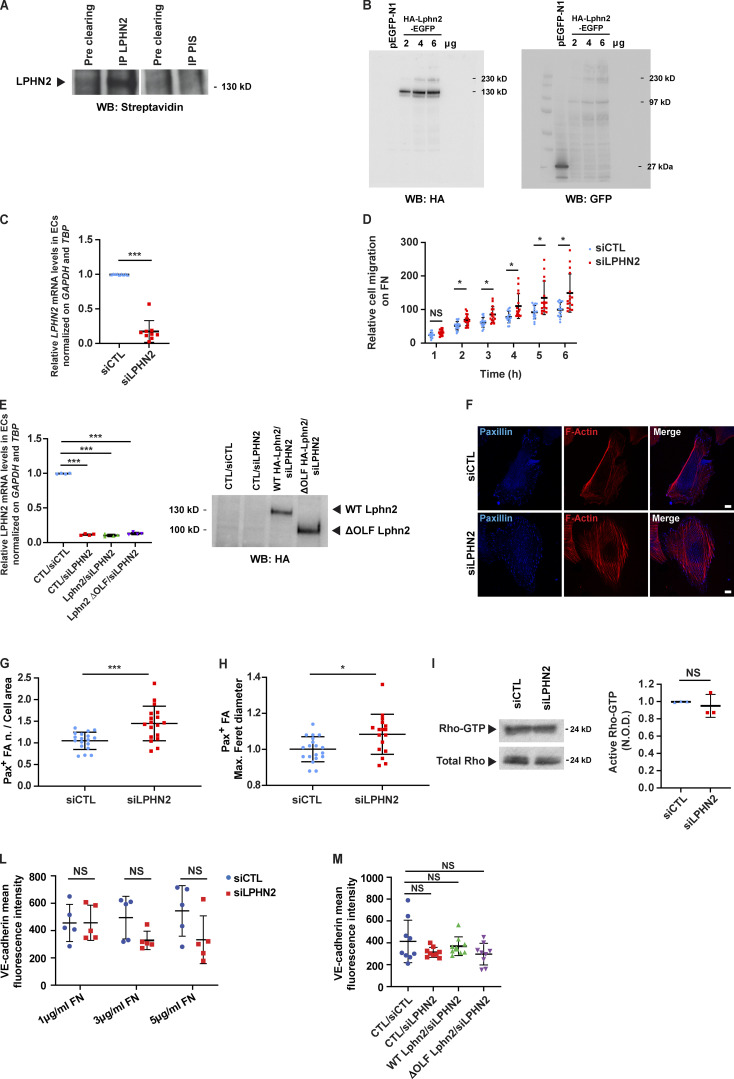
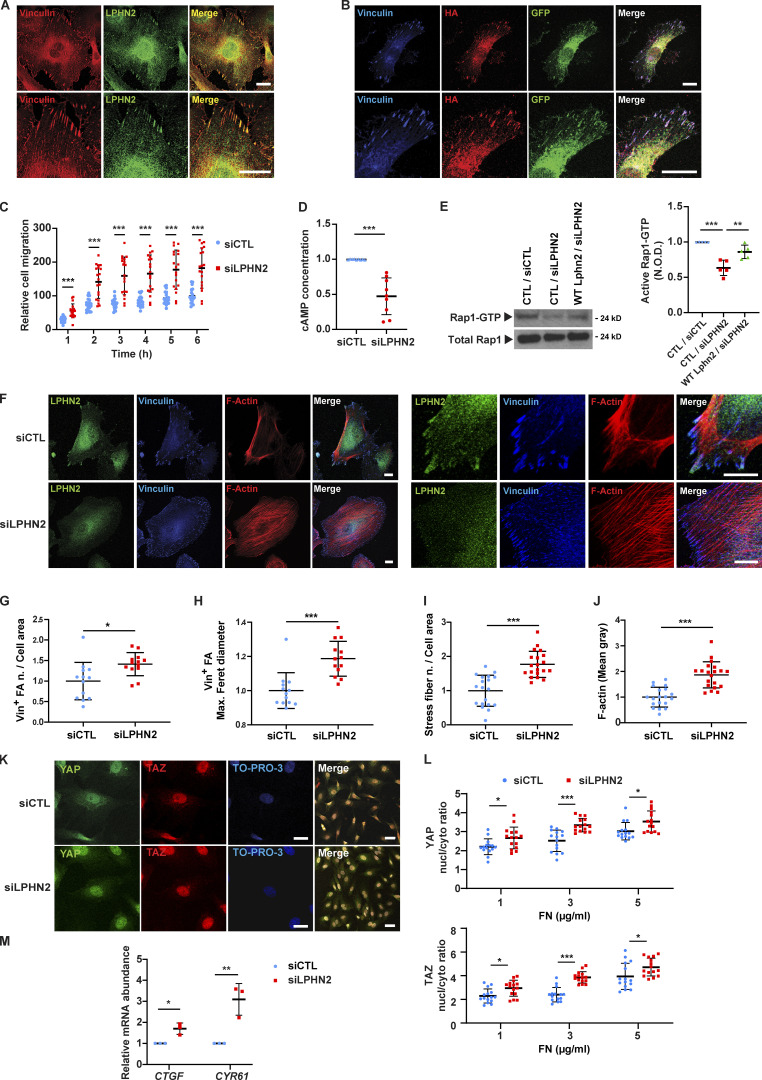
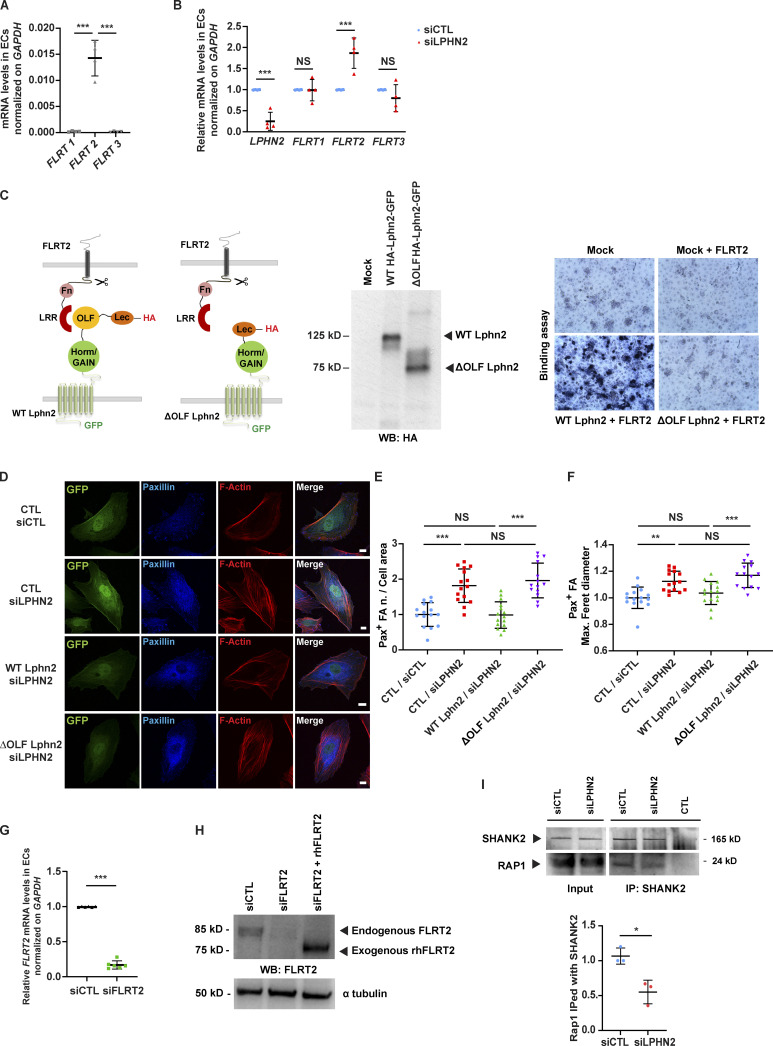
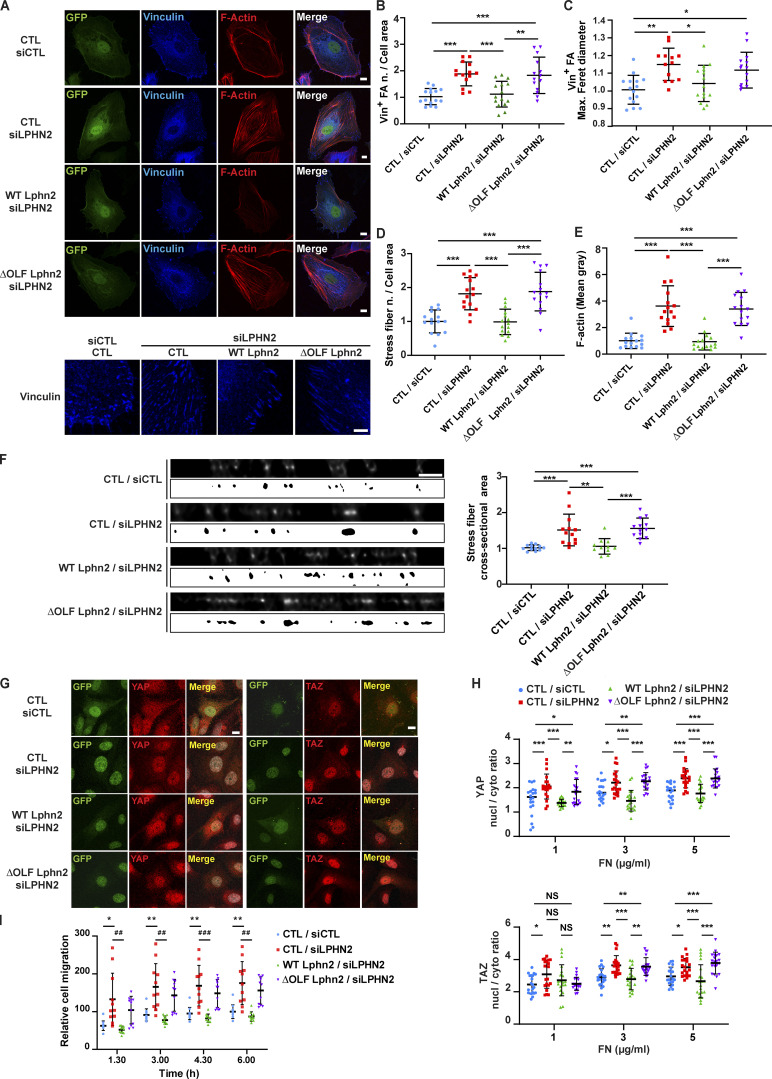
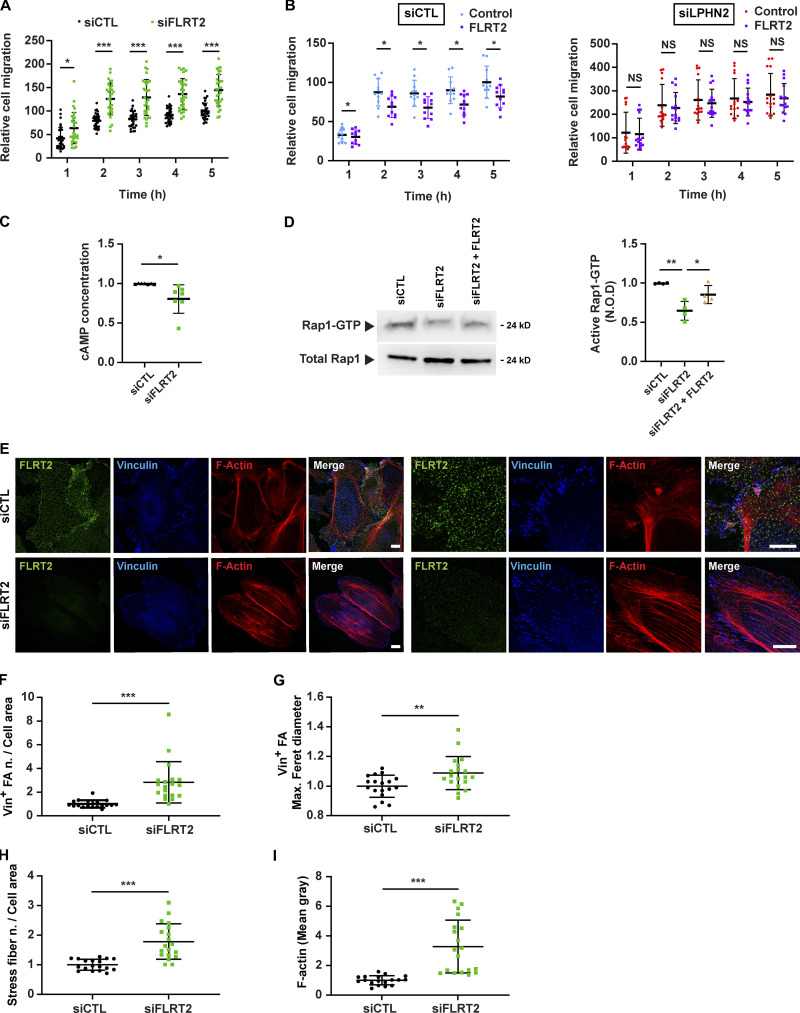
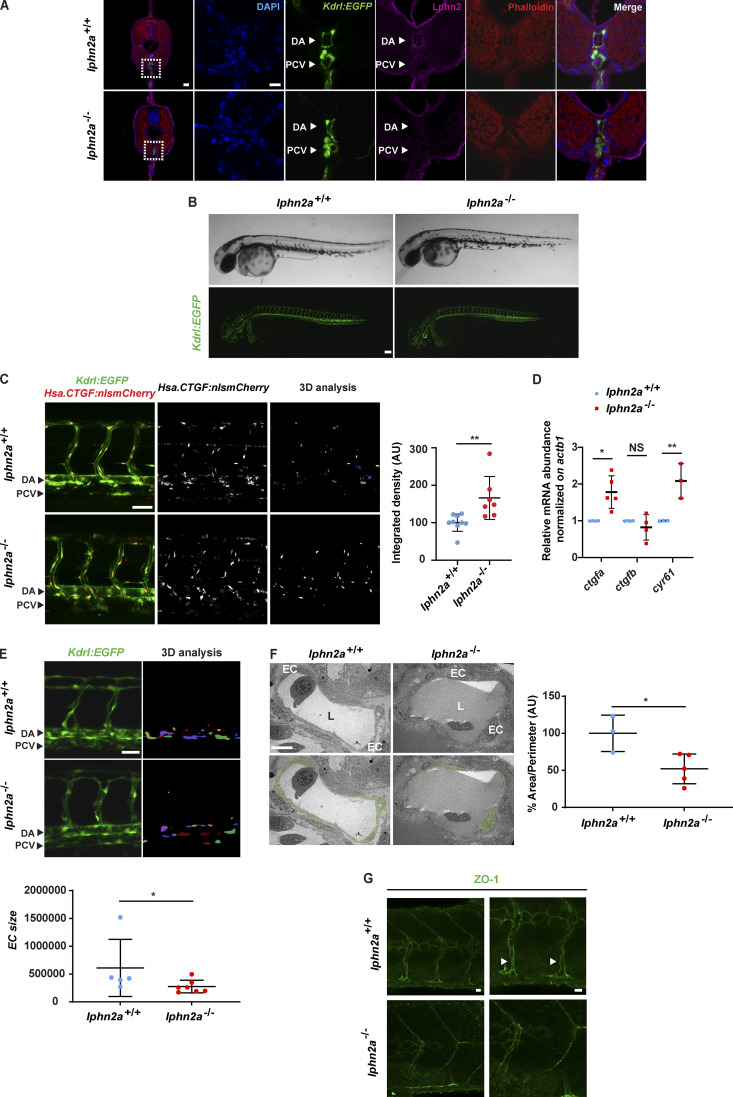
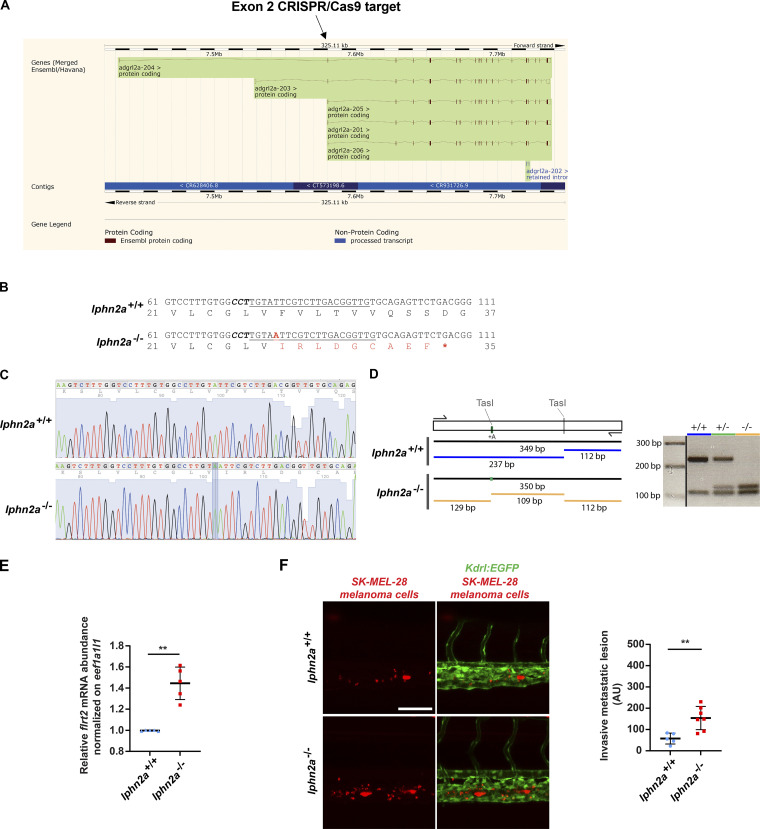
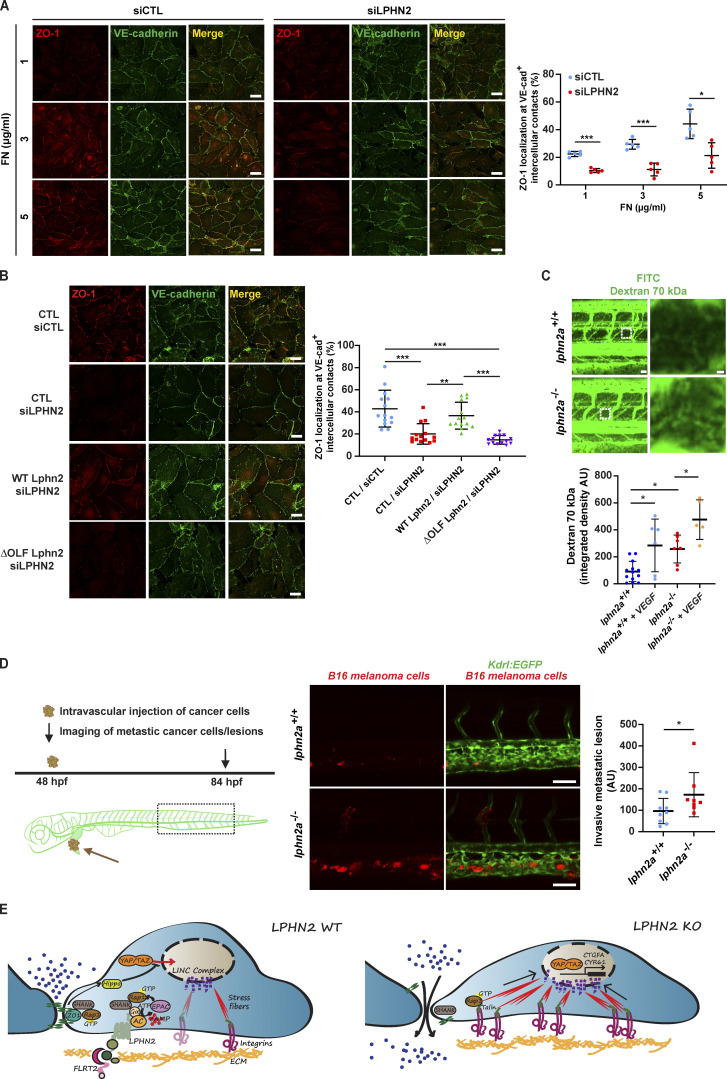
Dynamic modulation of endothelial cell-to-cell and cell-to-extracellular matrix (ECM) adhesion is essential for blood vessel patterning and functioning. Yet the molecular mechanisms involved in this process have not been completely deciphered. We identify the adhesion G protein-coupled receptor (ADGR) Latrophilin 2 (LPHN2) as a novel determinant of endothelial cell (EC) adhesion and barrier function. In cultured ECs, endogenous LPHN2 localizes at ECM contacts, signals through cAMP/Rap1, and inhibits focal adhesion (FA) formation and nuclear localization of YAP/TAZ transcriptional regulators, while promoting tight junction (TJ) assembly. ECs also express an endogenous LPHN2 ligand, fibronectin leucine-rich transmembrane 2 (FLRT2), that prevents ECM-elicited EC behaviors in an LPHN2-dependent manner. Vascular ECs of lphn2a knock-out zebrafish embryos become abnormally stretched, display a hyperactive YAP/TAZ pathway, and lack proper intercellular TJs. Consistently, blood vessels are hyperpermeable, and intravascularly injected cancer cells extravasate more easily in lphn2a null animals. Thus, LPHN2 ligands, such as FLRT2, may be therapeutically exploited to interfere with cancer metastatic dissemination.


Figures

Figure S1.
Figure S1.
Endogenous LPHN2 expression, silencing, and rescue impact on endothelial cell adhesion, migration, and signaling. (A) Upon surface biotinylation, LPHN2 was immunoprecipitated (IP) with a rabbit anti-LPHN2 pAb from EC lysates and revealed in Western blot (WB) by means of HRP streptavidin. Pre-immune serum (PIS) was employed for control purposes. The cleaved extracellular portion of LPHN2 appears as an ∼130 kD protein band. (B) HEK 293T cells were transfected with an empty vector or increasing amounts (2, 4, and 6 µg) of HA-Lphn2-EGFP construct. Cell lysates were then analyzed by Western blot with either anti-HA (left) or anti-GFP (right) Ab. The 230-kD, 130-kD, and 97-kD protein bands correspond to uncleaved full-length, cleaved N-terminal extracellular-only portion, and cleaved C-terminal portion of the transfected HA-Lphn2-EGFP protein, respectively. In the anti-GFP Western blot, the 27-kD band corresponds to the GFP whose cDNA was present in the control empty vector. (C) Real-time quantitative PCR analysis of LPHN2 mRNA in siCTL or siLPHN2 human ECs relative to the housekeeping genes GAPDH and TBP and normalized on siCTL levels. Results are themean ± SD of nine independent assays. Statistical analysis: two-tailed heteroscedastic Student’s t test; ***, P ≤ 0.001. (D) Real-time analysis of control (siCTL) or LPHN2 (siLPHN2) silenced EC migration toward FN was assessed with an xCELLigence RTCA DP system. Results are the mean ± SD of four independent assays. Statistical analysis: two-way ANOVA and Bonferroni’s post hoc analysis; NS, P > 0.05; *, P ≤ 0.05. (E) Real-time quantitative PCR analysis of LPHN2 mRNA in siCTL or siLPHN2 human ECs rescued or not (CTL) with mouse WT or ΔOLF Lphn2 relative to the housekeeping genes GAPDH and TBP and normalized on siCTL levels. Results are the mean ± SD of four independent assays. Statistical analysis: one-way ANOVA and Bonferroni’s post hoc analysis; ***, P ≤ 0.001. Right: Transduced and silenced ECs were also lysed and WT HA-Lphn2-pCCL and ΔOLF HA-Lphn2-pCCL protein expression levels analyzed by Western blot with anti-HA Ab. (F–H) Confocal microscopy analysis (F) of endogenous paxillin (Pax; blue), and phalloidin-labeled F-actin (red) reveals how, compared with siCTL ECs, LPHN2 silencing increases the number, normalized on cell area (G) and size (expressed by maximum Feret diameter, H) of paxillin-containing FAs. Scale bars, 10 µm. Results are the mean ± SD of two independent experiments for a total of 18 (siCTL) and 18 (siLPHN2) ECs. Statistical analysis: two-tailed heteroscedastic Student’s t test; *, P ≤ 0.05; ***, P < 0.001. (I) LPHN2 silencing in human ECs does not affect basal GTP loading of RhoA small GTPase. Total Rho was used to calculate the normalized OD (N.O.D.) levels of active Rho-GTP. Results are the mean ± SD of three independent assays. Statistical analysis: two-tailed heteroscedastic Student’s t test; NS, P > 0.05. (L) Mean fluorescence intensity of VE-cadherin (VE-cad+) intercellular staining (in green in Fig. 5 A) in siCTL ECs seeded on 10 kPa substrates coated with increasing amounts of FN (1, 3, and 5 µg/ml). The VE-cadherin intercellular recruitment was not affected by FN density. Results are the mean ± SD of two independent experiments. Statistical analysis: two-way ANOVA with Bonferroni’s post hoc analysis; NS, P > 0.05. (M) Mean fluorescence intensity of VE-cad+ intercellular staining (in green in Fig. 5 B) in lentivirally delivered WT or ΔOLF Lphn2 in ECs seeded on 10 kPa substrates coated with FN (5 µg/ml). The VE-cadherin intercellular recruitment was not affected by LPHN2 silencing. Results are the mean ± SD of two independent experiments. Statistical analysis: two-way ANOVA with Bonferroni’s post hoc analysis; NS, P > 0.05. Max., maximum; n., number.
Figure 1.
Figure 1.
LPHN2 signals via cAMP/Rap1 and negatively regulates FA turnover, stress fiber formation, and ECM-elicited mechanosensing. (A) Confocal microscopy analysis of ECs indicates how endogenous LPHN2, as detected by an anti-LPHN2 Ab (green), colocalizes with vinculin (Vin; red) in ECM adhesions of ECs as shown in merge (right). Bottom: Magnifications of the corresponding top row panels. Scale bars, 20 µm. (B) Fluorescence confocal microcopy reveals that in ECs transfected with HA-Lphn2-EGFP, both the extracellular, as detected by an anti-HA Ab (red), and the EGFP-fused intracellular (green) moieties colocalize with vinculin (blue) at ECM adhesions, as shown in merge (right). Bottom: Magnifications of the corresponding upper row panels. Scale bars, 20 µm. (C) Real-time analysis of cell migration in siCTL or siLPHN2 ECs toward Coll I, assessed with an xCELLigence RTCA DP system. Results are the mean ± SD of five independent assays. Statistical analysis: two-way ANOVA and Bonferroni’s post hoc analysis; ***, P ≤ 0.001. (D) LPHN2 silencing in ECs decreases basal amount of cAMP. Results are the mean ± SD of nine independent assays. Statistical analysis: two-tailed heteroscedastic Student’s t test; ***, P ≤ 0.001. (E) Rap1-GTP was pulled down on a GST fusion protein carrying the Rap1-binding domain of human Ral guanine nucleotide dissociation stimulator. LPHN2 silencing in human ECs decreases basal GTP loading of Rap1 small GTPase, and pCCL lentivirus-mediated overexpression of silencing-resistant mouse Lphn2 rescues the decrease. Total Rap1 was employed to calculate the normalized OD (N.O.D.) levels of active Rap1-GTP. Results are the mean ± SD of five independent experiments (a representative one is shown). Statistical analysis: one-way ANOVA and Bonferroni’s post hoc analysis; ***, P ≤ 0.001 for CTL/siCTL versus CTL/siLPHN2, and **, P ≤ 0.01 for CTL/siLPHN2 versus Lphn2/siLPHN2. (F–J) Confocal microscopy analysis (F) of endogenous LPHN2 (green), vinculin (blue), and phalloidin-labeled F-actin (red; each high magnification images are on the right) reveals how, compared with siCTL ECs, LPHN2 silencing increases the number, normalized on cell area (G) and size (expressed by maximum Feret diameter, H) of vinculin-containing FAs and the number, normalized on cell area (I) and amount (evaluated as mean gray intensity, J) of F-actin stress fibers in siLPHN2 ECs. Scale bars, 20 µm. Results concerning vinculin-containing FAs and F-actin stress fibers are the mean ± SD of two independent experiments for a total of 13 siCTL and 13 siLPHN2 ECs and two independent experiments for a total of 19 siCTL and 20 siLPHN2 ECs, respectively. Statistical analysis: two-tailed heteroscedastic Student’s t test; *, P ≤ 0.05; ***, P ≤ 0.001. (K and L) Confocal microscopy analysis (K) of endogenous YAP (green) and TAZ (red) reveals how, compared with siCTL ECs, LPHN2 silencing increases the nuclear (nucl)/cytoplasmic (cyto) ratio of both YAP (L, top) and TAZ (L, bottom). Nuclei were stained with TO-PRO3 (blue). Scale bar, 20 µm. Representative images of ECs plated on 10 kPa stiffness on FN (5 µg/ml) are shown. Results are the mean ± SD of two independent experiments for a total of 11 ECs for each condition (10 kPa and increasing FN 1, 3, and 5 µg/ml concentration). Statistical analysis: two-way ANOVA and Bonferroni’s post hoc analysis; *, P ≤ 0.05; ***, P ≤ 0.001. (M) Real-time quantitative PCR analysis of CTGF and CYR61 mRNA in siCTL or siLPHN2 human ECs relative to the housekeeping genes, GAPDH and TBP, and normalized on siCTL levels. Data of one of two independent assays are shown. Results are the mean ± SD of three technical replicates. Statistical analysis: two-tailed heteroscedastic Student’s t test; *, P ≤ 0.05; **, P ≤ 0.01. Max., maximum; n., number.
Figure S2.
Figure S2.
Endogenous FLRT2 expression, silencing, and LPHN2-mediated signaling impacts on endothelial cell adhesion and migration. (A) Real-time quantitative PCR analysis of FLRT1-3 mRNAs in human ECs relative to the housekeeping gene GAPDH. Results are the mean ± SD of four independent experiments. Statistical analysis: one-way ANOVA and Bonferroni’s post hoc analysis; ***, P ≤ 0.001. (B) Real-time quantitative PCR analysis of LPHN2 and FLRT1-3 mRNAs in siCTL and siLPHN2 human ECs. Results are normalized on siCTL values and are the mean ± SD of four independent experiments. Statistical analysis: one-way ANOVA and Bonferroni’s post hoc analysis; NS, P > 0.05; ***, P ≤ 0.001. (C) COS-7 cells transfected with empty vector or WT HA-Lphn2-EGFP or ΔOLF HA-Lphn2-EGFP constructs and their expression verified by Western blot (WB) analysis using a rat mAb anti-HA (middle). Next, COS-7 cells transfected with empty vector or WT HA-Lphn2-EGFP or ΔOLF HA-Lphn2-EGFP constructs were incubated or not with 6xHis-tagged rhFLRT2. The binding between the Lphn2 constructs and the rhFLRT2 ligand was revealed through sequential incubation with a mouse mAb anti-6xHis, an AP-conjugated goat anti-mouse pAb, and the AP substrate nitro blue tetrazolium–5-bromo-4-chloro-3-indolyl-phosphate (right). Results show how WT but not ΔOLF Lphn2 binds rhFLRT2. (D–F) Confocal microscopy analysis (D) of paxillin (Pax; blue), and phalloidin-labeled F-actin (red). Cells were first transduced with pCCL lentivirus (carrying GFP)-mediated overexpression (green) of silencing-resistant mouse WT or ΔOLF Lphn2 and then oligofected with either siCTL or siLPHN2 siRNAs. Scale bar, 10 µm. Confocal microscopy analysis reveals how lentiviral delivery of WT Lphn2, but not ΔOLF Lphn2 mutant, restores the phenotype of paxillin-containing FAs both considering the number (E) and the size (expressed by maximum Feret diameter, F). Results are the mean ± SD of two independent experiments for a total of 15 ECs for each condition. Statistical analysis: one-way ANOVA and Bonferroni’s post hoc analysis; NS, P > 0.05; **, P ≤ 0.01; ***, P ≤ 0.001. (G) Real-time quantitative PCR analysis of FLRT2 mRNA in siCTL or siFLRT2 human ECs relative to the housekeeping gene GAPDH and normalized on siCTL levels. Results are the mean ± SD of six independent assays. Statistical analysis: two-tailed heteroscedastic Student’s t test; ***, P ≤ 0.001. (H) Western blot analysis with an anti-FLRT2 Ab of lysates of siCTL or siFLRT2 ECs or siFLRT2 ECs treated with exogenous rhFLRT2 (800 ng/ml). Endogenous FLRT2 appears as an ∼85 kD protein, while the soluble extracellular portion of exogenous rhFLTR2 appears as an ∼75 kD protein band. (I) LPHN2 silencing in human ECs decreased SHANK2 interaction with Rap1 small GTPase. Western blot analysis of Rap1 coimmunoprecipitated (IPed) with SHANK2 in cultured ECs. Results are the mean ± SD of three independent experiments. Statistical analysis: two-tailed heteroscedastic Student’s t test; *, P ≤ 0.05. Max., maximum; n., number.
Figure 2.
Figure 2.
Negative regulation of FA turnover, stress fiber formation, and ECM-elicited mechanosensing relies on FLRT2-binding OLF domain of LPHN2. (A–E) Confocal microscopy analysis (A) of vinculin (Vin; blue), and phalloidin-labeled F-actin (red; vinculin high-magnification images are on the bottom). Cells were first transduced with pCCL lentivirus (carrying GFP)-mediated overexpression (green) of silencing-resistant mouse WT or ΔOLF Lphn2 and then oligofected with either siCTL or siLPHN2 siRNAs. Scale bars, 10 µm; magnification scale bar, 5 µm. Confocal microscopy analysis reveals how lentiviral delivery of WT LPHN2, but not ΔOLF LPHN2 mutant, restores the phenotype of vinculin-containing FAs number, normalized on cell area (B) and size (expressed by maximum Feret diameter, C). The same rescue effect of WT LphnN2, but not ΔOLF Lphn2 mutant, occurs on stress fiber number, normalized on cell area (D) and amount (evaluated as mean gray intensity, E). Results are the mean ± SD of two independent experiments for a total of 15 ECs for each condition. Statistical analysis: one-way ANOVA and Bonferroni’s post hoc analysis; *, P ≤ 0.05; **, P ≤ 0.01; ***, P ≤ 0.001. (F) XZ-STED confocal microscope cross-sectioning of stress fibers reveals how siLPHN2 ECs have thicker stress fibers in comparison to siCTL ECs, and the transduction of WT, but not ΔOLF Lphn2, rescues this phenotype. The cross-sectional area of stress fibers was measured with a mask, shown (image with white background) at the bottom each image, obtained with ImageJ starting from XZ STED confocal images after deconvolution (image with black background). Scale bar, 1 µm. Results are the mean ± SD of two independent experiments for a total of 11 ECs for each condition. Statistical analysis: one-way ANOVA and Bonferroni’s post hoc analysis; **, P ≤ 0.01; ***, P ≤ 0.001. (G and H) Confocal microscopy analysis (G) of endogenous YAP (in red on the left) and TAZ (in red on the right) reveals how pCCL lentivirus (carrying GFP)-mediated delivery (green) of WT Lphn2, but not ΔOLF Lphn2 mutant, restores the nuclear (nucl)/cytoplasmic (cyto) ratio of both YAP (H, top panel) and TAZ (H, bottom panel). Scale bar, 20 µm. Representative images of ECs plated on FN (5 µg/ml)-coated 10 kPa stiff substrate are shown. Results are the mean ± SD of two independent experiments for a total of 22 ECs for each experimental condition (10 kPa and increasing 1, 3, and 5 µg/ml FN concentration). Statistical analysis: two-way ANOVA and Bonferroni’s post hoc analysis; NS, P > 0.05; *, P ≤ 0.05; **, P ≤ 0.01; ***, P ≤ 0.001. (I) Real-time analysis of EC migration toward Coll I (xCELLigence RTCA DP system) reveals how only transduction with WT (green), but not ΔOLF LPHN2 (purple) rescues the higher migration rate of siLPHN2 ECs. Results are the mean ± SD of three independent experiments. Results were analyzed with two-way ANOVA and Bonferroni’s post hoc analysis; *, P ≤ 0.05; ##, P ≤ 0.01; ###, P ≤ 0.001. Max., maximum; n., number.
Figure 3.
Figure 3.
FLRT2 negatively regulates EC response to the ECM via LPHN2 and triggers cAMP/Rap1 signaling (A and B) Real-time analysis of EC migration toward Coll I, assessed with an xCELLigence RTCA DP system. (A) Endogenous FLRT2 silencing (siFLRT2) increases migration compared with siCTL ECs. Results are the mean ± SD of seven independent assays. Statistical analysis: two-way ANOVA and Bonferroni’s post hoc analysis; *, P ≤ 0.05; ***, P ≤ 0.001. (B) Exogenous rhFLRT2 (800 ng/ml) inhibits siCTL but not siLPHN2 EC migration. For sake of simplicity, data from the same experiments are plotted in two separate graphs. Results are the mean ± SD of three independent assays. Statistical analysis: two-way ANOVA and Bonferroni’s post hoc analysis; *, P ≤ 0.05 for siCTL ECs (left), whereas all differences in siLPHN2 ECs (right) were not significant; NS, P > 0.05. (C) Endogenous FLRT2 silencing in ECs decreases basal cAMP amount. Results are the mean ± SD of seven independent assays. Statistical analysis: two-tailed heteroscedastic Student’s t test; *, P ≤ 0.05. (D) Endogenous FLRT2 silencing (siFLRT2) in ECs decreases basal Rap1-GTP levels, and treatment of siFLRT2 ECs with exogenous rhFLRT2 (800 ng/ml) rescues the decrease in Rap1-GTP levels. Total Rap1 was employed to calculate the normalized OD (N.O.D.) levels of active Rap1-GTP. Results are the mean ± SD of four independent experiments (a representative one is shown). Statistical analysis: one-way ANOVA and Bonferroni’s post hoc analysis; **, P ≤ 0.01 for siCTL versus siFLRT2 and *, P ≤ 0.05 for siFLRT2 versus siFLRT2 + FLRT2. (E–I) Confocal microscopy analysis (E) of endogenous FLRT2 (green), vinculin (Vin; blue), and phalloidin-labeled F-actin (red; high-magnification images are on the right) reveals how, compared with siCTL ECs, FLRT2 silencing increases the number, normalized on cell area (F) and size (expressed by maximum Feret diameter, G) of vinculin-containing FAs and the number, normalized on cell area (H), and amount (evaluated as mean gray intensity, I) of F-actin stress fibers in siFLRT2 ECs. Scale bar, 10 µm (siCTL), 15 µm (siFLRT2). Results are the mean ± SD of four independent experiments for a total of 18 (siCTL) and 19 (siFLRT2) ECs. Statistical analysis: two-tailed heteroscedastic Student’s t test; **, P ≤ 0.01; ***, P < 0.001. Max., maximum; n., number.
Figure 4.
Figure 4.
LPHN2 controls EC YAP/TAZ mechanosensing and vascular morphogenesis in zebrafish embryo. (A) Confocal fluorescence microscopy analysis of trunk cross-sections at 72 hpf of Tg(Kdrl:EGFP)s843 WT (lphn2a+/+) and CRISPR/Cas9-mediated lphn2a knock-out (lphn2a−/−) zebrafish embryos carrying EC-specific EGFP expression (green) and stained for Lphn2 (purple) and phalloidin (red). Nuclei are stained with DAPI (blue). Lphn2 is enriched in ECs of DA and posterior cardinal vein (PCV). The first panel on the left (scale bar, 30 µm) displays a whole cross-section whose boxed area is magnified and depicted in the five panels located on its right (scale bar, 10 µm). (B) Lateral view in brightfield (top) and fluorescence confocal (bottom) microscopy of WT (lphn2a+/+) and CRISPR/Cas9-mediated lphn2a−/− zebrafish embryos in the Tg(kdrl:EGFP)s843 background. Scale bar, 100 µm. (C) Yap1/Taz reporter activity is prominent in the endothelium trunk vasculature of zebrafish embryos. Left: Representative confocal images of Tg(Hsa.CTGF:nlsmCherry)ia49 /Tg(kdrl:EGFP)s843 double-transgenic lphn2a+/+ and lphn2a−/− siblings at 60 hpf. Yap1/Taz activation signal was automatically segmented on fluorescent confocal mCherry image z-stacks, inside a EGFP fluorescent mask identifying ECs. Scale bar, 50 µm. The EC-restricted Yap1/Taz signal intensity only was represented in 3D analysis and quantified. Right: Relative quantification of integrated density of Yap1/Taz Hsa.CTGF:nlsmCherry reporter activity signal colocalized with kdrl:GFP in lphn2a+/+ (n = 9) and lphn2a−/− (n = 7) zebrafish embryos (56–72 hpf). Results are the mean ± SD. Statistical analysis: Mann–Whitney test; **, P ≤ 0.01. (D) Real-time quantitative PCR analysis of ctgfa, ctgfb, and cyr61 mRNAs of FACS-sorted ECs isolated from lphn2a+/+ or lphn2a−/− zebrafish embryos, at 48 hpf, relative to the housekeeping gene actb1 and normalized on the mRNA levels measured in lphn2a+/+ animals. Results are the mean ± SD of three or more independent assays (n > 80 embryos for condition). Statistical analysis: one-way ANOVA followed by Tukey’s multiple comparison test; NS, P > 0.05; *, P ≤ 0.05; **, P ≤ 0.01. (E) Representative confocal images of kdrl:GFP positive cells (left) and represented in the 3D analysis (right) used to quantify EC size (bottom) in lphn2a+/+ (n = 5) and lphn2a−/− (n = 7). Scale bar, 20 µm. Results are the mean ± SD. Statistical analysis: Mann–Whitney test; *, P ≤ 0.05. (F) TEM analysis of endothelium area (left), used to determine the EC area normalized on the diameter of the vessel (right) in lphn2a+/+ (n = 3) and lphn2a−/− (n = 5). Color code identifies the ECs facing the vascular lumen (L). Scale bar, 10 µm. Results are the mean ± SD. Statistical analysis: Mann–Whitney test; *, P ≤ 0.05. (G) Representative confocal images of ZO-1 staining in intersomitic blood vessels (ISVs) of lphn2a+/+ and lphn2a−/− at 48 hpf. Arrowheads point at continuous ZO-1–stained intercellular contacts between ISV ECs of lphn2a+/+ zebrafish embryos. The ZO-1 intercellular staining between ISV ECs is instead reduced, discontinuous, and fragmented in lphn2a−/− zebrafish embryos. Scale bars, 20 µm (left) and 30 µm (right).
Figure S3.
Figure S3.
Generation and characterization of lphn2a null zebrafish embryos. (A) lphn2a (aka adgrl2a) zebrafish mRNA splicing variants displaying all exons. The black arrow outlines the lphn2a gene targeted region located in the second exon, which is common to all splicing variants. (B) DNA sequence details of the exon 2 lphn2a gene targeted region in lphn2a+/+ and lphn2a−/− zebrafish embryos. Locus-specific sgRNA is underlined, and the protospacer-adjacent motif sequence is labeled in bold italics. A one-nucleotide insertion (A, red bold underscored), revealed by sequencing, and the consequent nine new amino acids (red) and STOP codon (red asterisk) are shown. (C) Alignment of lphn2a+/+ and lphn2a−/− sequence obtained by Sanger sequencing. (D) Schematic representation of genotyping. The one base insertion generates a second TasI restriction site in the diagnostic PCR, which has been used for genotyping. (E) Real-time qRT-PCR analysis of flrt2 mRNA in lphn2a+/+ or lphn2a−/− zebrafish embryos relative to the housekeeping gene eef1a1l1 and normalized on the mRNA levels measured in lphn2a+/+ animals. Results are the mean ± SD of five independent assays (n > 80 embryos for condition). Statistical analysis: Mann–Whitney test; **, P ≤ 0.01. (F) MemBright-560-labeled melanoma cells were microinjected into the duct of Cuvier of 48 hpf lphn2a+/+ or lphn2a−/− Tg(Kdrl:EGFP) zebrafish embryos. After 36 h, extravasated metastatic melanoma cells were imaged by confocal analysis of the caudal plexus. Human SK-MEL-28 melanoma cell extravasation is enhanced in lphn2a−/− compared with lphn2a+/+ zebrafish embryos. Results are the mean ± SD of two independent assays, in which 12 SK-MEL-28 melanoma cell–injected animals were analyzed. Statistical analysis: Mann–Whitney test; **, P ≤ 0.01.
Figure 5.
Figure 5.
LPHN2 promotes EC TJ assembly and impairs vascular permeability and cancer cell extravasation. (A) Confocal microscopy analysis of TJs stained with ZO-1 (red) and VE-cadherin (green) reveals how in siCTL ECs seeded on 10 kPa substrates coated with increasing amounts of FN (1, 3, and 5 µg/ml) ZO-1 is progressively accumulating at VE-cadherin+ (VE-cad+) cell-to-cell junctions. Compared with siCTL ECs, LPHN2 silencing impairs ZO-1 but not VE-cadherin accumulation at intercellular contacts on increasing FN amounts. Scale bar, 25 µm. Results concerning the percentage of VE-cad+ intercellular area covered with ZO-1 are the mean ± SD of two independent experiments and a total of five confocal microscopy images for each condition. Statistical analysis: two-way ANOVA with Bonferroni’s post hoc analysis; *, P ≤ 0.05; ***, P ≤ 0.001. (B) Confocal microscopy analysis reveals how, compared with siCTL ECs, LPHN2 silencing impairs ZO-1 accumulation to VE-cad+ intercellular contacts of ECs plated on FN (5 µg/ml)-coated coverslips. Lentiviral delivery of WT Lphn2 restores ZO-1 localization to TJs, while the ΔOLF Lphn2 mutant does not rescue the phenotype. Scale bar, 25 µm. Results concerning the percentage of VE-cad+ intercellular area covered with ZO-1 are the mean ± SD of three independent experiments for a total of 14 confocal microscopy images for each condition. Statistical analysis: one-way ANOVA and Bonferroni’s post hoc analysis; **, P ≤ 0.01; ***, P ≤ 0.001. (C) Top: Representative images of vascular permeability in lphn2a+/+ versus lphn2a−/− zebrafish embryos. 70 kD FITC-dextran was injected with or without 1 ng of VEGF-A (#V7259; Sigma). 70 kD Dextran is in green. Scale bars, 30 µm (left) and 3 µm (right). Bottom: Quantification of relative extravascular fluorescence. For each embryo, the fluorescence intensity of the dextran was measured in two intervascular areas between the intersegmental vessels (dashed box and shown in the zoom images on the right). lphn2a+/+ (n = 13), lphn2a+/+ with VEGF (n = 6), lphn2a−/− (n = 7), lphn2a−/− with VEGF (n = 5) embryos from two independent experiments. Results are the mean ± SD. Statistical analysis: one-way ANOVA followed by Tukey’s multiple comparison test; *, P ≤ 0.05. (D) MemBright-560–labeled mouse B16F10 melanoma cells were microinjected into the duct of Cuvier of 48 hpf lphn2a+/+ or lphn2a−/− Tg(Kdrl:EGFP)s843 zebrafish embryos. After 36 h postinjection, extravasated metastatic melanoma cells were imaged by confocal analysis of the caudal plexus. Mouse B16F10 melanoma cell extravasation is enhanced in lphn2a−/− compared with lphn2a+/+ zebrafish embryos. Results are the mean ± SD of two independent assays, in which 17 animals were analyzed. Scale bars, 50 µm. Statistical analysis: Mann–Whitney test; *, P ≤ 0.05. (E) LPHN2 signaling controls endothelial FAs, TJs, and vascular permeability. Vascular ECs synthesize the FLRT2 ligand of LPHN2 that localizes at integrin-based ECM adhesion sites. FLRT2-activated LPHN2 triggers a canonical heterotrimeric G-protein α subunit (Gα)/adenylate cyclase (AC)/cAMP pathway that in turn, likely via the guanine nucleotide exchange factor EPAC, activates the small GTPase Rap1, which is a well-known regulator of cell-to-ECM adhesions (Coló et al., 2012; Lagarrigue et al., 2016). Furthermore, Rap1 promotes the formation of TJs (Sasaki et al., 2020), which in ECs are crucial for the control of vascular permeability. Hence, LPHN2 activation of Rap1 may act both to inhibit the formation of FAs and to promote the assembly of TJs, which increase EC barrier function. LPHN2 also binds the central PDZ domain of SHANK adaptor protein that in turn, through its N-terminal SPN domain, binds Rap1-GTP, suppressing talin-mediated integrin activation and FA development (Lilja et al., 2017) and promoting the assembly of TJs (Sasaki et al., 2020). Therefore, LPHN2 may favor the turnover of FAs and the formation of TJs by funneling Rap1-GTP toward SHANK. In addition, while TJs inhibit the nuclear translocation of YAP and TAZ through their Hippo pathway–dependent phosphorylation, FAs and the associated F-actin stress fibers exert exactly the opposite effect, promoting YAP/TAZ nuclear localization and transcriptional function (Karaman and Halder, 2018; Moya and Halder, 2019). Thus, the nuclear translocation and functional activation of YAP/TAZ caused by LPHN2 silencing or knock-down likely lie downstream of both the disassembly of TJs and the increased formation of FAs and stress fibers. In addition, the myosin II–mediated contraction of FA-linked stress fibers releases YAP/TAZ from their binding to the inhibitory switch/sucrose non-fermentable complex (not depicted) and transmits force from the ECM to the nucleus, changing nuclear pore conformation, finally promoting the translocation of YAP/TAZ into the nucleus and the transcription of target genes, such as CTGFA and CYR61. The lack of LPHN2 also results in an abnormal ECM-driven intercellular targeting of ZO-1 and assembly of TJs, which increases vascular permeability and favors cancer cell extravasation. KO, knock-out.

Similar articles

Cited by

References

    1. Astone, M., Lai J.K.H., Dupont S., Stainier D.Y.R., Argenton F., and Vettori A.. 2018. Zebrafish mutants and TEAD reporters reveal essential functions for Yap and Taz in posterior cardinal vein development. Sci. Rep. 8:10189. 10.1038/s41598-018-27657-x - DOI - PMC - PubMed
    1. Avanzato, D., Genova T., Fiorio Pla A., Bernardini M., Bianco S., Bussolati B., Mancardi D., Giraudo E., Maione F., Cassoni P., et al. . 2016. Activation of P2X7 and P2Y11 purinergic receptors inhibits migration and normalizes tumor-derived endothelial cells via cAMP signaling. Sci. Rep. 6:32602. 10.1038/srep32602 - DOI - PMC - PubMed
    1. Birukova, A.A., Tian X., Cokic I., Beckham Y., Gardel M.L., and Birukov K.G.. 2013. Endothelial barrier disruption and recovery is controlled by substrate stiffness. Microvasc. Res. 87:50–57. 10.1016/j.mvr.2012.12.006 - DOI - PMC - PubMed
    1. Bos, J.L., and Pannekoek W.J.. 2012. Semaphorin signaling meets rap. Sci. Signal. 5:pe6. 10.1126/scisignal.2002913 - DOI - PubMed
    1. Camillo, C., Gioelli N., Bussolino F., and Serini G.. 2017. An Electrical Impedance-Based Method for Quantitative Real-Time Analysis of Semaphorin-Elicited Endothelial Cell Collapse. Methods Mol. Biol. 1493:195–207. 10.1007/978-1-4939-6448-2_14 - DOI - PubMed

Publication types

Substances