Multicenter Study
. 2021 Dec 14;5(23):5086-5097.
doi: 10.1182/bloodadvances.2021005491.

PD-1 inhibition in advanced myeloproliferative neoplasms

Affiliations
Multicenter Study

PD-1 inhibition in advanced myeloproliferative neoplasms

Gabriela Hobbs et al. Blood Adv. .

Abstract

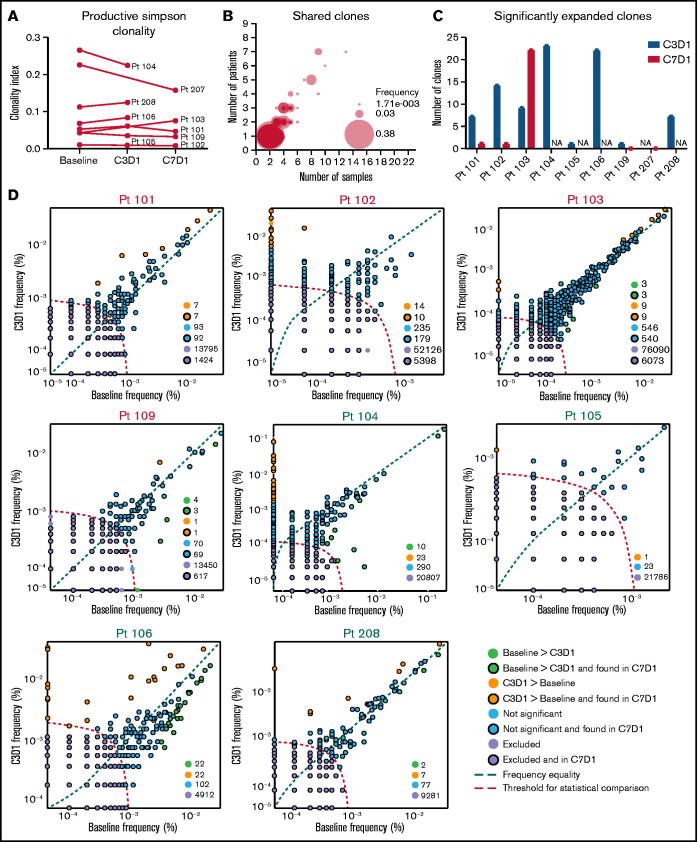
Myelofibrosis (MF) is a clonal stem cell neoplasm characterized by abnormal JAK-STAT signaling, chronic inflammation, cytopenias, and risk of transformation to acute leukemia. Despite improvements in the therapeutic options for patients with MF, allogeneic hematopoietic stem cell transplantation remains the only curative treatment. We previously demonstrated multiple immunosuppressive mechanisms in patients with MF, including increased expression of programmed cell death protein 1 (PD-1) on T cells compared with healthy controls. Therefore, we conducted a multicenter, open-label, phase 2, single-arm study of pembrolizumab in patients with Dynamic International Prognostic Scoring System category of intermediate-2 or greater primary, post-essential thrombocythemia or post-polycythemia vera myelofibrosis that were ineligible for or were previously treated with ruxolitinib. The study followed a Simon 2-stage design and enrolled a total of 10 patients, 5 of whom had JAK2V617mutation, 2 had CALR mutation, and 6 had additional mutations. Most patients were previously treated with ruxolitinib. Pembrolizumab treatment was well tolerated, but there were no objective clinical responses, so the study closed after the first stage was completed. However, immune profiling by flow cytometry, T-cell receptor sequencing, and plasma proteomics demonstrated changes in the immune milieu of patients, which suggested improved T-cell responses that can potentially favor antitumor immunity. The fact that these changes were not reflected in a clinical response strongly suggests that combination immunotherapeutic approaches rather than monotherapy may be necessary to reverse the multifactorial mechanisms of immune suppression in myeloproliferative neoplasms. This trial was registered at www.clinicaltrials.gov as #NCT03065400.


Figures

None
Graphical abstract
Figure 1.
Figure 1.
Study schema. Patients with primary or secondary MF enrolled in the Simon two-stage design; if <1 of 9 responded, the study would not proceed to stage 2. In addition, there was an exploratory cohort for accelerated and blast phase disease. Pembrolizumab 200 mg was administered intravenously (IV) once every 3 weeks.
Figure 2.
Figure 2.
Changes in T-cell frequencies in blood after administration of pembrolizumab. Frequencies of cell populations among PBMCs collected before pembrolizumab administration (baseline), on C3D1 or C7D1 were evaluated. (A) Frequency of PD-1+ cells at baseline, gated under the T-cell populations indicated on the x-axis. Color key shows patients by ID number. (B) Frequency of PD-L1+ cells among live cells. Frequency of T cells as analyzed by flow cytometry (C) (CD3+) or TCR sequencing (D) (TCRseq) (number of cells expressing TCR/number of total nucleated cells). (E) Changes in T-cell subset ratios (% CD3+CD4+/% CD3+CD8+). Statistical significance was evaluated by Wilcoxon matched-pairs signed-rank test. P < .05 was considered significant. *P = .0391.
Figure 3.
Figure 3.
Pembrolizumab-induced alterations in T-cell repertoire. TCR Vβ chains of peripheral blood T cells collected before administration of pembrolizumab (baseline) and on C3D1 or C7D1 were sequenced. (A) Clonality of T cells was calculated using the Simpson index (scores range from 0 to 1); a score of 1 indicates a monoclonal population. Statistical significance was evaluated by Wilcoxon matched-pairs signed-rank test. (B) Top 500 clones with the highest total productive frequencies (the sum of frequencies found in each sample) were evaluated to identify shared clones. The plot displays the number of patients (n = 9, y-axis) or samples sequenced (n = 22, x-axis), in which individual clones were found. The size of the bubbles indicates the total frequency of clones. (C) Number of clones for each patient that were significantly expanded at C3D1 and C7D1 compared to baseline. (D) Changes in the abundance of unique TCR Vβ sequences after 2 cycles of pembrolizumab treatment were analyzed (C3D1 vs baseline). Only clones with a minimum cumulative abundance of 10 were included in the analysis. Significantly expanded or contracted clones are denoted in orange and blue, respectively. The clones analyzed at C3D1 were evaluated for their presence at C7D1, where available (titled in red), and those that were also found at C7D1 were marked by a black circle. Significance was evaluated by the binomial method (two-sided), and false discovery rates were controlled by using the Benjamini-Hochberg method. Differential abundance of clones was considered significant if P ≤ .01. NA, not applicable.
Figure 4.
Figure 4.
Changes in the profiles of the plasma proteins after administration of pembrolizumab. Plasma samples collected before administration of pembrolizumab (screen), on C3D1 or C7D1 were analyzed using an OLINK Immuno-Oncology panel. Normalized protein expression values (NPX) are displayed. (A) Heatmap comparing the normalized expression of 80 proteins (y-axis) in the plasma of patients before and after receiving pembrolizumab (x-axis). Color intensity indicates NPX value. Analytes with a significant increase on C3D1 compared with screening are denoted with asterisks. Plasma protein profiles throughout the treatment were plotted for PD-1 (screen vs C3D1, P < .0001; screen vs C7D1, P = .0076) (B), CXCL9 (screen vs C3D1, P = .0033; screen vs C7D1, P = .0035) (C), and CXCL10 (screen vs C3D1, P = .0978; screen vs C7D1, P = .0427) (D). Statistical significance was evaluated by paired Student t test. P < .05 was considered significant. *P < .05; **P < .01; ****P < .0001. Ns, not significant; Ref, healthy donor control reference.

References

    1. Mascarenhas J, Mughal TI, Verstovsek S. Biology and clinical management of myeloproliferative neoplasms and development of the JAK inhibitor ruxolitinib. Curr Med Chem. 2012;19(26):4399-4413. - PMC - PubMed
    1. Vannucchi AM, Lasho TL, Guglielmelli P, et al. . Mutations and prognosis in primary myelofibrosis. Leukemia. 2013;27(9):1861-1869. - PubMed
    1. Rumi E, Pietra D, Pascutto C, et al. ; Associazione Italiana per la Ricerca sul Cancro Gruppo Italiano Malattie Mieloproliferative Investigators . Clinical effect of driver mutations of JAK2, CALR, or MPL in primary myelofibrosis. Blood. 2014;124(7):1062-1069. - PMC - PubMed
    1. Mondet J, Hussein K, Mossuz P. Circulating cytokine levels as markers of inflammation in Philadelphia negative myeloproliferative neoplasms: diagnostic and prognostic interest. Mediators Inflamm. 2015;2015:670580. - PMC - PubMed
    1. Barcellini W, Iurlo A, Radice T, et al. . Increased prevalence of autoimmune phenomena in myelofibrosis: relationship with clinical and morphological characteristics, and with immunoregulatory cytokine patterns. Leuk Res. 2013;37(11):1509-1515. - PubMed

Publication types

MeSH terms

Substances

Associated data