Sepsis Among Medicare Beneficiaries: 4. Precoronavirus Disease 2019 Update January 2012-February 2020
- PMID: 34582410
- PMCID: PMC8594514
- DOI: 10.1097/CCM.0000000000005332
Sepsis Among Medicare Beneficiaries: 4. Precoronavirus Disease 2019 Update January 2012-February 2020
Abstract
Objectives: To provide updated information on the burdens of sepsis during acute inpatient admissions for Medicare beneficiaries.
Design: Analysis of paid Medicare claims via the Centers for Medicare and Medicaid Services DataLink Project.
Setting: All U.S. acute-care hospitals, excluding federally operated hospitals (Veterans Administration and Defense Health Agency).
Patients: All Medicare beneficiaries, January 2012-February 2020, with an explicit sepsis diagnostic code assigned during an inpatient admission.
Interventions: None.
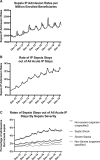
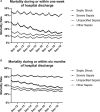
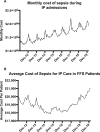
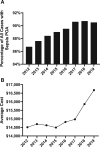
Measurements and main results: The count of Medicare Part A/B (fee-for-service) plus Medicare Advantage inpatient sepsis admissions rose from 981,027 (CY2012) to 1,700,433 (CY 2019). The proportion of total admissions with sepsis in the Medicare Advantage population rose from 21.43% to 35.39%, reflecting the increasing beneficiary proportion enrolled in Medicare Advantage. In CY2019, 6-month mortality rates in Medicare fee-for-service beneficiaries for sepsis continued to decline, but remained high: 59.9% for septic shock, 35.5% for severe sepsis, 30.8% for sepsis attributed to a specific organism, and 26.5% for unspecified sepsis. Total fee-for-service-only inpatient hospital costs rose from $17.79B (CY2012) to $22.98B (CY2019). We estimated that the aggregate cost of sepsis hospital care for the entire U.S. population was at least $57.47B in 2019. Inclusion of 14 months' (January 2019-February 2020) newer data exposed new trends: the cost per patient, number of admissions, and fraction of patients with sepsis labeled as present on admission inflected around November 2015, coincident with the change to International Classification of Diseases, 10th Edition, and introduction of the Severe Sepsis and Septic Shock Management Bundle (SEP-1) metric.
Conclusions: Sepsis among Medicare beneficiaries precoronavirus disease 2019 imposed immense burdens upon patients, their families, and the taxpayers.
Conflict of interest statement
Drs. Frank, Buchman, Sciarretta, Sowers, Collier, Chavan, Lin, Oke, Rhodes, Santhosh, Chu, Patel, Disbrow, and Kelman disclosed government work. Dr. Buchman’s institution received funding from United States government Biomedical Advanced Research and Development Authority (BARDA)/Division of Research, Innovation, and Ventures and the Society of Critical Care Medicine (Editor in Chief of Critical Care Medicine). Dr. Simpson disclosed he is the President of the American College of Chest Physicians. Dr. Sowers’s institution received funding from BARDA, Office of the Assistant Secretary for Preparedness and Response. Drs. Collier, Chavan, Lin, Oke, Rhodes, and Santhosh disclosed that this work was performed by Acumen, LLC under contract with the Centers for Medicare & Medicaid Services, U.S. Department of Health and Human Services (Contract No. HHSM-500-2014-00027I; Task Order No. HHSM-500-T0004), with funding from U.S. Department of Health and Human Services, Office of the Assistant Secretary for Preparedness and Response. Dr. MaCurdy’s institution received funding from Centers for Medicare & Medicaid Services, he received support for article research from Centers for Medicare & Medicaid Services; and he disclosed work for hire. The remaining authors have disclosed that they do not have any potential conflicts of interest.
Figures


References
-
- National Center for Emerging and Zoonotic Infectious Diseases (NCEZID), Centers for Disease Control and Prevention: Division of Healthcare Quality Promotion (DHQP) CDC Data and Reports. 2016. Available at: https://www.cdc.gov/. Accessed April 1, 2021
-
- Torio CM, Moore BJ: National Inpatient Hospital Costs: The Most Expensive Conditions by Payer. 2013. Available at: https://www.hcup-us.ahrq.gov/reports/statbriefs/sb204-Most-Expensive-Hos.... Accessed April 12, 2021 - PubMed
MeSH terms
LinkOut - more resources
Full Text Sources
Medical

