Comparative Study
. 2021 Sep 28;18(9):e1003773.
doi: 10.1371/journal.pmed.1003773. eCollection 2021 Sep.

Incidence, co-occurrence, and evolution of long-COVID features: A 6-month retrospective cohort study of 273,618 survivors of COVID-19

Affiliations
Comparative Study

Incidence, co-occurrence, and evolution of long-COVID features: A 6-month retrospective cohort study of 273,618 survivors of COVID-19

Maxime Taquet et al. PLoS Med. .

Abstract

Background: Long-COVID refers to a variety of symptoms affecting different organs reported by people following Coronavirus Disease 2019 (COVID-19) infection. To date, there have been no robust estimates of the incidence and co-occurrence of long-COVID features, their relationship to age, sex, or severity of infection, and the extent to which they are specific to COVID-19. The aim of this study is to address these issues.

Methods and findings: We conducted a retrospective cohort study based on linked electronic health records (EHRs) data from 81 million patients including 273,618 COVID-19 survivors. The incidence and co-occurrence within 6 months and in the 3 to 6 months after COVID-19 diagnosis were calculated for 9 core features of long-COVID (breathing difficulties/breathlessness, fatigue/malaise, chest/throat pain, headache, abdominal symptoms, myalgia, other pain, cognitive symptoms, and anxiety/depression). Their co-occurrence network was also analyzed. Comparison with a propensity score-matched cohort of patients diagnosed with influenza during the same time period was achieved using Kaplan-Meier analysis and the Cox proportional hazard model. The incidence of atopic dermatitis was used as a negative control. Among COVID-19 survivors (mean [SD] age: 46.3 [19.8], 55.6% female), 57.00% had one or more long-COVID feature recorded during the whole 6-month period (i.e., including the acute phase), and 36.55% between 3 and 6 months. The incidence of each feature was: abnormal breathing (18.71% in the 1- to 180-day period; 7.94% in the 90- to180-day period), fatigue/malaise (12.82%; 5.87%), chest/throat pain (12.60%; 5.71%), headache (8.67%; 4.63%), other pain (11.60%; 7.19%), abdominal symptoms (15.58%; 8.29%), myalgia (3.24%; 1.54%), cognitive symptoms (7.88%; 3.95%), and anxiety/depression (22.82%; 15.49%). All 9 features were more frequently reported after COVID-19 than after influenza (with an overall excess incidence of 16.60% and hazard ratios between 1.44 and 2.04, all p < 0.001), co-occurred more commonly, and formed a more interconnected network. Significant differences in incidence and co-occurrence were associated with sex, age, and illness severity. Besides the limitations inherent to EHR data, limitations of this study include that (i) the findings do not generalize to patients who have had COVID-19 but were not diagnosed, nor to patients who do not seek or receive medical attention when experiencing symptoms of long-COVID; (ii) the findings say nothing about the persistence of the clinical features; and (iii) the difference between cohorts might be affected by one cohort seeking or receiving more medical attention for their symptoms.

Conclusions: Long-COVID clinical features occurred and co-occurred frequently and showed some specificity to COVID-19, though they were also observed after influenza. Different long-COVID clinical profiles were observed based on demographics and illness severity.


Conflict of interest statement

I have read the journal’s policy and the authors of this manuscript have the following competing interests: SL is an employee of TriNetX Inc. The other authors report no interests to declare.

Figures

Fig 1
Fig 1. Incidence of each long-COVID feature in the 180 days after COVID-19.
The total length of the bars represents the incidence over the entire 1–180-day period. The contributions to this overall incidence are provided in terms of incidence of features that occurred in the 1–90-day period only (i.e., those that did not recur in the 90–180-day period), incidence of features that occurred in the 90–180 days only (i.e., those that had not already occurred in the 1–90-day period), and incidence of features that occurred in the 1–90-day period and recurred in the 90–180-day period. As can be seen by comparing the 2 darker shades of the bottom bar, 60.1% of patients with a feature recorded for the first time in the 90–180 days after diagnosis had at least one feature recorded in the first 90 days. COVID-19, Coronavirus Disease 2019.
Fig 2
Fig 2
(A, B) Kaplan–Meier curves showing the emergence of long-COVID features over 6 months (A) and specifically over the “long” phase from 3 to 6 months (B) in the cohorts of patients diagnosed with COVID-19 and the matched cohort of patients diagnosed with influenza. (C, D) HRs of individual long-COVID features comparing the cohort of patients with COVID-19 to the matched cohort of patients with influenza. *p < 0.05, **p < 0.01, ***p < 0.001. All long-COVID features are more common after COVID-19 than after influenza. For Kaplan–Meier curves of individual long-COVID features, see Fig A in S1 Fig. COVID-19, Coronavirus Disease 2019; HR, hazard ratio.
Fig 3
Fig 3
Co-occurrence of pairs of long-COVID symptoms (panels A and B, figures are percentages) and HRs for the co-occurrences relative to a matched cohort with influenza (panels C and D) for the whole 6 months (panels A and C) and the 3–6-month period (panels B and D). Higher values are shown by intensity of pink and blue shading. For example, the co-occurrence of myalgia and cognitive symptoms in the 1–180-day follow-up has a HR of 2.8, whereas the occurrence of each symptom has a HR of 1.68 and 1.81, respectively (see Fig 1). For 95% CIs, see Tables E–H in S1 Tables. CI, confidence interval; HR, hazard ratio.
Fig 4
Fig 4. The long-COVID network emerges over the 6-month period, with an increase in the average degree over time.
See text for details and Fig E in S1 Fig for a finer grained visualization (10-day intervals).
Fig 5
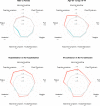
Fig 5. Spider plots summarizing the HRs for each long-COVID feature in subgroups based upon sex, age, and severity of COVID-19 as proxied by requiring hospitalization or ITU admission.
HRs are shown comparing the first named group with the second named group. HRs greater than 1 are in red; HRs less than 1 in blue. Significance indicated by asterisks, *p < 0.05, **p < 0.01, ***p < 0.001. Each comparison is based on propensity score–matched cohorts; for baseline characteristics, see Tables M-T in S1 Tables). For spider plots of all subgroup analyses, see Fig AE in S1 Fig. COVID-19, Coronavirus Disease 2019; HR, hazard ratio; ITU, intensive treatment unit.

References

    1. Callard F, Perego E. How and why patients made Long Covid. Soc Sci Med. 2021;268:113426. doi: 10.1016/j.socscimed.2020.113426 - DOI - PMC - PubMed
    1. The Lancet. Facing up to long COVID. Lancet. 2020;396:1861. doi: 10.1016/S0140-6736(20)32662-3 - DOI - PMC - PubMed
    1. Meeting the challenge of long COVID. Nat Med. 2020;26:1803. doi: 10.1038/s41591-020-01177-6 - DOI - PubMed
    1. Nalbandian A, Sehgal K, Gupta A, Madhavan MV, McGroder C, Stevens JS, et al.. Post-acute COVID-19 syndrome. Nat Med. 2021;27:601–15. doi: 10.1038/s41591-021-01283-z - DOI - PMC - PubMed
    1. Del Rio C, Collins LF, Malani P. Long-term Health Consequences of COVID-19. JAMA. 2020. doi: 10.1001/jama.2020.19719 - DOI - PMC - PubMed

Publication types

MeSH terms