

Predictive symptoms for COVID-19 in the community: REACT-1 study of over 1 million people
- PMID: 34582457
- PMCID: PMC8478234
- DOI: 10.1371/journal.pmed.1003777
Predictive symptoms for COVID-19 in the community: REACT-1 study of over 1 million people
Abstract
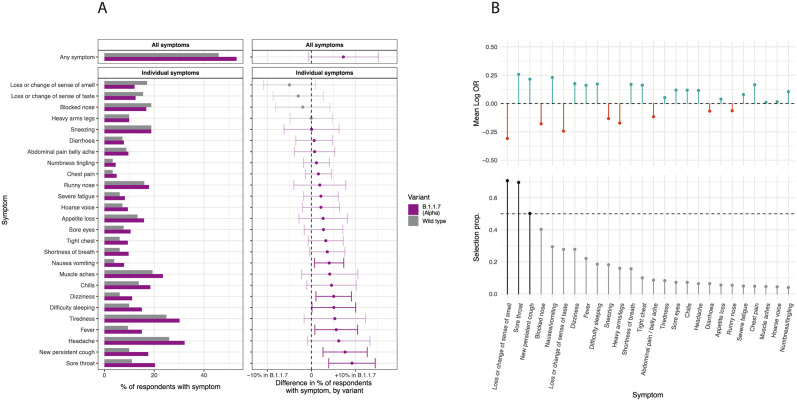
Background: Rapid detection, isolation, and contact tracing of community COVID-19 cases are essential measures to limit the community spread of severe acute respiratory syndrome coronavirus 2 (SARS-CoV-2). We aimed to identify a parsimonious set of symptoms that jointly predict COVID-19 and investigated whether predictive symptoms differ between the B.1.1.7 (Alpha) lineage (predominating as of April 2021 in the US, UK, and elsewhere) and wild type.
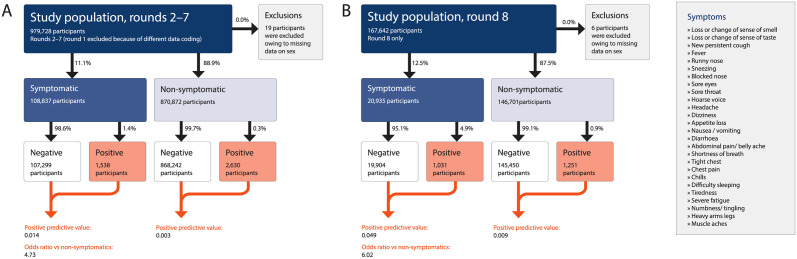
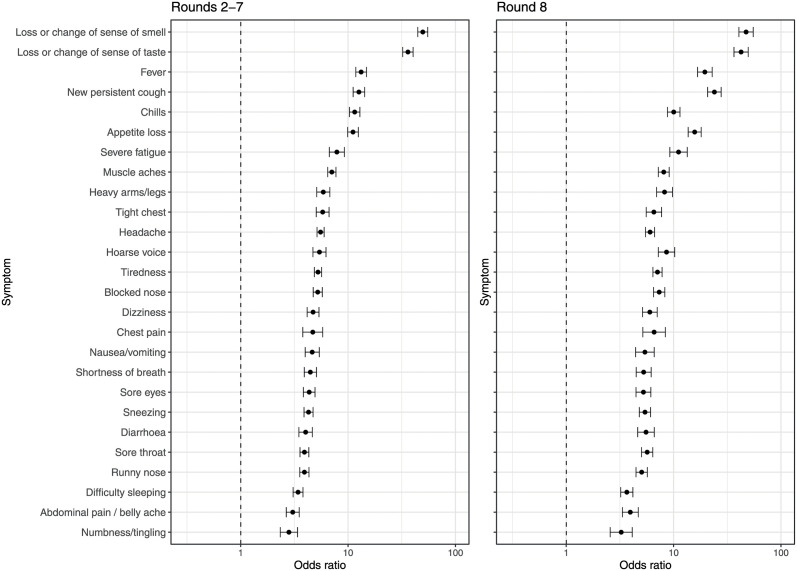
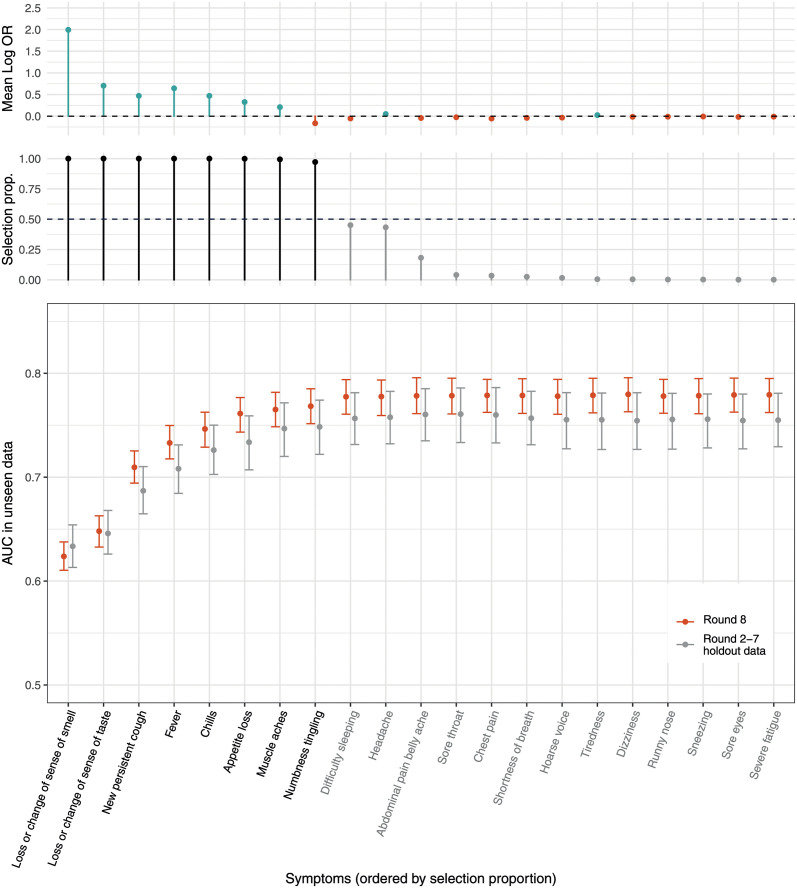
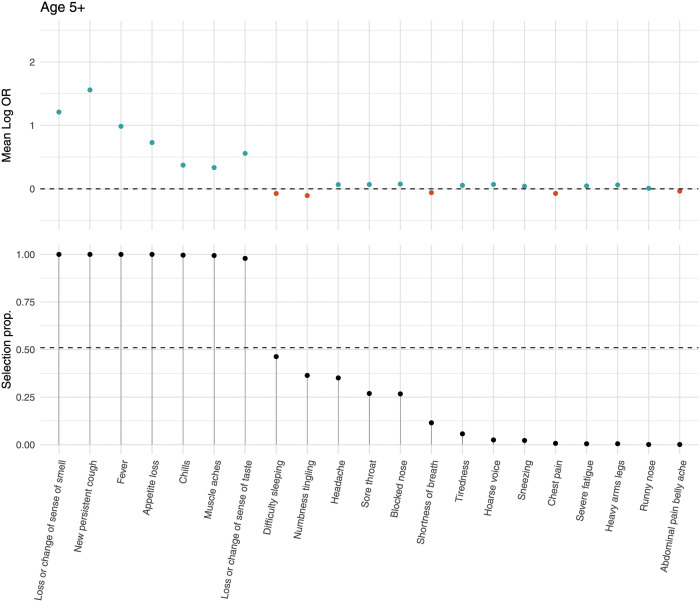
Methods and findings: We obtained throat and nose swabs with valid SARS-CoV-2 PCR test results from 1,147,370 volunteers aged 5 years and above (6,450 positive cases) in the REal-time Assessment of Community Transmission-1 (REACT-1) study. This study involved repeated community-based random surveys of prevalence in England (study rounds 2 to 8, June 2020 to January 2021, response rates 22%-27%). Participants were asked about symptoms occurring in the week prior to testing. Viral genome sequencing was carried out for PCR-positive samples with N-gene cycle threshold value < 34 (N = 1,079) in round 8 (January 2021). In univariate analysis, all 26 surveyed symptoms were associated with PCR positivity compared with non-symptomatic people. Stability selection (1,000 penalized logistic regression models with 50% subsampling) among people reporting at least 1 symptom identified 7 symptoms as jointly and positively predictive of PCR positivity in rounds 2-7 (June to December 2020): loss or change of sense of smell, loss or change of sense of taste, fever, new persistent cough, chills, appetite loss, and muscle aches. The resulting model (rounds 2-7) predicted PCR positivity in round 8 with area under the curve (AUC) of 0.77. The same 7 symptoms were selected as jointly predictive of B.1.1.7 infection in round 8, although when comparing B.1.1.7 with wild type, new persistent cough and sore throat were more predictive of B.1.1.7 infection while loss or change of sense of smell was more predictive of the wild type. The main limitations of our study are (i) potential participation bias despite random sampling of named individuals from the National Health Service register and weighting designed to achieve a representative sample of the population of England and (ii) the necessary reliance on self-reported symptoms, which may be prone to recall bias and may therefore lead to biased estimates of symptom prevalence in England.
Conclusions: Where testing capacity is limited, it is important to use tests in the most efficient way possible. We identified a set of 7 symptoms that, when considered together, maximize detection of COVID-19 in the community, including infection with the B.1.1.7 lineage.
Conflict of interest statement
I have read the journal’s policy and the authors of this manuscript have the following competing interests: PE is the director of the MRC Centre of Environment and Health (MR/L01341X/1 and MC/S019669/1) and has no conflict of interest to disclose. M C-H holds shares in the O-SMOSE company and has no conflict of interest to disclose. Consulting activities conducted by the company are independent of the present work. All other authors have no conflict of interest to disclose.
Figures
References
-
- World Health Organization. Contact tracing in the context of COVID-19. Geneva: World Health Organization; 2021. [cited 2021 Sep 3]. https://www.who.int/publications/i/item/contact-tracing-in-the-context-o....
-
- Centers for Disease Control and Prevention. Symptoms of COVID-19. Atlanta: Centers for Disease Control and Prevention; 2021. [cited 2021 Sep 3]. https://www.cdc.gov/coronavirus/2019-ncov/symptoms-testing/symptoms.html.
Publication types
MeSH terms
Grants and funding
LinkOut - more resources
Full Text Sources
Other Literature Sources
Medical
Miscellaneous
