. 2021 Oct 6;109(19):3088-3103.e5.
doi: 10.1016/j.neuron.2021.09.001. Epub 2021 Sep 27.

Single-nucleus transcriptome analysis reveals cell-type-specific molecular signatures across reward circuitry in the human brain

Affiliations

Single-nucleus transcriptome analysis reveals cell-type-specific molecular signatures across reward circuitry in the human brain

Matthew N Tran et al. Neuron. .

Abstract

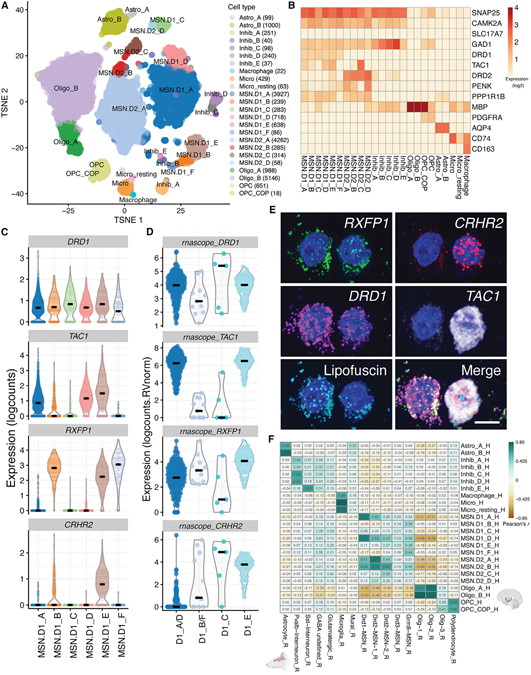
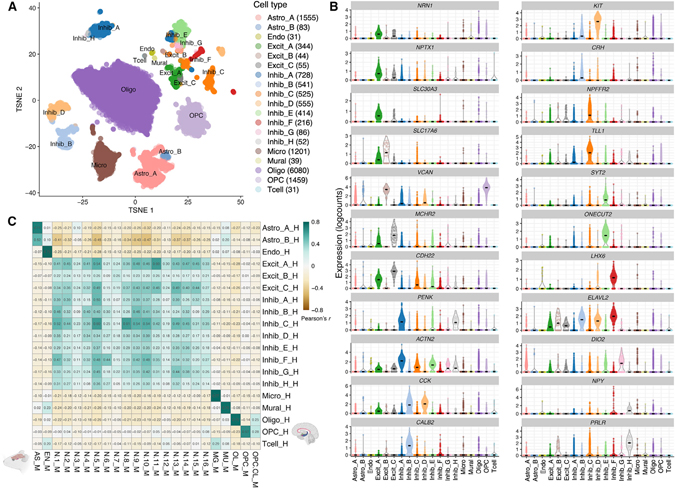
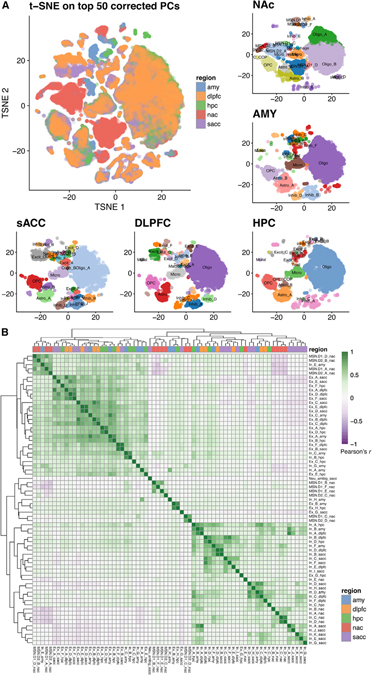
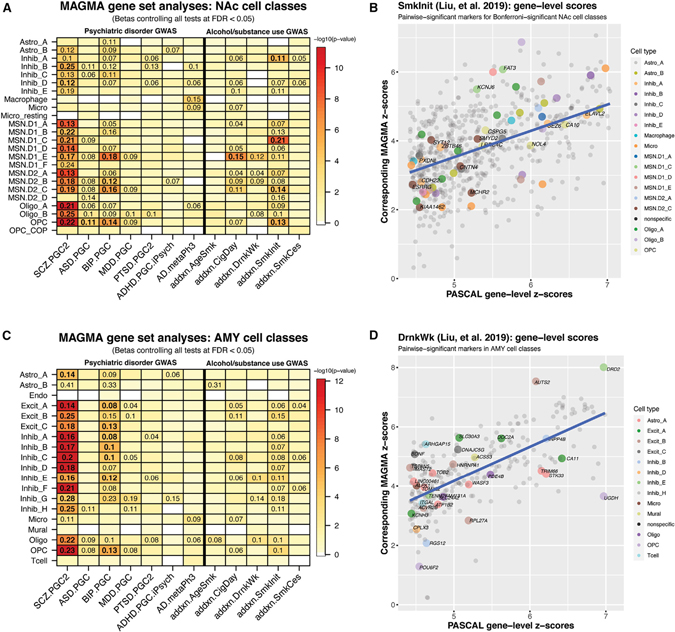
Single-cell gene expression technologies are powerful tools to study cell types in the human brain, but efforts have largely focused on cortical brain regions. We therefore created a single-nucleus RNA-sequencing resource of 70,615 high-quality nuclei to generate a molecular taxonomy of cell types across five human brain regions that serve as key nodes of the human brain reward circuitry: nucleus accumbens, amygdala, subgenual anterior cingulate cortex, hippocampus, and dorsolateral prefrontal cortex. We first identified novel subpopulations of interneurons and medium spiny neurons (MSNs) in the nucleus accumbens and further characterized robust GABAergic inhibitory cell populations in the amygdala. Joint analyses across the 107 reported cell classes revealed cell-type substructure and unique patterns of transcriptomic dynamics. We identified discrete subpopulations of D1- and D2-expressing MSNs in the nucleus accumbens to which we mapped cell-type-specific enrichment for genetic risk associated with both psychiatric disease and addiction.

Keywords: addiction; brain; genomics; neuroscience; psychiatry; reward; single-cell; transcriptomics.


Conflict of interest statement

Declaration of interests A.E.J. is employed by a for-profit biotechnology startup company (company name pending), which is unrelated to the content of this manuscript. The remaining authors declare no competing interests.

Figures

Figure 1.
Figure 1.. Distinct classes of D1- and D2-expressing MSNs in human NAc
(A) t-distributed stochastic neighbor embedding (tSNE) plot of 19,789 nuclei (n = 8 donors) across 21 clusters, including 6 clusters of D1 MSNs and 4 clusters of D2 MSNs. (B) Heatmap depicting log2 expression of canonical marker genes used to annotate each cluster. (C) Violin plots for 4 genes differentially expressed (log2-normalized counts) in specific D1 classes (or class groups: CRHR2, DRD1, RXFP1, and TAC1) that were selected for validation using single-molecule fluorescence in situ hybridization (smFISH). (D) Log2 expression of respective transcript counts per smFISH region of interest (ROI) (ROI size normalized) post lipofuscin masking (autofluorescence). Each DRD1+ ROI was classified into a Euclidean distance-predicted MSN class (or group of classes) and its/their respective expression. (E) Multiplex smFISH in human NAc depicting a D1_C (left) and D1_E (right) MSN, side by side. Maximum intensity confocal projections showing the expression of DAPI (nuclei), CRHR2, DRD1, TAC1, and lipofuscin autofluorescence. Merged image without lipofuscin autofluorescence. Scale bar, 10 μm. (F) Heatmap of Pearson correlation values evaluating the relationship between our human-derived NAc cell classes (rows) and reported rat NAc populations from Savell et al. (2020). Correlation was performed on the combined top 100 markers/cell populations in which annotated homology exists (here, 582 genes; see STAR Methods).
Figure 2.
Figure 2.. Atlas of molecularly defined cell types in human AMY
(A) tSNE plot of 14,039 nuclei across 19 clusters, including 3 clusters of excitatory neurons and 8 clusters of GABAergic inhibitory neurons. (B) Expression violin plots for the top genes for each of the neuronal classes (log2-normalized counts). (C) Heatmap of Pearson correlation values evaluating the relationship between our human-derived AMY cell classes (rows) versus the cell populations reported in Chen et al. (2019), derived from mouse medial amygdala (MeA). Correlation was performed on the combined top 100 markers/cell populations in which annotated homology exists (here, 480 genes; see STAR Methods).
Figure 3.
Figure 3.. Across-regions analyses reveal whole-brain transcriptomic architecture and neuronal subtype similarities across regions
(A) tSNE array of a total of 70,615 nuclei, paneled by each brain region and their regionally defined cell classes (a total of 107 cell classes). (B) Pairwise correlation of t-statistics, comparing the top cell class marker genes of the 107 classes (total of 3,715 genes). Here, only the 69 neuronal classes are shown. Regions are colored and labeled in lowercase as the suffix (e.g., as “_hpc” for HPC); “Excit_” is abbreviated as “Ex_” and “Inhib_” as “In_.” Scale values are of Pearson correlation coefficient (r), which are printed in each cell in the version shown in Figure S11.
Figure 4.
Figure 4.. Genetic associations of NAc and AMY cell populations with psychiatric disease and addiction phenotypes
(A) MAGMA associations of 12 GWAS for each of 24 cell classes profiled in human NAc. (B) MAGMA-computed, gene-level Z scores, compared to their reported significant PASCAL scores, for “SmkInit” from Liu et al. (2019). Genes are colored if they were statistically significant for pairwise marker tests, for the corresponding NAc cell class, and additionally labeled if that cell class was Bonferroni significant in MAGMA association with the phenotype. (C) MAGMA associations for each of 16 cell classes profiled in human AMY. (D) Same as (B) but for “DrnkWk” and colored/labeled by AMY pairwise cell class markers (no MAGMA-gene set analysis result restriction). For the MAGMA heatmaps: displayed numbers are the effect size (b) for significant associations (controlled for false discovery rate [FDR] < 0.05), on a Z (standard normal) distribution. Bolded numbers are those that additionally satisfy a strict Bonferroni correction threshold of p < 3.89e–5. Heatmap is colored by empirical log10(p value) for each association test. AD, Alzheimer’s disease; ADHD, attention-deficit/hyperactivity disorder; ASD, autism spectrum disorder; BIP, bipolar disorder; MDD, major depressive disorder; PTSD, posttraumatic stress disorder; SCZ, schizophrenia. The suffix for these (e.g., “.PGC2”) reference the specific study (see STAR Methods). For the Liu et al. (2019) phenotypes: “addxn.,” addiction; “AgeSmk,” age of initiation of regular smoking; “CigDay,” number of cigarettes per day; “DrnkWk,” number of drinks per week; “SmkInit,” whether regular smoking was ever reported (binary variable); “SmkCes,” if so, had an individual stopped smoking (binary variable).

References

    1. Amezquita RA, Lun ATL, Becht E, Carey VJ, Carpp LN, Geistlinger L, Marini F, Rue-Albrecht K, Risso D, Soneson C, et al. (2020). Orchestrating single-cell analysis with Bioconductor. Nat. Methods 17, 137–145. - PMC - PubMed
    1. Babaev O, Piletti Chatain C, and Krueger-Burg D (2018). Inhibition in the amygdala anxiety circuitry. Exp. Mol. Med. 50, 1–16. - PMC - PubMed
    1. Barger N, Stefanacci L, Schumann CM, Sherwood CC, Annese J, Allman JM, Buckwalter JA, Hof PR, and Semendeferi K (2012). Neuronal populations in the basolateral nuclei of the amygdala are differentially increased in humans compared with apes: a stereological study. J. Comp. Neurol. 520, 3035–3054. - PMC - PubMed
    1. Batiuk MY, Martirosyan A, Wahis J, de Vin F, Marneffe C, Kusserow C, Koeppen J, Viana JF, Oliveira JF, Voet T, et al. (2020). Identification of region-specific astrocyte subtypes at single cell resolution. Nat. Commun. 11, 1220. - PMC - PubMed
    1. Benjamini Y, and Hochberg Y (1995). Controlling the False Discovery Rate: A Practical and Powerful Approach to Multiple Testing. J. R. Stat. Soc. B 57, 289–300.

Publication types

Substances

LinkOut - more resources