. 2021 Oct 14;184(21):5357-5374.e22.
doi: 10.1016/j.cell.2021.09.006. Epub 2021 Sep 27.

In vivo CRISPR screens identify the E3 ligase Cop1 as a modulator of macrophage infiltration and cancer immunotherapy target

Affiliations

In vivo CRISPR screens identify the E3 ligase Cop1 as a modulator of macrophage infiltration and cancer immunotherapy target

Xiaoqing Wang et al. Cell. .

Abstract

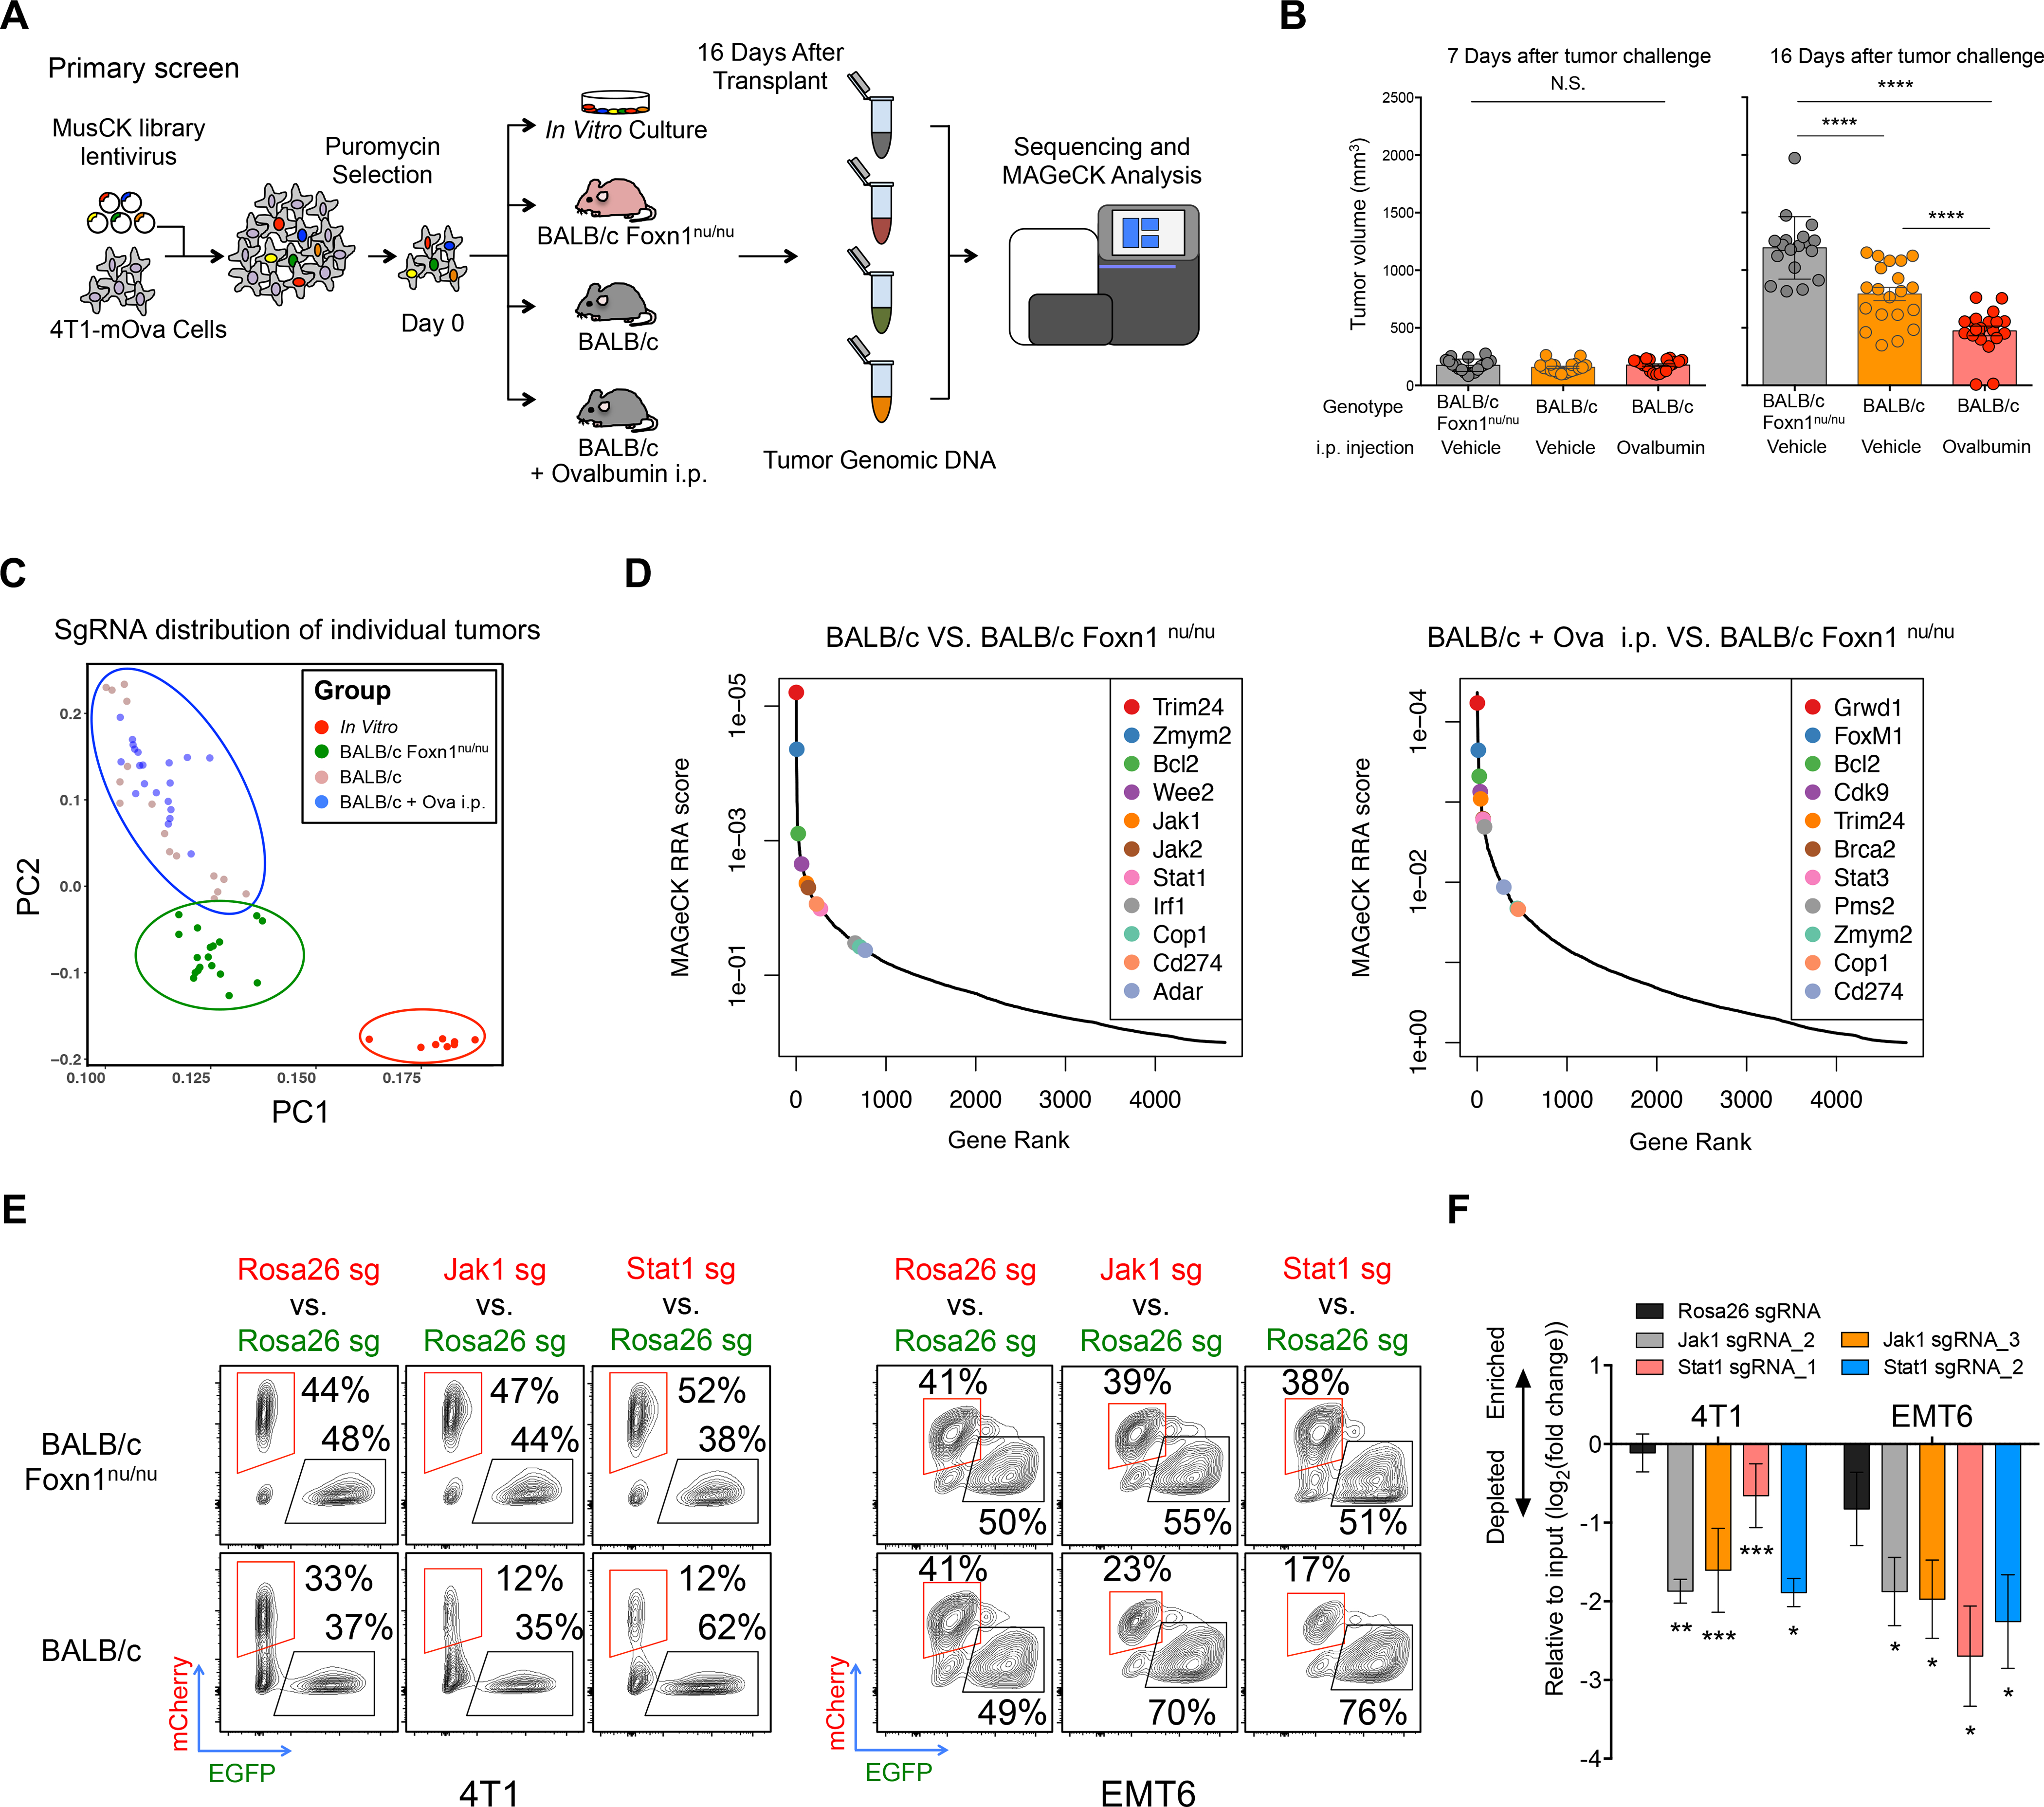
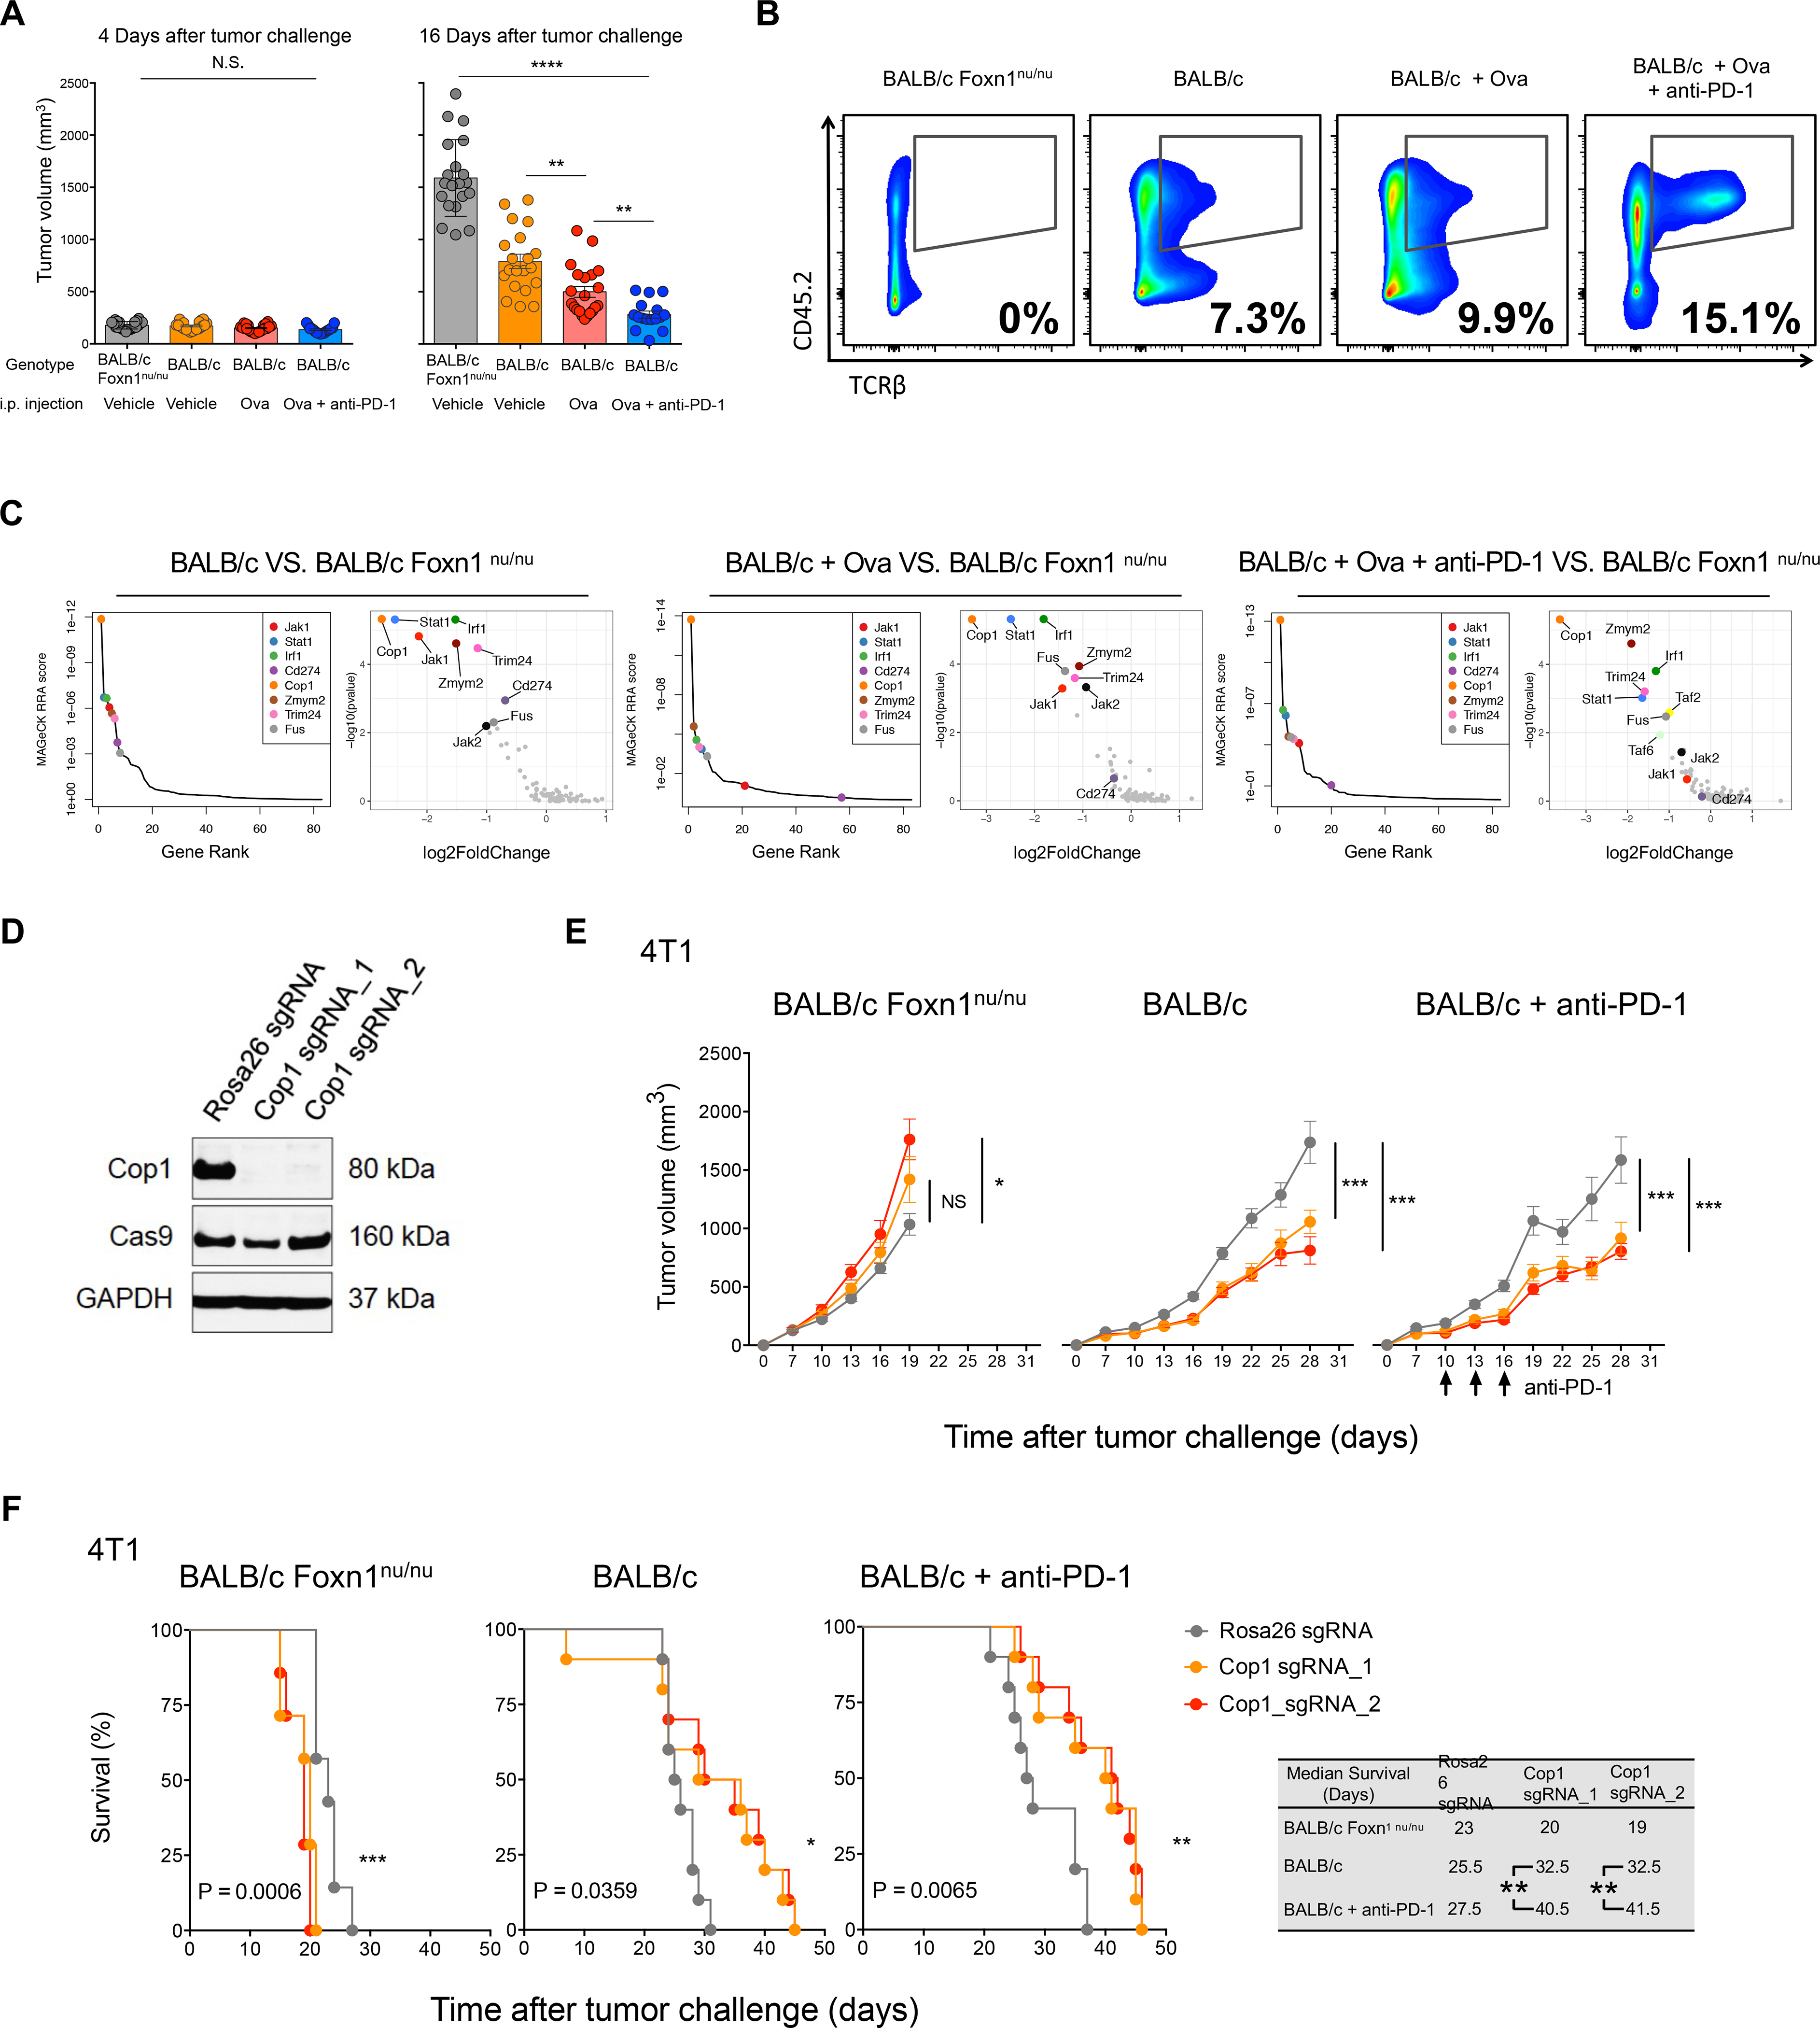
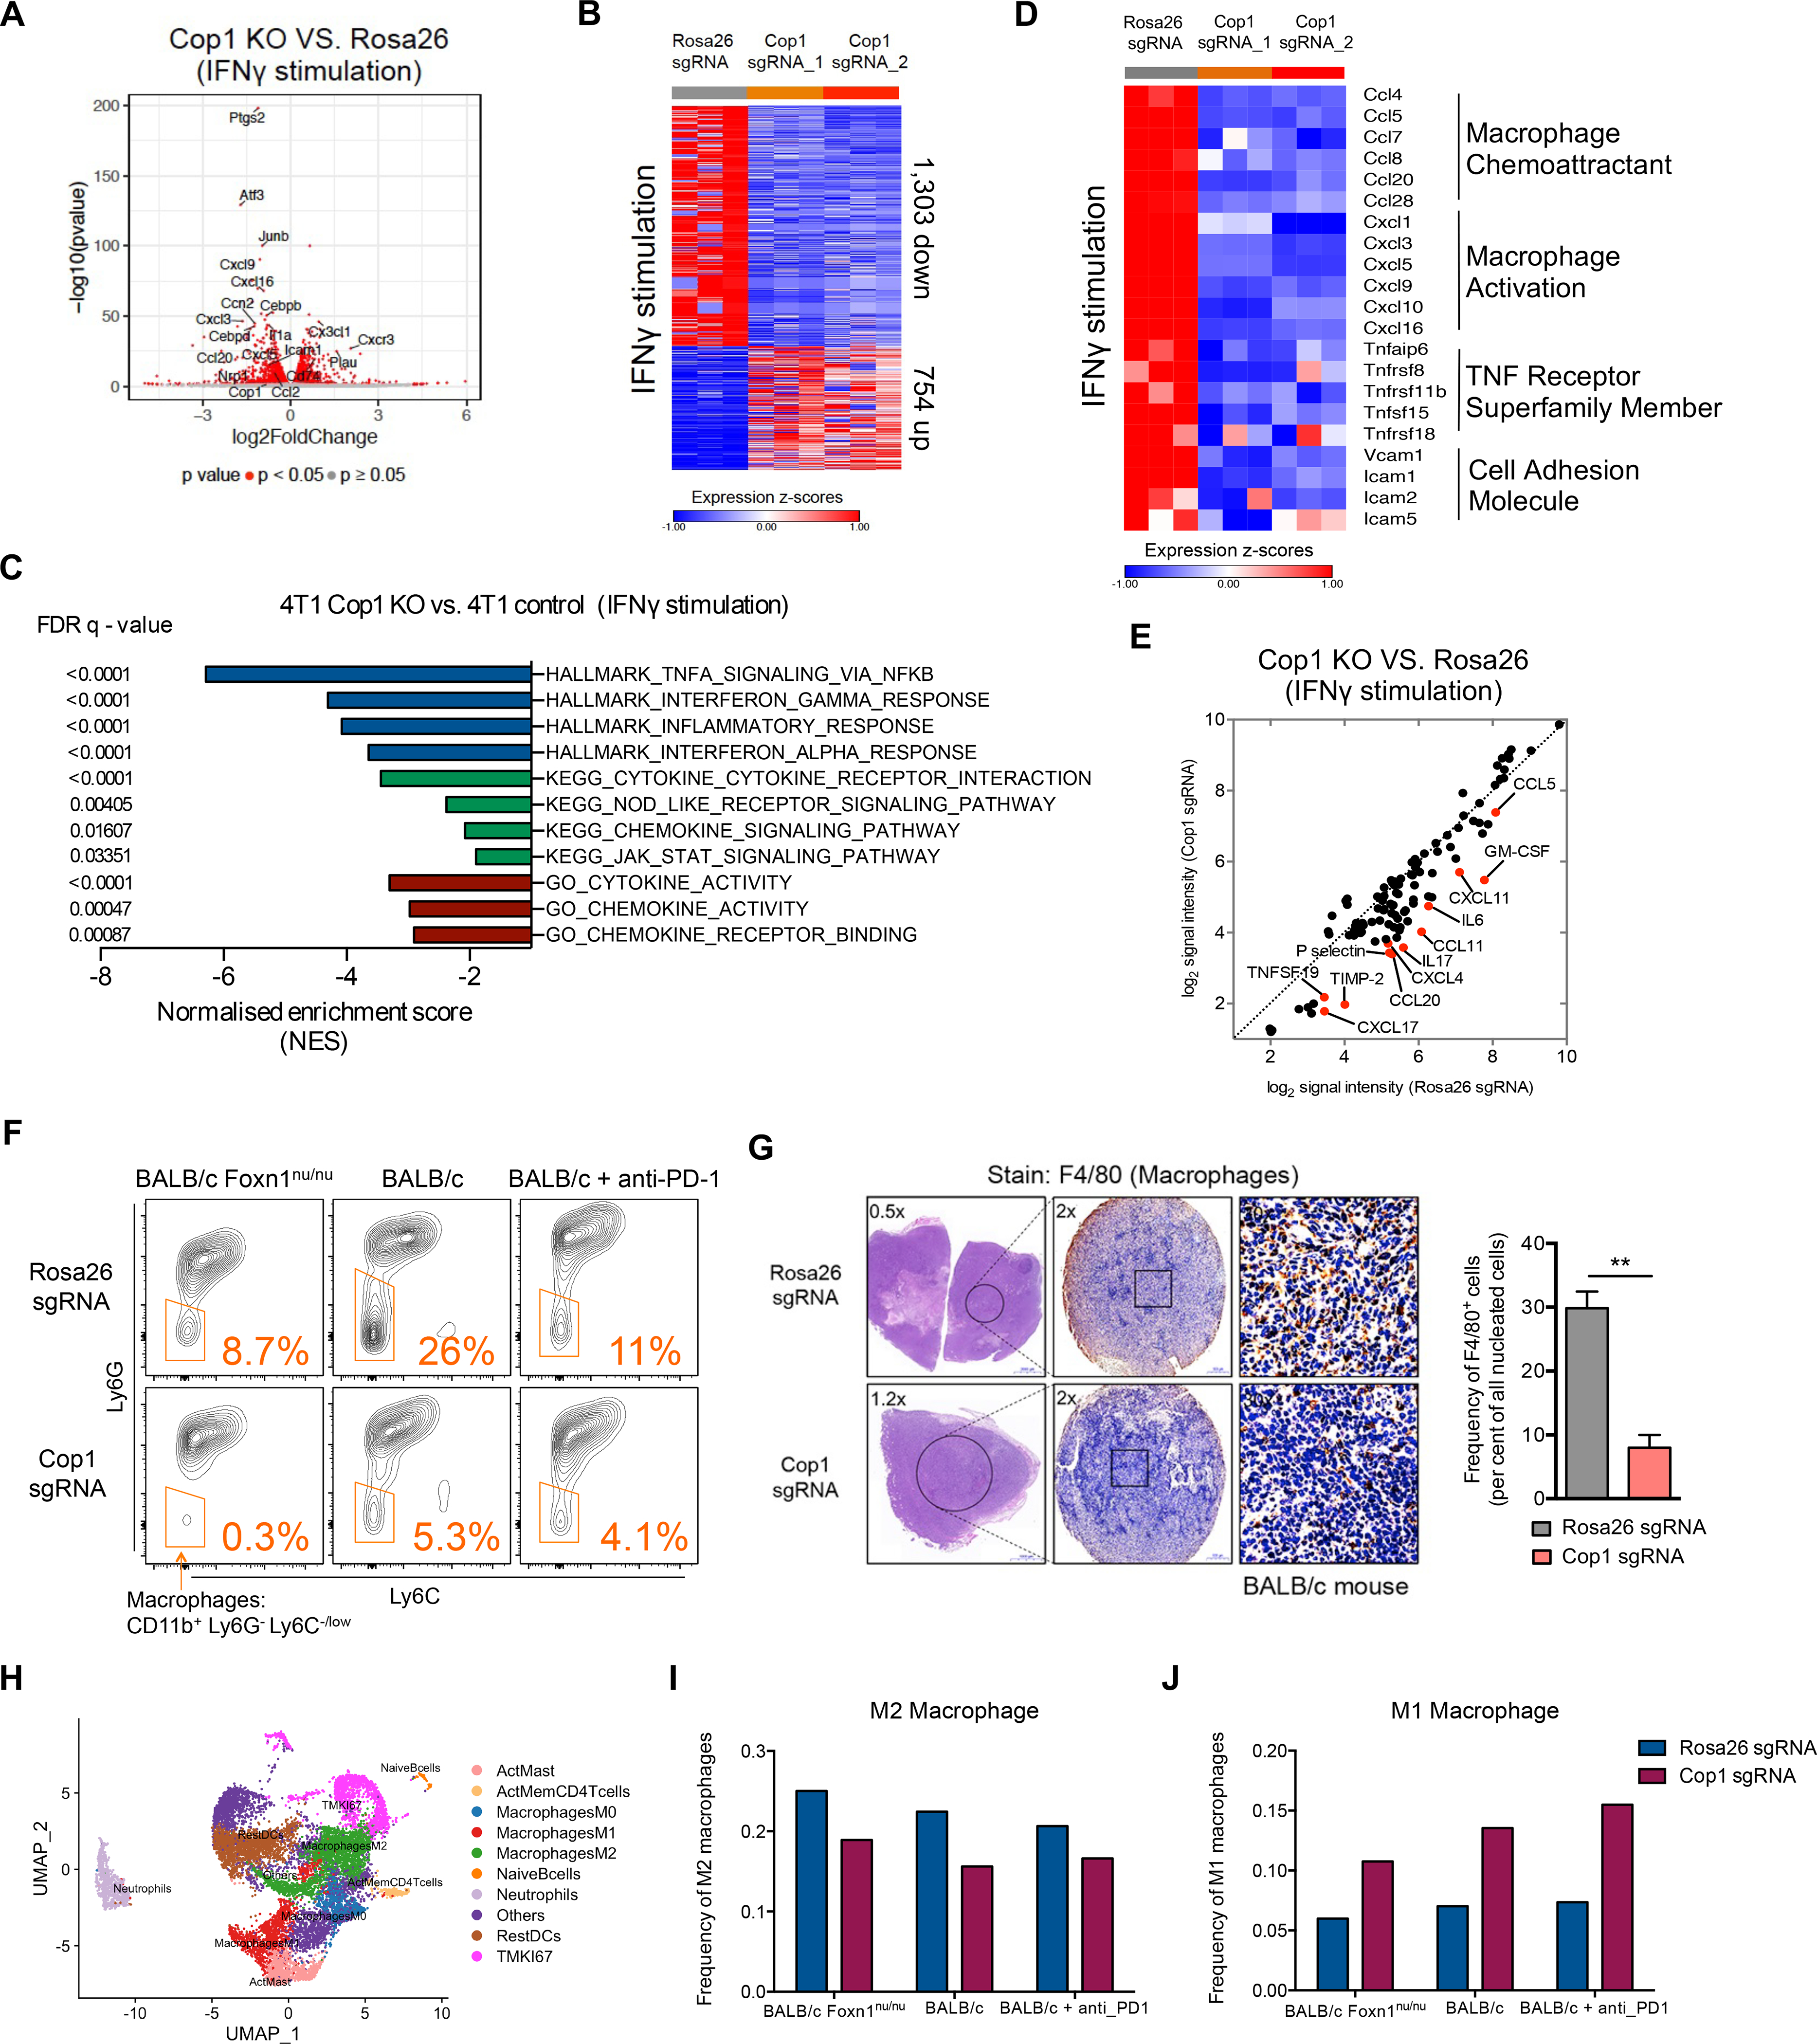
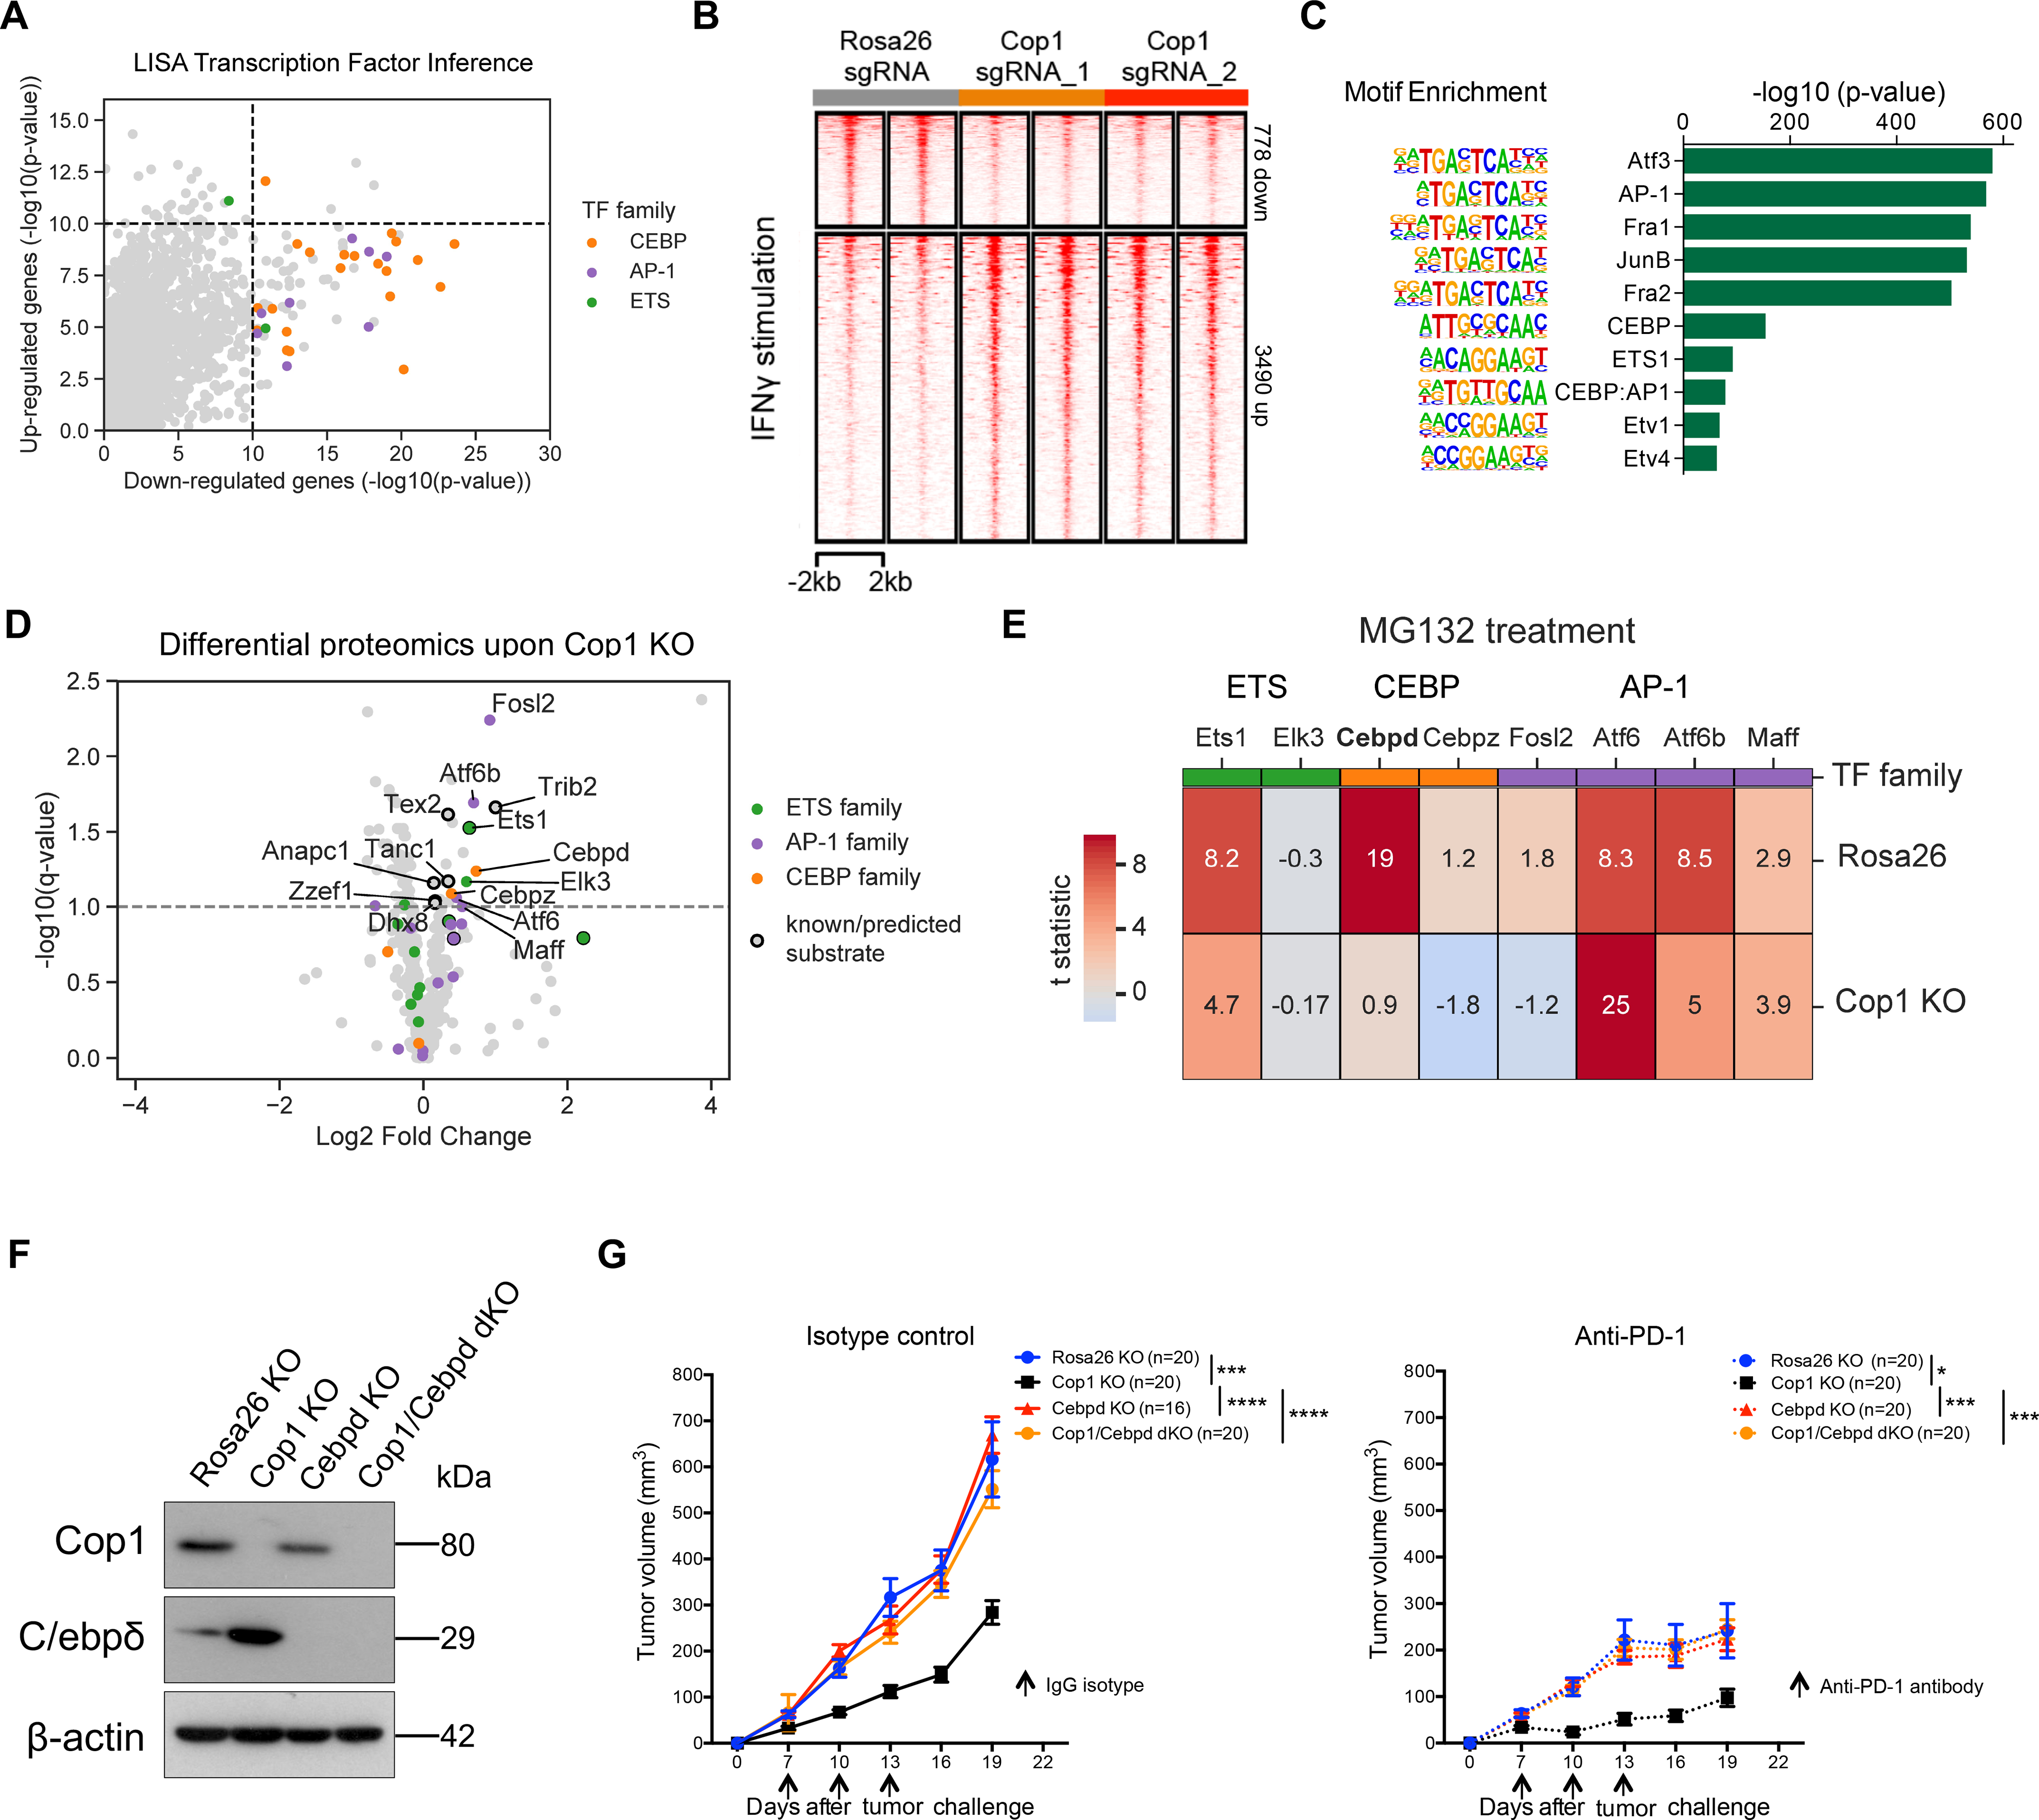
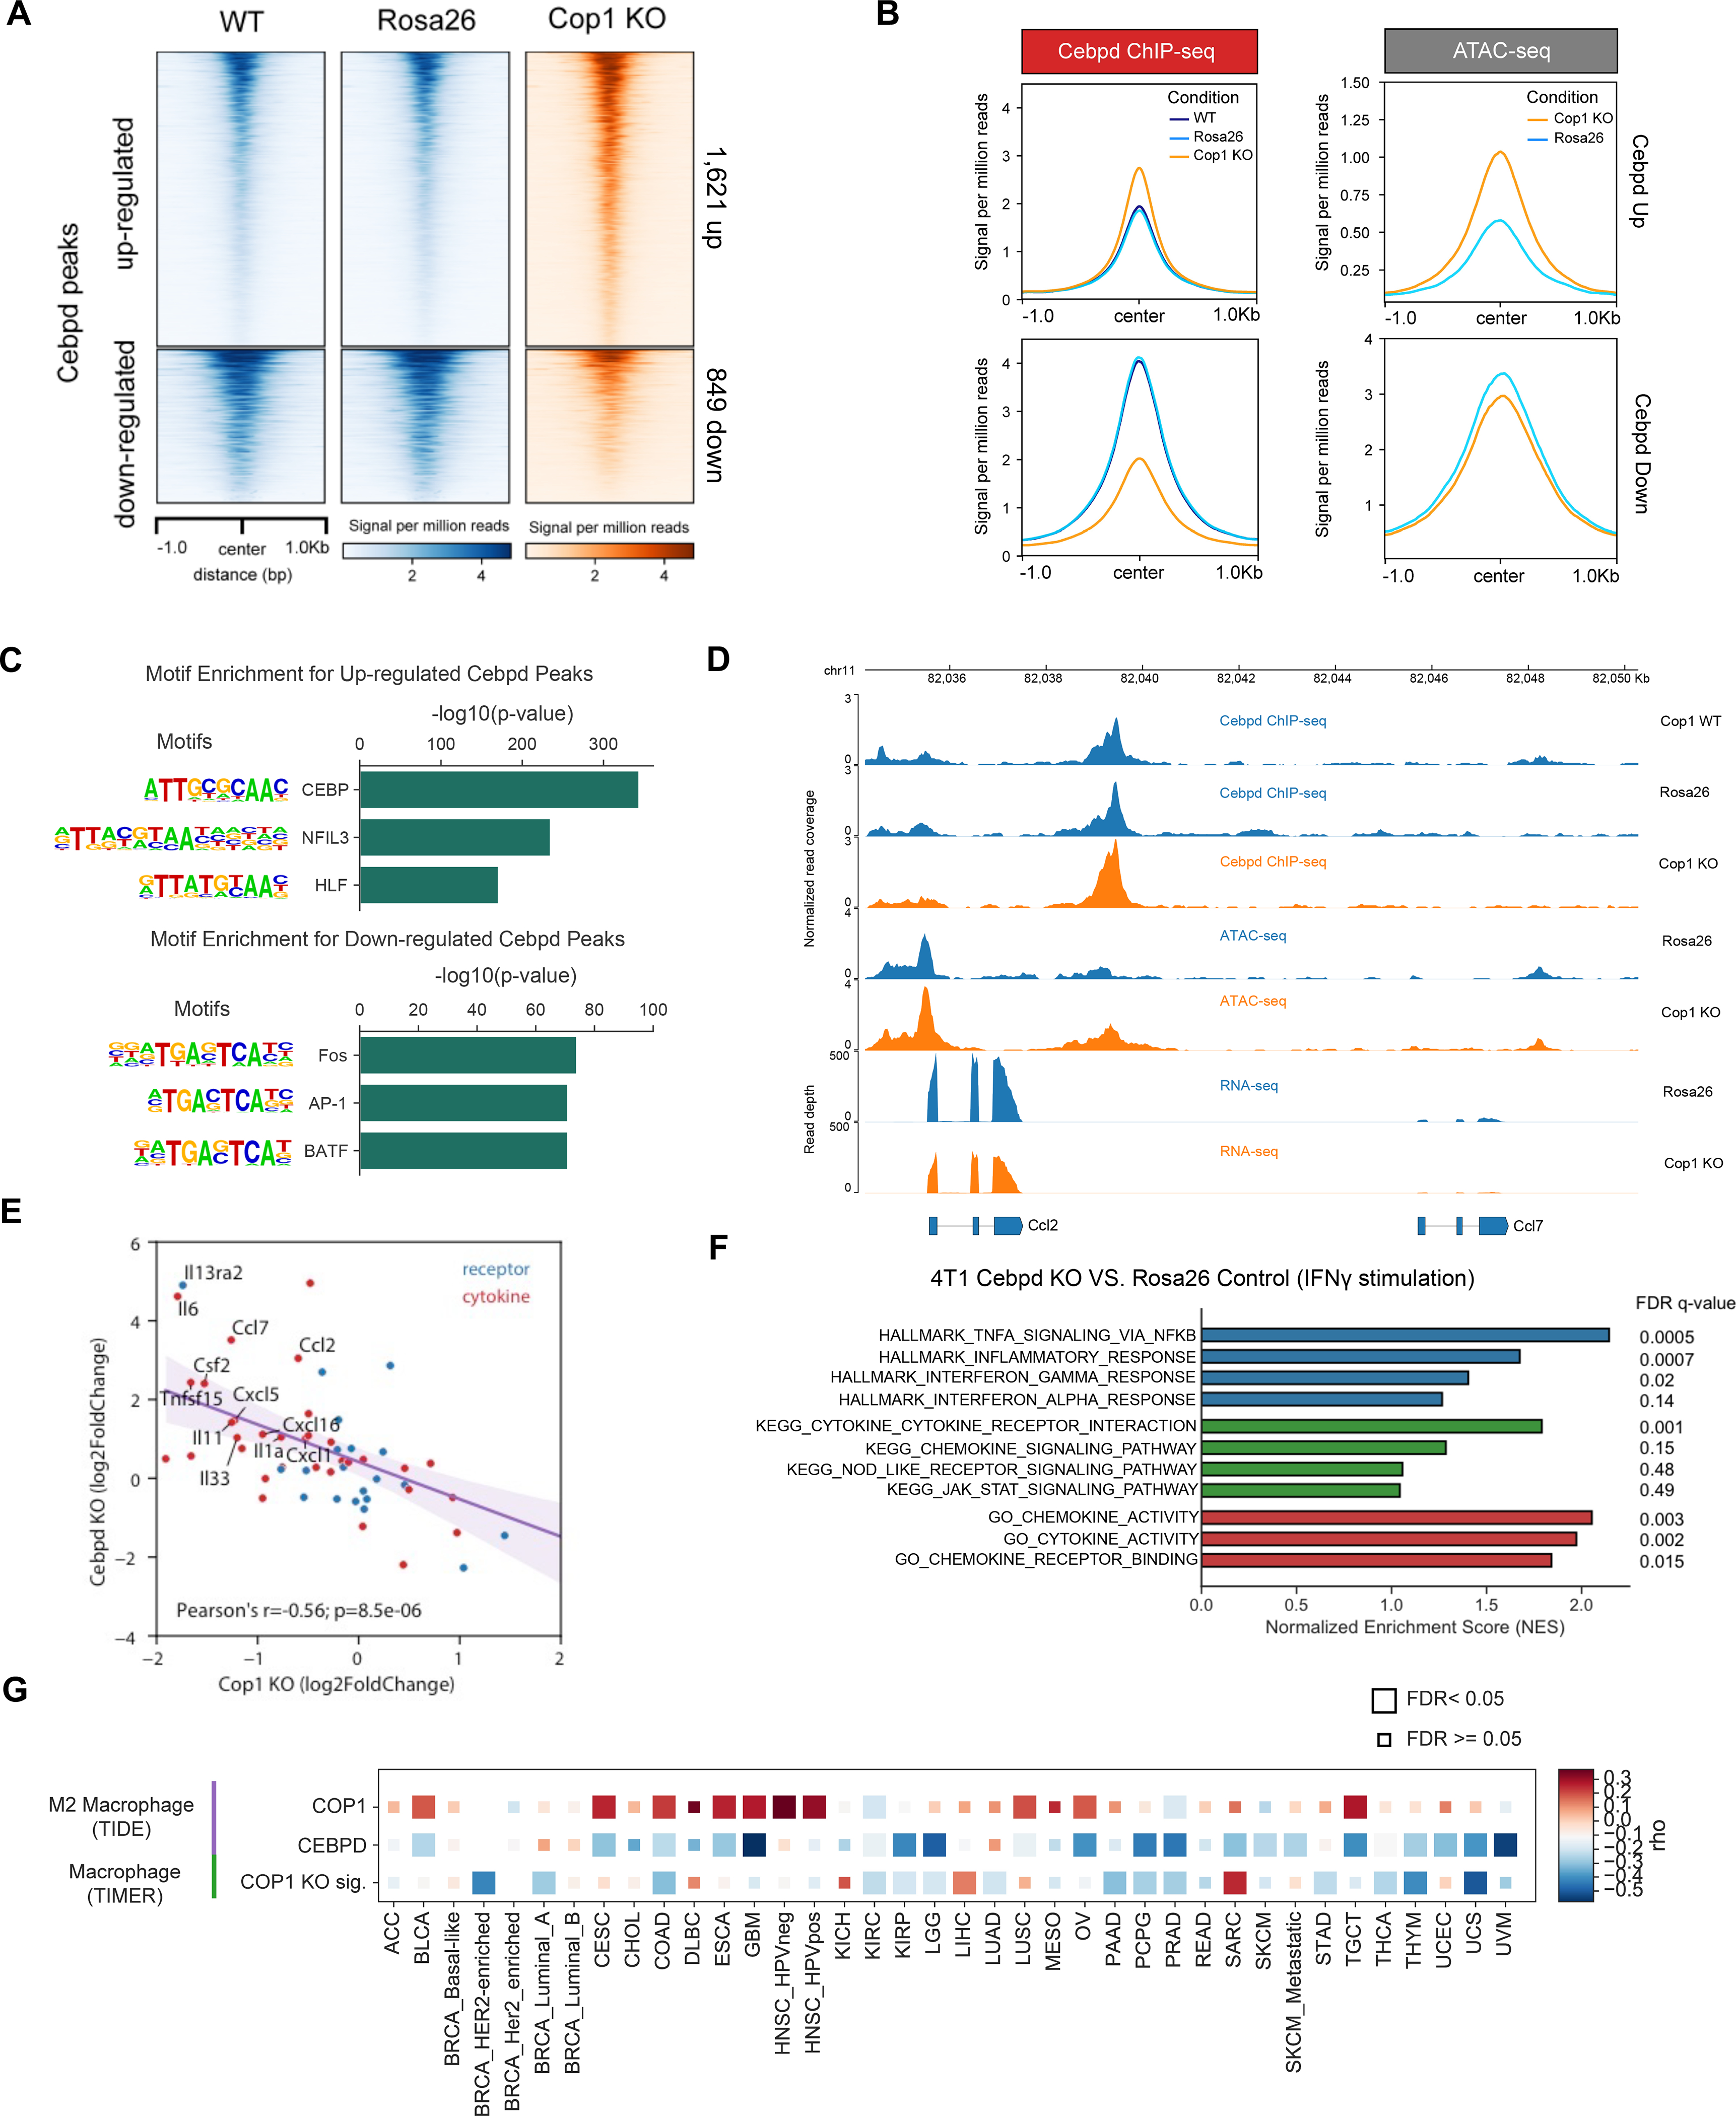
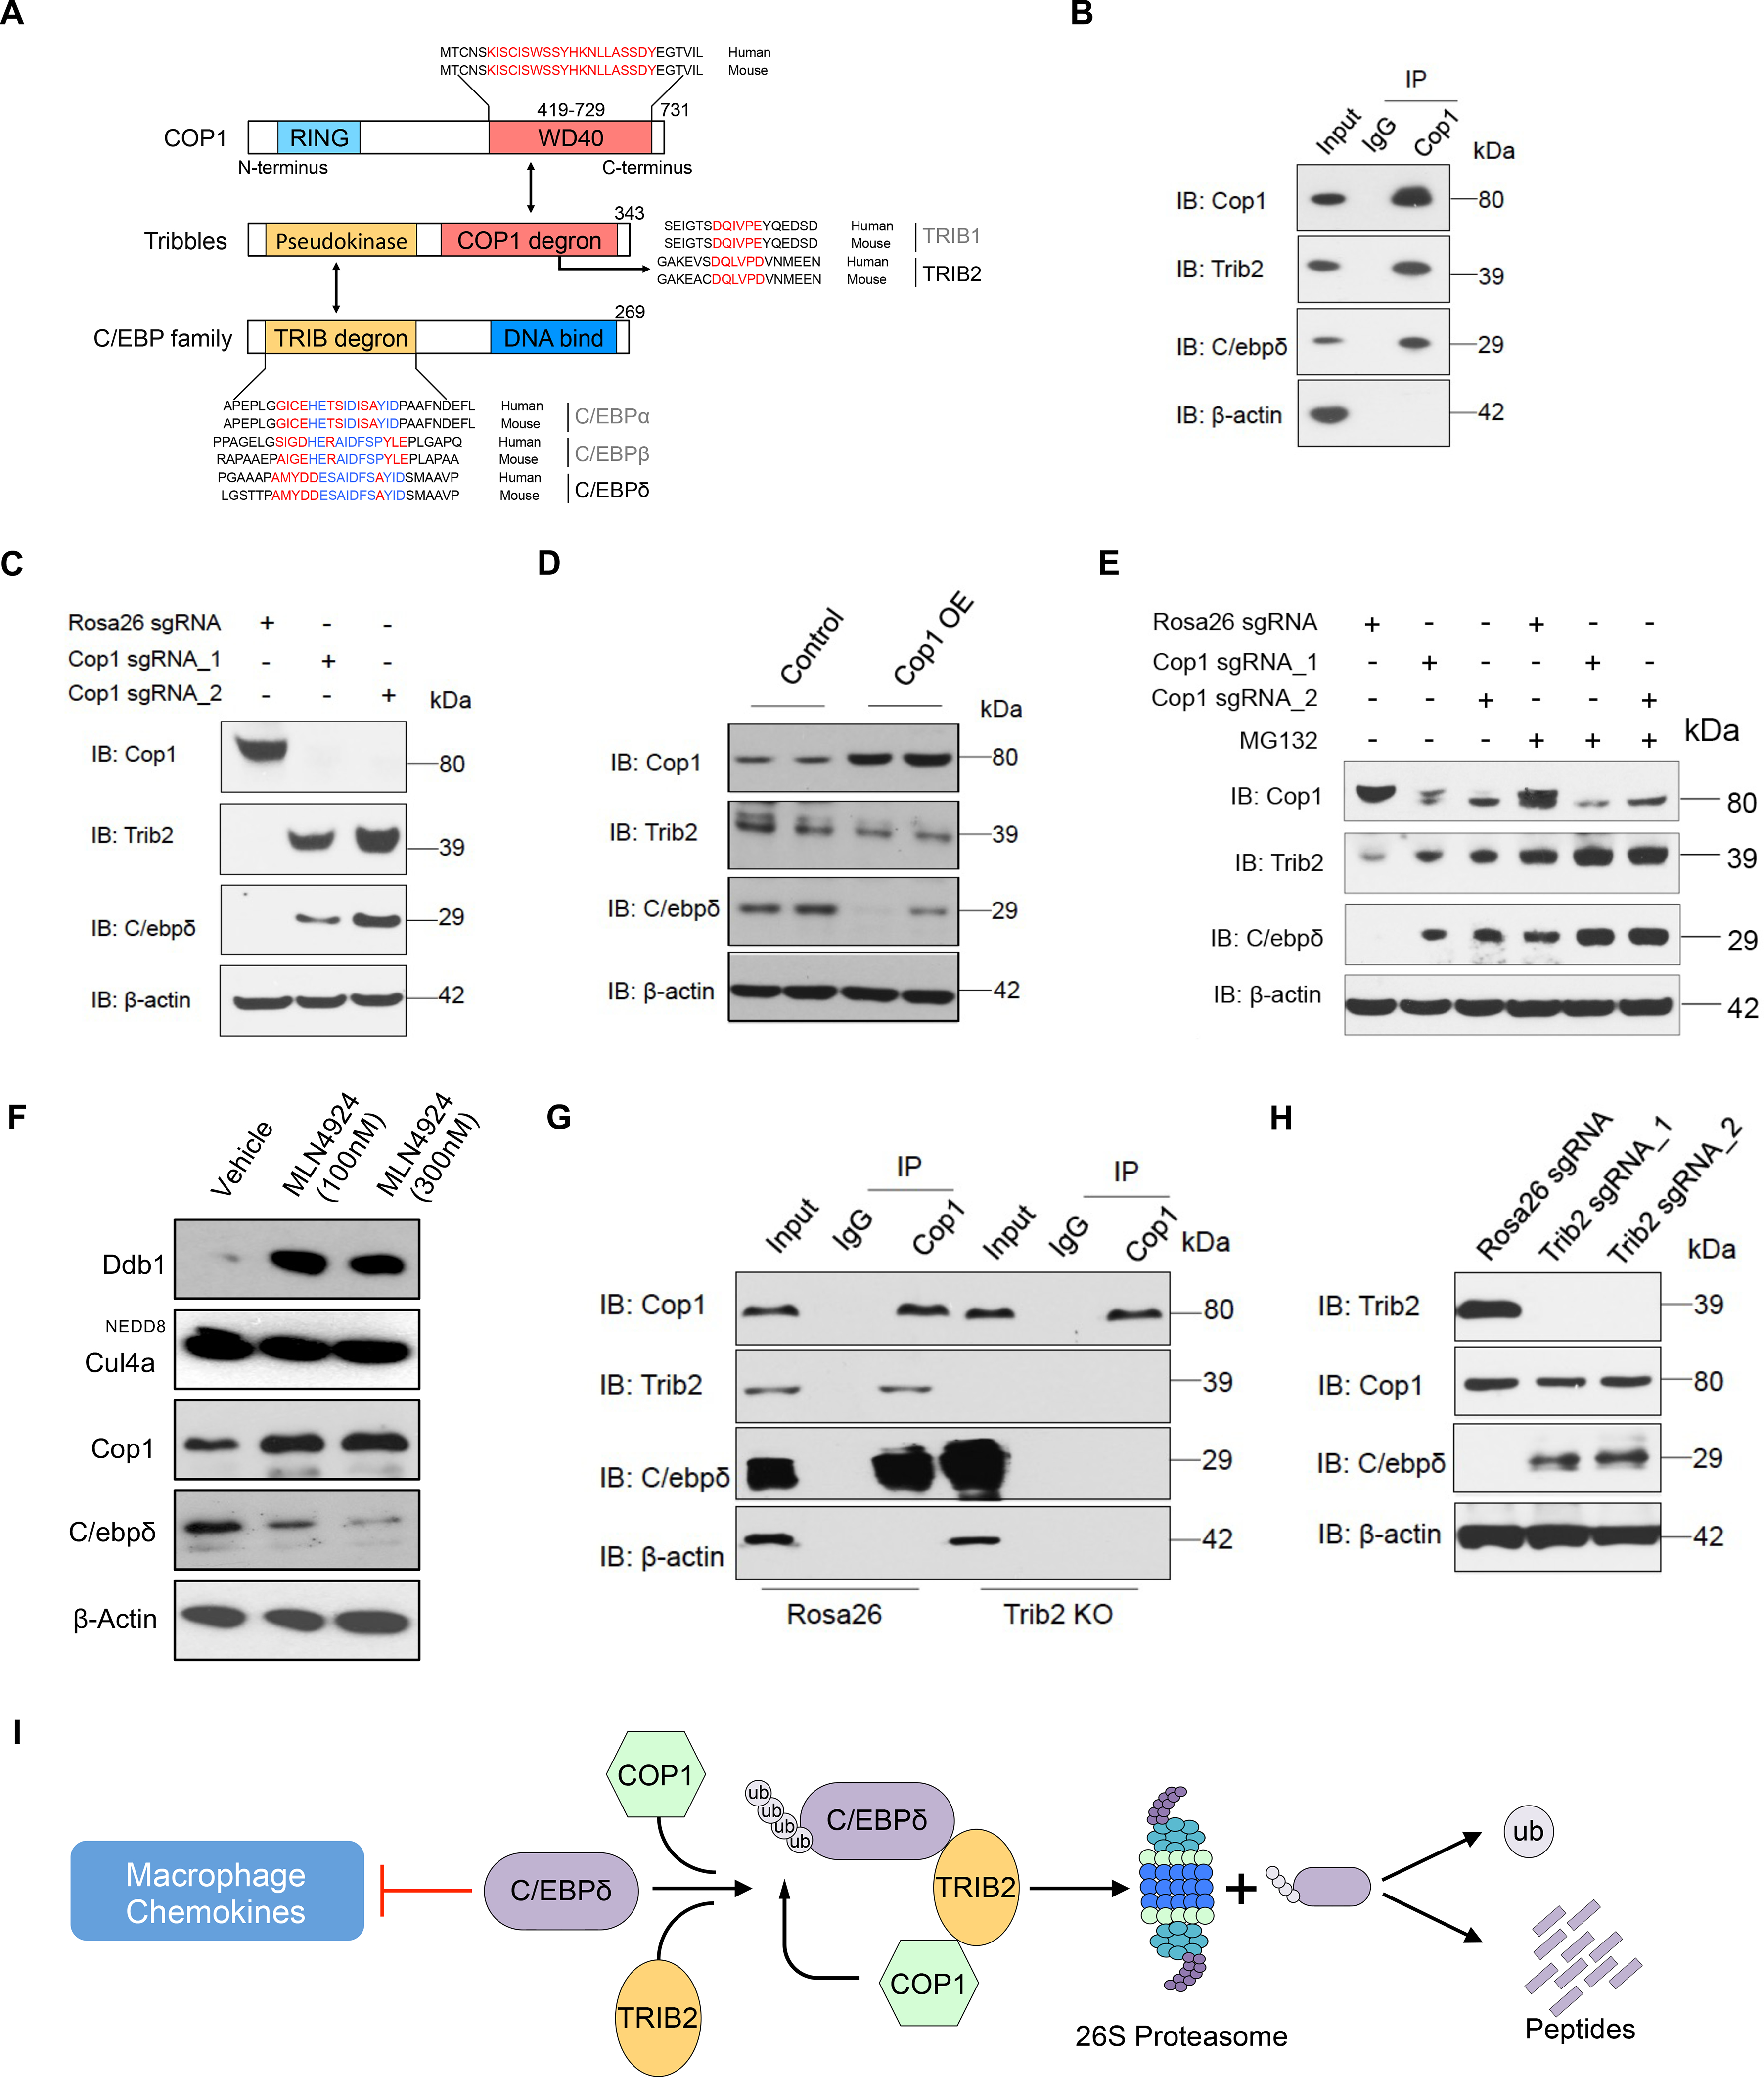
Despite remarkable clinical efficacy of immune checkpoint blockade (ICB) in cancer treatment, ICB benefits for triple-negative breast cancer (TNBC) remain limited. Through pooled in vivo CRISPR knockout (KO) screens in syngeneic TNBC mouse models, we found that deletion of the E3 ubiquitin ligase Cop1 in cancer cells decreases secretion of macrophage-associated chemokines, reduces tumor macrophage infiltration, enhances anti-tumor immunity, and strengthens ICB response. Transcriptomics, epigenomics, and proteomics analyses revealed that Cop1 functions through proteasomal degradation of the C/ebpδ protein. The Cop1 substrate Trib2 functions as a scaffold linking Cop1 and C/ebpδ, which leads to polyubiquitination of C/ebpδ. In addition, deletion of the E3 ubiquitin ligase Cop1 in cancer cells stabilizes C/ebpδ to suppress expression of macrophage chemoattractant genes. Our integrated approach implicates Cop1 as a target for improving cancer immunotherapy efficacy in TNBC by regulating chemokine secretion and macrophage infiltration in the tumor microenvironment.

Keywords: C/ebpδ; CRISPR screening; Cop1; E3 ubiquitin ligase; immunotherapy; triple-negative breast cancer.


Conflict of interest statement

Declaration of interests X.S.L. is a cofounder, board member, scientific advisor board member, and consultant of GV20 Oncotherapy and a stockholder of BMY, TMO, WBA, ABT, ABBV, and JNJ and receives research funding from Takeda, Sanofi, Bristol Myers Squibb, and Novartis. M.B. receives sponsored research support from and is a consultant to Novartis. M.B. serves on the scientific advisory boards of GV20 Oncotherapy, Kronos Bio, and H3 Biomedicine. T.X. is a cofounder, board member, and full-time employee of GV20 Oncotherapy.

Figures

Figure 1.
Figure 1.. In Vivo Screens with the MusCK Library Uncover Classic and Novel Regulators of Immune Evasion.
(A) Workflow of MusCK in vivo screens to identify the potential targets for immune evasion. i.p. = intraperitoneal. (B) Tumor volume measured at 7 and 16 days post implantation in the MusCK screens. Data are shown as mean ± SEM, n = 10–12 mice per group, **** P < 0.0001, by one-way ANOVA with Benjamini-Hochberg multiple test correction. (C) Principal component analysis of sgRNA abundance in each condition of the MusCK screens. (D) Top depleted genes in immunocompetent versus immunodeficient (nude) hosts in the MusCK screens. (E) Flow cytometry analysis of Jak1 (or Stat1) KO cells versus control Rosa26 KO mouse breast cancer cells in the resulting 4T1 and EMT6 tumors. (F) Quantification of relative percentages calculated from flow cytometry analysis. Data are shown as mean ± SEM, n = 4–6 mice per group, *p < 0.05, **p < 0.01, ***p < 0.001, by one-way ANOVA with Benjamini-Hochberg multiple test correction.
Figure 2.
Figure 2.. Second-Round MusCK Screens Identify Cop1 as a Regulator of TNBC Progression.
(A) Tumor volume measured at 4 and 16 days post implantation in the MusCK 2.0 screens. Data are shown as mean ± SEM, n = 7–12 mice per group, **p < 0.01, * * * * P < 0.0001, by one-way ANOVA with Benjamini-Hochberg multiple test correction. (B) Flow cytometry analysis of tumor-infiltrating T cell population (TCRβ+) in the total immune cell population (Cd45.2+). (C) MAGeCK analysis and RRA ranking of top depleted genes in the MusCK 2.0 screens. Ranked dot plots of depleted genes in immunocompetent hosts compared to immunodeficient nude hosts are shown. (D) Western blot of Cop1 protein level in 4T1 mouse TNBC cells transduced with sgRNA targeting Cop1 and Rosa26. (E) Tumor volume over time in host animals implanted with Rosa26 KO and Cop1 KO 4T1 mouse TNBC cells. Data are shown as mean ± SEM, n = 10 mice per group, *p < 0.05, ***p < 0.001, by one-way ANOVA with Benjamini-Hochberg post-test multiple comparison. (F) Kaplan-Meier survival analysis of host animals bearing Rosa26 and Cop1 KO 4T1 tumors. The sgCop1 cohort with anti-PD-1 treatment survived significantly longer than the other groups. n = 10 mice per group, *p < 0.05, **p < 0.01, ***p < 0.001, by log-rank test.
Figure 3.
Figure 3.. Cop1 Is a Key Mediator of Macrophage Chemotaxis in TNBC.
(A) Volcano plot of differentially expressed genes in Cop1 KO 4T1 mouse TNBC cells compared to Rosa26 KO control cells with IFNγ stimulation (at 20 ng/mL for 24 hours). Red dots denote genes significantly (p < 0.05) differentially expressed in compared conditions. (B) Heatmap showing differential transcriptomic expression in Rosa26 KO and Cop1 KO 4T1 cells with IFNγ stimulation. (C) Gene set enrichment analysis of downregulated genes in Cop1 KO 4T1 cancer cells compared to Rosa26 KO control cells with IFNγ stimulation. Top depleted pathways in Cop1 KO cells versus Rosa26 KO control cells are shown. (D) Differential transcriptomic expression of macrophage-related genes in Rosa26 KO and Cop1 KO 4T1 cells with IFNγ stimulation. (E) Quantification of differential protein expression by cytokine array in Rosa26 KO and Cop1 KO 4T1 cells with IFNγ stimulation. (F) Flow cytometry analysis of macrophage populations in Rosa26 and Cop1 KO 4T1 tumors grown in different host conditions in vivo. The tumor-infiltrating macrophages were identified as Cd45.2+Cd11clowCd11bhighLy6ClowLy6Glow. The tumor-infiltrating myeloid cells were identified as Cd45.2+Cd11clowCd11bhigh. (G) Immunohistochemistry of sections show different macrophage infiltration in Rosa26 and Cop1 KO 4T1 tumors. The tumor-infiltrating macrophages were stained by immunohistochemistry with F4/80 antibody, a widely-used monocyte-macrophage marker in mice. n = 5 mice per group. Data are mean ± SEM **p < 0.01, by two-sample t-test. (H) UMAP plot of cells from the single cell RNA-seq samples profiled, with each cell color coded to indicate the associated cell types. (I) Frequency of M2 macrophages in all tumor-infiltrating CD45+ cells from control and Cop1-null 4T1 tumors. (J) Frequency of M1 macrophages in all tumor-infiltrating CD45+ cells from control and Cop1-null 4T1 tumors.
Figure 4.
Figure 4.. Integrative Analysis Identifies C/ebpδ Activity Is Modulated Upon Cop1 KO.
(A) LISA predicts CEBP and AP1 families of transcription factors in regulating Cop1 KO down-regulated genes. (B) Heatmap showing changes in chromatin accessibility of Rosa26 and Cop1 KO 4T1 cancer cells with IFNγ stimulation (20 ng/mL for 24 hours). (C) Enrichment of known transcription factor motifs in Cop1 KO/Rosa26 differential peaks. (D) Proteomic analysis of Rosa26 and Cop1 KO 4T1 cancer cells. Points above the dashed line are statistically significant (q < 0.1). (E) Heatmap displaying the protein abundance of genes in 4T1 cells with MG132 treatment (proteasome inhibitor). Each row is showing the comparison between proteasome inhibition versus vehicle. If a protein is not degraded by the proteasomal degradation pathway then it should show zero difference in protein expression. (F) Western blot of Cop1 and C/ebpδ protein levels in 4T1 mouse TNBC cells transduced with sgRNA targeting Cop1, C/ebpδ and Rosa26. (G) Tumor volume over time in host animals implanted with Rosa26 KO, Cop1 KO, C/ebpδ KO and Cop1/C/ebpδ double KO 4T1 mouse TNBC cells. Data are shown as mean ± SEM, n = 10 mice per group, *p < 0.05, ***p < 0.001, ****p < 0.001, by one-way ANOVA with Benjamini-Hochberg multiple test correction.
Figure 5.
Figure 5.. The COP1-axis Is Associated with Macrophage Infiltration and Response to ICB for Cancer Patients.
(A) Distribution of normalized read counts in a 2,000 bp window around Cop1 KO-specific C/ebpδ peaks. (B) Distribution of gene-averaged read counts for the datasets of C/ebpδ ChIP-seq and ATAC-seq. (C) Significant de novo motifs of Cop1 KO-specific C/ebpδ peaks. p values determined by hypergeometric test. (D) Normalized signal tracks of ChIP-seq, ATAC-seq and RNA-seq at the Ccl2 and Ccl7 locus in 4T1 cancer cells. (E) Correlation of differential expression (log fold change) of cytokines and cytokine receptors between Cop1 KO and C/ebpδ KO. (F) Gene set enrichment analysis of upregulated genes in C/ebpδ KO 4T1 cancer cells compared to Rosa26 KO control cells with IFNγ stimulation. (G) Heatmap showing the correlation between gene expression of COP1 or CEBPD with inferred macrophage infiltration in The Cancer Genome Atlas (TCGA). CEBPD expression was negatively correlated with M2 macrophages (TIDE). Correlations were obtained through the TIMER website and adjusted for tumor purity. Cancer types are labeled on the x-axis.
Figure 6.
Figure 6.. Identification of C/ebpδ As a Direct Target of Cop1 via Adaptor Trib2.
(A) Schematic illustrating motifs of CEBP family members bound by Tribbles-Cop1. (B) The lysate from wild-type 4T1 cells was incubated with Cop1 antibody or control IgG, and the immunocomplexes were probed with the indicated antibodies. (C) Western blot showing representative protein levels of Cop1, Trib2 and C/ebpδ in Rosa26 KO and Cop1 KO cancer cells. (D) Western blot showing representative protein levels of Cop1, Trib2 and C/ebpδ in Cop1 overexpressing and control 4T1 cells. (E) Western blot showing representative protein levels of Cop1, Trib2 and C/ebpδ in Cop1 KO and Rosa26 KO 4T1 cancer cells with or without MG132 treatment. (F) Protein levels of Ddb1, Cul4a, Cop1 and C/ebpδ in 4T1 cancer cells under treatment of neddylation inhibitor MLN4924. (G) Co-immunoprecipitation experiment with Cop1 antibody for Rosa26 KO and Trib2 KO 4T1 cells. (H) Western blot comparing Trib2 KO and Rosa26 KO (control) 4T1 cancer cells for protein levels of Cop1, Trib2 and Cebpd. (I) Schematic illustrating degradation of C/ebpδ by Trib2-Cop1.

Similar articles

Cited by

References

    1. Alshaker HA, and Matalka KZ (2011). IFN-γ, IL-17 and TGF-β involvement in shaping the tumor microenvironment: The significance of modulating such cytokines in treating malignant solid tumors. Cancer Cell Int. 11, 33. - PMC - PubMed
    1. Aran D, Hu Z, and Butte AJ (2017). xCell: digitally portraying the tissue cellular heterogeneity landscape. Genome Biol. 18, 220. - PMC - PubMed
    1. Beatty GL, and Paterson Y (2000). IFN-gamma can promote tumor evasion of the immune system in vivo by down-regulating cellular levels of an endogenous tumor antigen. J. Immunol. 165, 5502–5508. - PubMed
    1. Becht E, Giraldo NA, Lacroix L, Buttard B, Elarouci N, Petitprez F, Selves J, Laurent-Puig P, Sautès-Fridman C, Fridman WH, et al. (2016). Estimating the population abundance of tissue-infiltrating immune and stromal cell populations using gene expression. Genome Biol. 17, 218. - PMC - PubMed
    1. Benci JL, Xu B, Qiu Y, Wu TJ, Dada H, Twyman-Saint Victor C, Cucolo L, Lee DSM, Pauken KE, Huang AC, et al. (2016). Tumor Interferon Signaling Regulates a Multigenic Resistance Program to Immune Checkpoint Blockade. Cell 167, 1540–1554.e12. - PMC - PubMed

Publication types

MeSH terms