. 2022 Jan 6;29(1):101-115.e10.
doi: 10.1016/j.stem.2021.09.004. Epub 2021 Sep 27.

SATB2 preserves colon stem cell identity and mediates ileum-colon conversion via enhancer remodeling

Affiliations

SATB2 preserves colon stem cell identity and mediates ileum-colon conversion via enhancer remodeling

Wei Gu et al. Cell Stem Cell. .

Abstract

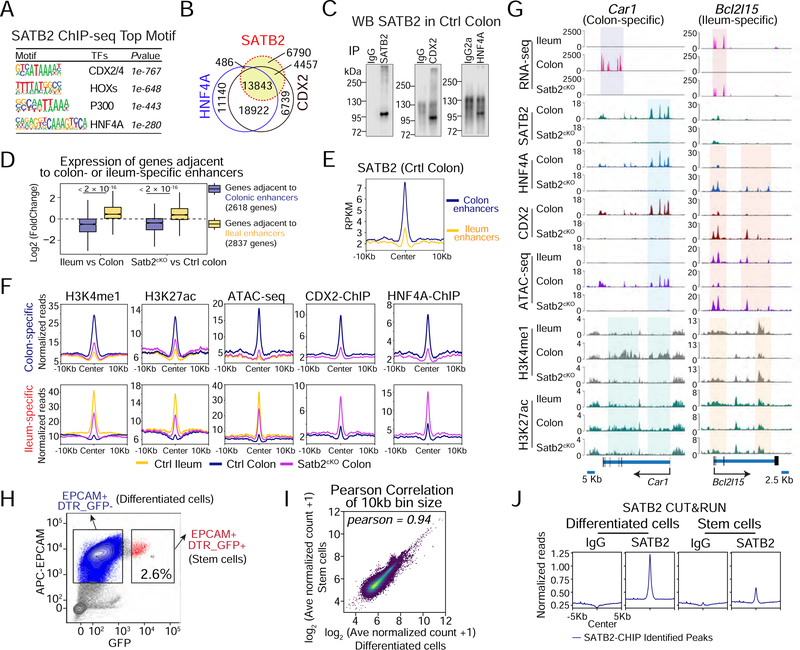
Adult stem cells maintain regenerative tissue structure and function by producing tissue-specific progeny, but the factors that preserve their tissue identities are not well understood. The small and large intestines differ markedly in cell composition and function, reflecting their distinct stem cell populations. Here we show that SATB2, a colon-restricted chromatin factor, singularly preserves LGR5+ adult colonic stem cell and epithelial identity in mice and humans. Satb2 loss in adult mice leads to stable conversion of colonic stem cells into small intestine ileal-like stem cells and replacement of the colonic mucosa with one that resembles the ileum. Conversely, SATB2 confers colonic properties on the mouse ileum. Human colonic organoids also adopt ileal characteristics upon SATB2 loss. SATB2 regulates colonic identity in part by modulating enhancer binding of the intestinal transcription factors CDX2 and HNF4A. Our study uncovers a conserved core regulator of colonic stem cells able to mediate cross-tissue plasticity in mature intestines.

Keywords: SATB2, intestine regeneration, colonic mucosa, stem cell conversion, enhancer remodelingintestine.


Conflict of interest statement

Declaration of interests A patent application related to this work is pending at Weill Cornell Medicine.

Figures

Figure 1.
Figure 1.. Conversion of large intestine mucosa to one that resembles ileal small intestine in Satb2cKO mice.
A. SATB2 is expressed in adult murine large intestine epithelial cells including LGR5+ stem cells and absent in small intestine epithelium. ECAD: E-cadherin. B, C. 30 days after intestinal deletion of Satb2 from 2-month old Vil-CreER;Satb2f/f (Satb2cKO) mice, H&E staining showed the characteristic flat colonic glands were replaced by elongated villi-like glands, and many cells bearing Paneth morphology (pink-colored cells) appeared at the bottom of the glands. N = 8 mice. Mean ± S.D. P value by Mann Whitney U-test. D, E. RNA-seq of intestinal epithelia revealed a shift of the large intestine transcriptomes (cecum and colon) in Satb2cKO mice towards small intestine ileal transcriptomes by principal component analysis (PCA) (D) and Gene Set Enrichment Analysis (E, NES: normalized enrichment score; FDR: false discovery rate). F. Immunofluorescence showed the appearance of OLFM4+ small intestine stem cells, LYZ1+ Paneth cells, FABP6+ and FGF15+ ileal enterocytes in Satb2cKO colon, and concomitant disappearance of CA1+ and AQP4+ colonocytes.
Figure 2.
Figure 2.. Conversion of LGR5+ colonic stem cells to ileal-like stem cells after SATB2 loss.
A. scRNA sequencing and post hoc annotation showed that a majority of cells in Satb2cKO colon clustered with ileum (t-SNE plots, 3,912 cells from ileum, 3,627 cells from control colon, and 4,370 cells from Satb2cKO colon). Satb2cKO colonic sample harvested 30 days post TAM. B. Dot plots of 30 representative genes of the major intestinal cell lineages. C. UMAP visualization of 594 LGR5+ stem cells at G1/S phase. Satb2cKO colonic stem cells cluster with ileal rather than colonic stem cells. D. When grown in standard small intestine medium in 3D Matrigel, primary colonic glands from Satb2cKO mice yielded branching organoids at a similar efficiency as control ileal glands, which can be further propagated into secondary organoids. In contrast, control colonic glands generated few small spheroids. N = 4, 5 mice, Mean ± S.D. P value by Mann Whitney U-test. E. SATB2 deletion from colonic stem cells in Lgr5CreERGFP;Satb2f/f mice led to progressive conversion of colonic epithelium to ileum. The deleted clones were marked by crypt GFP expression. 7 days after tamoxifen treatment, SATB2 disappeared from the lower part of the glands but OLFM4 was activated only in some of the GFP+ colonic stem cells, indicating incomplete reprogramming at this stage. By day 36, the conversion of colonic stem cells appeared complete with OLFM4 expression in most of the GFP+ cells, presence of LYZ1+ Paneth cells, and replacement of CA1+ colonocytes by FABP6+ enterocytes.
Figure 3.
Figure 3.. Rapid conversion of colonocytes to enterocytes after SATB2 loss.
A. A time course study of colonic mucosa after a single dose of TAM treatment in Satb2cKO mice showed rapid activation of FABP6 and down-regulation of CA1 at day 2 and complete replacement of CA1+ cells by FABP6+ cells by day 6. OLFM4 and LYZ1 were not robustly activated until day 30. B, C. Principal component analysis (PCA) and heatmap representation of time course RNA-seq data showed rapid activation of pathways typical of enterocytes and down-regulation of pathways characteristic of colonocytes. Paneth and stem cell genes were only strongly activated at day 30.
Figure 4.
Figure 4.. Generation of bona fide nutrient absorbing enterocytes in Satb2cKO colon.
A. The scRNA profiles of Satb2cKO colonic enterocytes closely resemble ileal enterocytes. Heatmap was plotted using the top 100 DEGs between ileal enterocytes and control colonocytes. Bar graph showed the top five differential GeneOntology pathways between ileal enterocytes and control colonocytes. Some of the nutrient transporters were highlighted in heatmap. B. The microvilli length of Satb2cKO enterocytes was significantly longer than that of control colon and comparable to ileal enterocytes. N = 10 randomly selected cells. Mean ± S.D. P value by Mann Whitney U-test. C. Schematic diagram of the assay to measure glucose and taurocholic acid absorption and trans-epithelial transport into portal circulation. A segment of the ileum or colon was tied on both ends to create a pouch; radiolabeled chemicals were injected into the pouch to allow absorption and transport. D. The amount of glucose and taurocholic acid being transported in portal vein plasma or deposited in the liver tissue after infusion into the Satb2cKO colon is significantly higher compared with infusions into the control colon, indicating enhanced absorptive functions in the colon of SATB2 null mice. N = 6–8 mice. Mean ± S.D. P value by Mann Whitney U-test.
Figure 5.
Figure 5.. SATB2 confers colonic characteristics to adult ileum.
A, B. Construction of a Satb2 transgenic mouse line (CAGSatb2GFP). A. Diagram of the construct. Co-expression of murine SATB2 (with a HA epitope tag) and GFP is activated in the adult intestine after TAM treatment of Vil-CreER;CAGSatb2GFP (Satb2OE) mice. B. Immunostaining of ileal sections (30 days after TAM treatment of 2-month old mice) confirmed co-localization of HA tag and GFP. C-F. Ectopic expression of Satb2 activated colonic genes and suppressed ileal genes. C. A representative FACS plot of GFP and EPCAM in the purification of GFP+ and GFP ileal epithelial cells. D. qPCR quantification of Satb2 transcript levels in colon epithelial, GFP+ and GFP ileal epithelial cells. N = 3 mice. *** P < 0.001. Mean ± S.D. Unpaired t-test. E. Gene Set Enrichment Analysis of transcriptomes from GFP+ vs GFP cells showed an enrichment of colonic and depletion of ileal signature genes (NES: normalized enrichment score; P: Nominal P value). F. Heatmap of representative small and large intestine genes illustrating that GFP+ ileal cells lost expression of enterocyte nutrient transporters and Paneth bacterial defense factors while gaining expression of electrolyte transporters and glycosylation enzymes characteristic of colonic function. G, H. Ectopic SATB2 activated the colonic marker CA1 and suppressed OLFM4, LYZ1, and FABP6 in the ileum. G. Immunofluorescence staining of Ileum 30 days after TAM. White lines delineate villi and crypts. Dashed lines in magnified pictures outline crypts. H. Quantitation of CA1+ and FABP6+ cells among GFP+ or GFP cells on the ileal villi. Numbers of OLFM4+ stem cells and LYZ1+ Paneth cells were quantified in GFP+ and GFP crypts. N = 5 mice. Mean ± S.D. P value by paired t-test.
Figure 6.
Figure 6.. SATB2 regulates enhancer dynamics and binding of intestinal transcription factors CDX2 and HNF4A.
A-C. Extensive genomic co-binding of SATB2 with CDX2 and HNF4A in colonic epithelium. A. Top TF binding motifs enriched in SATB2 ChIP-seq sites (MACS P < 1 × 10⁻⁹) by HOMER in control colonic epithelium. Motifs were ranked by −log10 (P value). B. Venn diagram showed the overlaps among SATB2, CDX2 and HNF4A bound regions. Two biological replicates for each of the factors. C. CDX2 and HNF4A antibodies can pull down SATB2 proteins from primary colonic tissues. D. Box-and-whisker plots representing relative gene expression changes. Genes adjacent to colonic enhancers (MAnorm P < 0.01; distance < 50kb; 2618 genes) were expressed at higher levels in control colon (P < 2 × 10⁻¹⁶) whereas genes adjacent to ileal enhancers (MAnorm P < 0.01; distance < 50kb; 2837 genes) were expressed at higher levels in ileum and Satb2cKO colon (P < 2 × 10⁻¹⁶). Each box represents the median and interquartile range; whiskers extend to 1.5 times the interquartile range. P value by unpaired, two-sided Wilcoxon rank-sum test; N = 3 mice. E. SATB2 ChIP-seq signals were enriched at colon-specific enhancers compared to ileum-specific enhancers in control colon (P < 2 × 10⁻¹⁶). Plot shown for a 20 kb window centered on each specific enhancer binding sites. F. Inactivation of colon-specific enhancers and activation of ileum-specific enhancers in Satb2cKO colon. All plots were shown with a 20 kb window centered at colon-specific or ileum-specific enhancers for H3K4me1 and H3K27ac (CUT&RUN-seq), ATAC-seq, CDX2 and HNF4A ChIP in ileum, colon and Satb2cKO colon (N = 2 biological replicates). G. Genome Browser tracks of RNA-seq, histone modifications (CUT&RUN-seq), and TF ChIP data at genomic loci of the colonic gene Car1 and the ileal gene Bcl2l15. Regions with significant enhancer and TF binding changes among samples were highlighted. H-J. SATB2 bound similar genomic loci in colonic LGR5+ stem cells as non-stem cells. H. FACS plot of cell fractions enriched for stem cells (EPCAM+GFP+) or differentiated cells (EPCAM+GFP) isolated from LGR5DTRGFP murine colon. I. Pearson correlation of SATB2 binding signals in stem vs differentiated cells by CUT&RUN-seq showed concordant binding patterns. J. SATB2 CUT&RUN binding profiles in a 10Kb window centered on SATB2 peaks identified by ChIP-seq.
Figure 7.
Figure 7.. Colonic to ileal plasticity after SATB2 loss in human colonic organoids.
A. SATB2 was expressed in ECAD+ (E-CADHERIN) epithelial cells of human colon but not ileum. B. Representative images of SATB2 expression in one of the primary human organoid lines (#87) and its absence after CRISPR-mediated deletion. sgRNA: single guide RNA. C-E. Transcriptomes of SATB2 deleted (SATB2hKO) colonic organoids shifted towards ileum, as seen in the PCA plot (C), tissue enrichment (D), and up-regulated KEGG pathways (E). F. The ileal makers SLC15A1 and FABP6 were activated in colonic organoids after SATB2 loss and localized to the luminal epithelial side and the cytoplasm, respectively. Relative signal intensity was calculated by comparison with control ileal organoids (Fig. S6G). N = 8 samples (4 biological replicates each in 2 independent experiments). Mean ± S.D. P value by Mann Whitney U-test. G. Significant activities of the small intestine disaccharidase and dipeptide peptidase were detected in SATB2hKO colonic organoids. N = 6 samples (3 biological replicates each in 2 independent experiments). Mean ± S.D. P value by Mann Whitney U-test.

References

    1. Alcamo EA, Chirivella L, Dautzenberg M, Dobreva G, Farinas I, Grosschedl R, and McConnell SK (2008). Satb2 regulates callosal projection neuron identity in the developing cerebral cortex. Neuron 57, 364–377. - PubMed
    1. Ariyachet C, Tovaglieri A, Xiang G, Lu J, Shah MS, Richmond CA, Verbeke C, Melton DA, Stanger BZ, Mooney D, et al. (2016). Reprogrammed Stomach Tissue as a Renewable Source of Functional beta Cells for Blood Glucose Regulation. Cell Stem Cell 18, 410–421. - PMC - PubMed
    1. Banerjee KK, Saxena M, Kumar N, Chen L, Cavazza A, Toke NH, O’Neill NK, Madha S, Jadhav U, Verzi MP, et al. (2018). Enhancer, transcriptional, and cell fate plasticity precedes intestinal determination during endoderm development. Genes Dev 32, 1430–1442. - PMC - PubMed
    1. Barker N, van Es JH, Kuipers J, Kujala P, van den Born M, Cozijnsen M, Haegebarth A, Korving J, Begthel H, Peters PJ, et al. (2007). Identification of stem cells in small intestine and colon by marker gene Lgr5. Nature 449, 1003–1007. - PubMed
    1. Beumer J, and Clevers H (2021). Cell fate specification and differentiation in the adult mammalian intestine. Nat Rev Mol Cell Biol 22, 39–53. - PubMed

Publication types