. 2022 Feb 1;806(Pt 1):150468.
doi: 10.1016/j.scitotenv.2021.150468. Epub 2021 Sep 21.

DNA metabarcoding using nrITS2 provides highly qualitative and quantitative results for airborne pollen monitoring

Affiliations

DNA metabarcoding using nrITS2 provides highly qualitative and quantitative results for airborne pollen monitoring

Marcel Polling et al. Sci Total Environ. .

Abstract

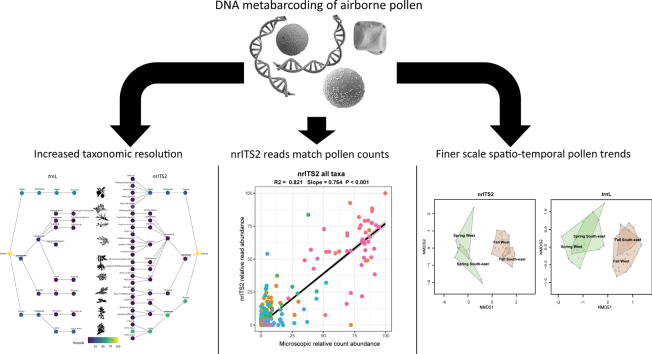
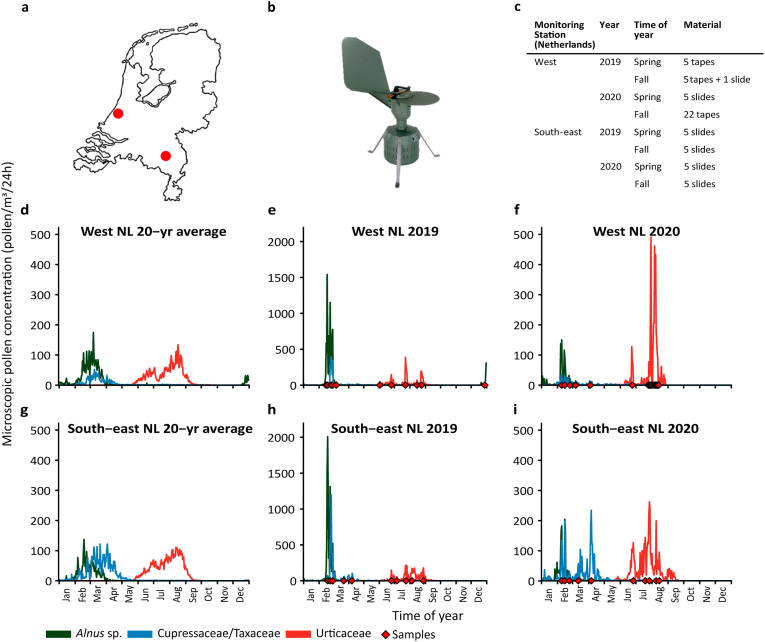
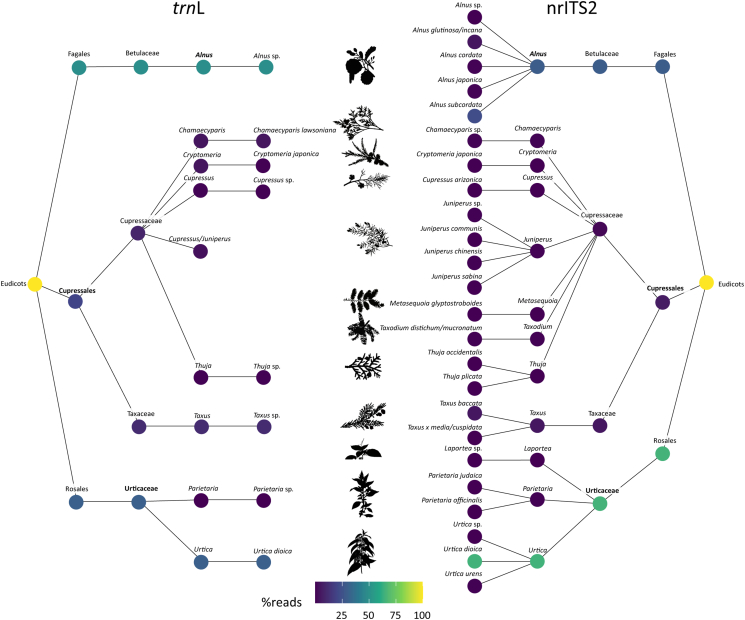
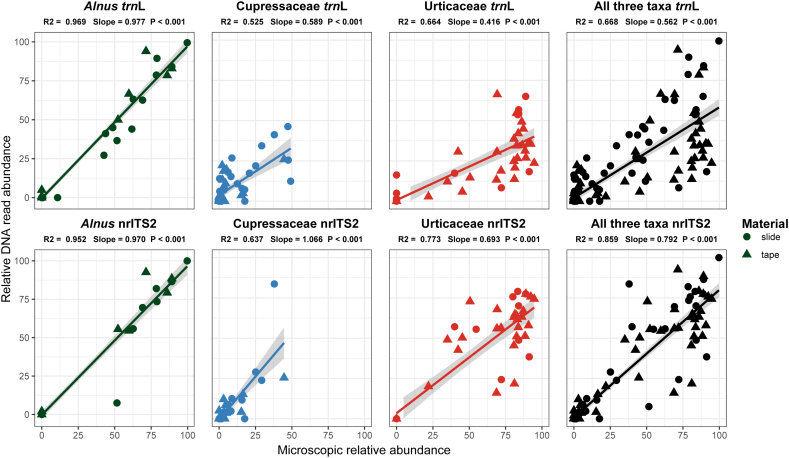
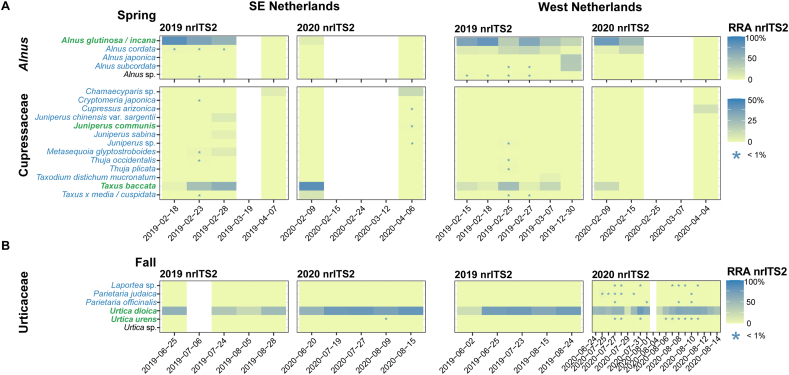
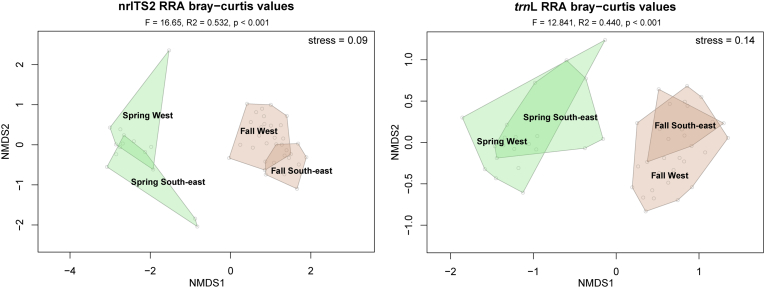
Airborne pollen monitoring is of global socio-economic importance as it provides information on presence and prevalence of allergenic pollen in ambient air. Traditionally, this task has been performed by microscopic investigation, but novel techniques are being developed to automate this process. Among these, DNA metabarcoding has the highest potential of increasing the taxonomic resolution, but uncertainty exists about whether the results can be used to quantify pollen abundance. In this study, it is shown that DNA metabarcoding using trnL and nrITS2 provides highly improved taxonomic resolution for pollen from aerobiological samples from the Netherlands. A total of 168 species from 143 genera and 56 plant families were detected, while using a microscope only 23 genera and 22 plant families were identified. NrITS2 produced almost double the number of OTUs and a much higher percentage of identifications to species level (80.1%) than trnL (27.6%). Furthermore, regressing relative read abundances against the relative abundances of microscopically obtained pollen concentrations showed a better correlation for nrITS2 (R2 = 0.821) than for trnL (R2 = 0.620). Using three target taxa commonly encountered in early spring and fall in the Netherlands (Alnus sp., Cupressaceae/Taxaceae and Urticaceae) the nrITS2 results showed that all three taxa were dominated by one or two species (Alnus glutinosa/incana, Taxus baccata and Urtica dioica). Highly allergenic as well as artificial hybrid species were found using nrITS2 that could not be identified using trnL or microscopic investigation (Alnus × spaethii, Cupressus arizonica, Parietaria spp.). Furthermore, perMANOVA analysis indicated spatiotemporal patterns in airborne pollen trends that could be more clearly distinguished for all taxa using nrITS2 rather than trnL. All results indicate that nrITS2 should be the preferred marker of choice for molecular airborne pollen monitoring.

Keywords: Aerobiology; Airborne pollen; DNA metabarcoding; Quantification; nrITS2; trnL P6 loop.


Conflict of interest statement

Declaration of competing interest The authors declare no conflict of interest.

Figures

Unlabelled Image
Graphical abstract
Fig. 1
Fig. 1
Pollen collection in the Netherlands a) locations of pollen monitoring sites, the West (Leiden) and South-east of the Netherlands (Helmond) b) Hirst-type Burkard pollen sampler c) sample selection of Melinex tapes and microscopic slides with mounted tapes d,g) 20-year average pollen concentrations of Alnus, Cupressaceae and Urticaceae at both pollen monitoring stations e,h) 2019 pollen concentrations of the three target taxa and f,i) 2020 pollen concentrations. Sampling dates are shown with red diamonds on the x-axis. Note scale change for figure e and h. NL = the Netherlands, yr = year. (For interpretation of the references to colour in this figure legend, the reader is referred to the web version of this article.)
Fig. 2
Fig. 2
Taxonomic resolution for Alnus, Cupressaceae and Urticaceae achieved using trnL and nrITS2 metabarcoding of pollen grains collected with a Burkard sampler at two pollen monitoring sites in the Netherlands. Results from trnL are shown on the left side while nrITS2 is shown on the right. Colours of the circles represent the percentage of identified reads. The maximum taxonomic resolution achieved using microscopic pollen identification for the three target taxa is noted in bold.
Fig. 3
Fig. 3
Correlations of microscopic pollen concentrations and sequencing read abundances. Regressions for Alnus sp., Cupressaceae, Urticaceae as well as all three combined are shown. The top panels show the results of trnL and the bottom panels nrITS2. Comparisons are at the maximum taxonomic levels these taxa can be identified with a microscope. Pollen concentrations were converted to relative abundances for comparison to DNA relative read abundances.
Fig. 4
Fig. 4
Relative nrITS2 molecular read abundance of species of Alnus, Cupressaceae in spring and Urticaceae in fall of the 2019 and 2020 seasons of two pollen monitoring sites in the Netherlands (West and South-east of the Netherlands). The x-axis represents the material collection dates (see Fig. 1). * presence at low relative abundance (< 1%). Taxa in green are native to the Netherlands, taxa in blue are either cultivated or introduced, and for taxa in black this is unknown. White bars indicate samples for which amplification failed. (For interpretation of the references to colour in this figure legend, the reader is referred to the web version of this article.)
Fig. 5
Fig. 5
Two-dimensional NMDS plots on RRA-based Bray-Curtis dissimilarities of trnL and nrITS2 results from spring and fall at the West and South-east of the Netherlands. Polygons in green represent samples from spring while those in brown represent fall. (For interpretation of the references to colour in this figure legend, the reader is referred to the web version of this article.)

References

    1. Afgan E., Baker D., Batut B., van den Beek M., Bouvier D., Cech M., Chilton J., Clements D., Coraor N., Gruning B.A., Guerler A., Hillman-Jackson J., Hiltemann S., Jalili V., Rasche H., Soranzo N., Goecks J., Taylor J., Nekrutenko A., Blankenberg D. The galaxy platform for accessible, reproducible and collaborative biomedical analyses: 2018 update. Nucleic Acids Res. 2018;46:W537–W544. doi: 10.1093/nar/gky379. - DOI - PMC - PubMed
    1. Anderegg W.R.L., Abatzoglou J.T., Anderegg L.D.L., Bielory L., Kinney P.L., Ziska L. Anthropogenic climate change is worsening north american pollen seasons. Proc. Natl. Acad. Sci. U. S. A. 2021;118 doi: 10.1073/pnas.2013284118. - DOI - PMC - PubMed
    1. Ariano R., Panzani R.C., Falagiani P., Chiapella M., Augeri G. Respiratory allergy to the pollen of Mercurialis annua (Euphorbiaceae) Ann. Allergy. 1993;70:249–254. - PubMed
    1. Baksay S., Pornon A., Burrus M., Mariette J., Andalo C., Escaravage N. Experimental quantification of pollen with DNA metabarcoding using ITS1 and trnL. Sci. Rep. 2020;10:4202. doi: 10.1038/s41598-020-61198-6. - DOI - PMC - PubMed
    1. Banchi E., Group, A. W. Ametrano C.G., Tordoni E., Stankovic D., Ongaro S., Tretiach M., Pallavicini A., Muggia L. Environmental DNA assessment of airborne plant and fungal seasonal diversity. Sci. Total Environ. 2020;738 doi: 10.1016/j.scitotenv.2020.140249. - DOI - PubMed