. 2021 Nov;132(11):2751-2762.
doi: 10.1016/j.clinph.2021.07.027. Epub 2021 Aug 30.

Small vessel disease disrupts EEG postural brain networks in 'unexplained dizziness in the elderly'

Affiliations

Small vessel disease disrupts EEG postural brain networks in 'unexplained dizziness in the elderly'

R T Ibitoye et al. Clin Neurophysiol. 2021 Nov.

Abstract

Objective: To examine the hypothesis that small vessel disease disrupts postural networks in older adults with unexplained dizziness in the elderly (UDE).

Methods: Simultaneous electroencephalography and postural sway measurements were undertaken in upright, eyes closed standing, and sitting postures (as baseline) in 19 younger adults, 33 older controls and 36 older patients with UDE. Older adults underwent magnetic resonance imaging to determine whole brain white matter hyperintensity volumes, a measure of small vessel disease. Linear regression was used to estimate the effect of instability on electroencephalographic power and connectivity.

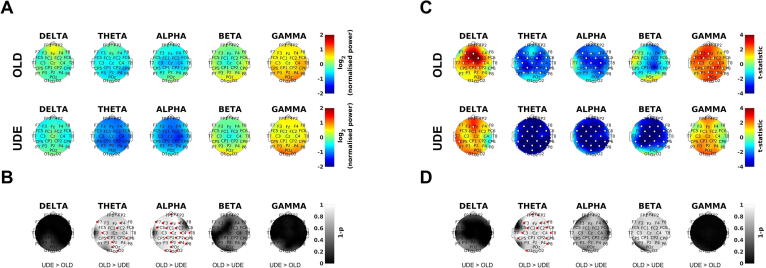
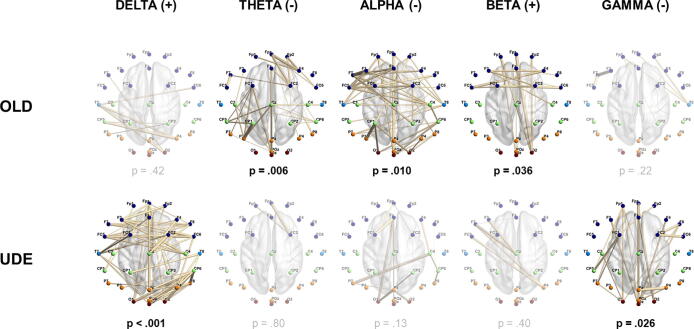
Results: Ageing increased theta and alpha desynchronisation on standing. In older controls, delta and gamma power increased, and theta and alpha power reduced with instability. Dizzy older patients had higher white matter hyperintensity volumes and more theta desynchronisation during periods of instability. White matter hyperintensity volume and delta power during periods of instability were correlated, positively in controls but negatively in dizzy older patients. Delta power correlated with subjective dizziness and instability.

Conclusions: Neural resource demands of postural control increase with age, particularly in patients with UDE, driven by small vessel disease.

Significance: EEG correlates of postural control saturate in older adults with UDE, offering a neuro-physiological basis to this common syndrome.

Keywords: Dizziness; EEG; Elderly; Postural control; Small vessel disease; Unexplained dizziness in the elderly.


Conflict of interest statement

Declaration of Competing Interest The authors declare that they have no known competing financial interests or personal relationships that could have appeared to influence the work reported in this paper.

Figures

Fig. 1
Fig. 1
Overview of methods. (A) Younger adult (YOUNG), older non-dizzy adult (OLD) and unexplained dizziness in the elderly (UDE) participant EEG data was collected in sitting and standing postures. Older adult groups also had a simultaneous recording of postural sway (red trace is anteroposterior sway). (B) Summary of EEG pre-processing. (C) i) Power spectrum density was determined in each channel; ii) Data was divided into 2 second epochs for downstream EEG power-instability and connectivity-instability analyses; iii) undirected functional connectivity was derived for each channel pair, excluding mastoids (M1, M2) (Nolte et al., 2008). (D) - Power and connectivity analyses. (E) - Further analysis investigated the influence of white matter hyperintensity volume on power-instability, and connectivity-instability findings.
Fig. 2
Fig. 2
Ageing increases theta and alpha desynchronisation and gamma oscillations in standing balance. (A) Normalised power (standing /sitting) by group, frequency band and channel in log units (positive values mean power increased), thus 0 is no change between standing and sitting. YOUNG = younger adult controls; OLD = older adult controls. (B) Comparison of normalised power using threshold-free cluster enhancement (TFCE). TFCE is a non-parametric method for correcting for multiple comparisons which incorporates evidence of spatial clustering. Normalised power in OLD was compared to YOUNG to determine if changes were consistent with greater postural task difficulty (thus, higher standing delta and gamma, or lower standing theta, alpha and beta power, 1 minus p values, higher is more significant) (Edwards et al., 2018, Hülsdünker et al., 2015, Ozdemir et al., 2018, Sipp et al., 2013, Slobounov et al., 2009). Red dots indicate channel significance using TFCE (family-wise error rate p < .05) (Smith and Nichols, 2009).
Fig. 3
Fig. 3
Unexplained dizziness in the elderly in older adults increases neural resource demands of postural control. (A) Normalised power (standing/sitting) by group, frequency band and channel in log units (positive values mean power increased), thus 0 is no change between sitting and standing. OLD = older adult controls; UDE = unexplained dizziness in the elderly. Note the further reduction in alpha and theta power when upright in the UDE group. (B) Comparison of normalised power using threshold-free cluster enhancement (TFCE) (Smith and Nichols, 2009). Statistical testing compared UDE to OLD participants, assessing if power changes were consistent with predictions of greater postural task difficulty (thus, higher standing delta and gamma, or lower standing theta, alpha and beta power, 1 minus p values, higher is more significant) (Edwards et al., 2018, Hülsdünker et al., 2015, Ozdemir et al., 2018, Sipp et al., 2013, Slobounov et al., 2009). The statistical output of TFCE was a one-tailed p-value. Note theta and alpha power decrease more on standing in UDE than the control group. (C) Power-instability coefficient (the linear relationship between power in the standing condition and sway) by group, frequency band and channel. Positive statistic values reflect positive correlation between sway and EEG power. Note delta and gamma power increase with sway, whereas theta, alpha and beta power decrease. (D) Comparison of power-instability coefficient (for standing condition) using TFCE. UDE were compared to OLD participants, assessing if changes in the linear relationship between power and instability were consistent with the predictions of greater postural task difficulty. Red or white dots (in B, C and D) indicate channel significance using TFCE which incorporates evidence from neighbouring channels (family-wise error rate p < .05) (Smith and Nichols, 2009). Note theta power decreases more with sway in UDE than the control group.
Fig. 4
Fig. 4
White matter hyperintensity volume influences instability-driven increases in delta oscillations. (A) Effect of increasing whole brain white matter hyperintensity volume on the power-instability coefficient in delta frequency band for older adult controls (OLD) and unexplained dizziness in the elderly (UDE). Positive values reflect a positive correlation - more delta power increases with sway as white matter hyperintensity volume increases. (B) Interaction effect between white matter hyperintensity volume and group (OLD, UDE) in predicting the linear relationship between delta band EEG power and sway. Positive values reflect more delta power increases with sway in older controls as white matter hyperintensity volume increases, and less delta power increases with sway in UDE. (C) Plots of linear relationship between delta EEG power and sway (t-statistic of the power-instability co-efficient) vs. white matter hyperintensity volume. These illustrate the interaction effect: a positive linear relationship is seen in older controls, whereas a negative linear relationship is seen in UDE. White dots (in A and B) indicate channel significance using threshold-free cluster enhancement. This significance takes into account the spatial evidence of clustering of correlations.
Fig. 5
Fig. 5
Connectivity networks in which connectivity correlated with sway. TOP row: networks of significant instability-related connectivity in controls in theta, alpha and beta as identified by Network Based Statistics (Zalesky et al., 2010) (network-forming threshold of p < .05, family-wise error rate p < .05). Positive linear relationships between connectivity (phase slope index (Nolte et al., 2008)) and sway are indicated by ‘(+)’, and negative linear relationships by ‘(-)’. Network Based Statistics family-wise error rate p-values are shown. BOTTOM row: networks of significant instability-related connectivity in unexplained dizziness in the elderly (UDE) in delta and gamma. Faded images and p-values are the best (lowest p-value) corresponding non-significant networks in the other participant group.
Fig. 6
Fig. 6
Subjective instability correlates with delta EEG power when standing. (A) Head plots showing positive correlation between subjective instability and standing EEG power in delta frequency band (power spectrum density, 1 minus p values, higher is stronger correlation). Red dots indicate channel significance using threshold-free cluster enhancement. (B) Scatter plots showing positive correlation between subjective instability and EEG power in Fz, Cz and Pz. ALL = for all older adult participants (OLD + UDE). OLD = older adult controls. UDE = unexplained dizziness in the elderly.

References

    1. Ahmad H., Cerchiai N., Mancuso M., Casani A.P., Bronstein A.M. Are white matter abnormalities associated with “unexplained dizziness”? J Neurol Sci. 2015;358(1-2):428–431. - PMC - PubMed
    1. Alper K.R., John E.R., Brodie J., Günther W., Daruwala R., Prichep L.S. Correlation of PET and qEEG in normal subjects. Psychiatry Res. 2006;146(3):271–282. - PubMed
    1. Alsalman O., Ost J., Vanspauwen R., Blaivie C., De Ridder D., Vanneste S., Kapoula Z. The Neural Correlates of Chronic Symptoms of Vertigo Proneness in Humans. PLoS One. 2016;11(4):e0152309. doi: 10.1371/journal.pone.0152309. - DOI - PMC - PubMed
    1. Backhouse E.V., McHutchison C.A., Cvoro V., Shenkin S.D., Wardlaw J.M. Early life risk factors for cerebrovascular disease: A systematic review and meta-analysis. Neurology. 2017;88(10):976–984. - PubMed
    1. Bansal R., Peterson B.S. Cluster-level statistical inference in fMRI datasets: The unexpected behavior of random fields in high dimensions. Magn Reson Imaging. 2018;49:101–115. - PMC - PubMed

Publication types

MeSH terms