. 2021 Oct 5;10(19):e021985.
doi: 10.1161/JAHA.121.021985. Epub 2021 Sep 29.

Enhanced Heart Failure in Redox-Dead Cys17Ser PKARIα Knock-In Mice

Affiliations

Enhanced Heart Failure in Redox-Dead Cys17Ser PKARIα Knock-In Mice

M M Towhidul Islam et al. J Am Heart Assoc. .

Abstract

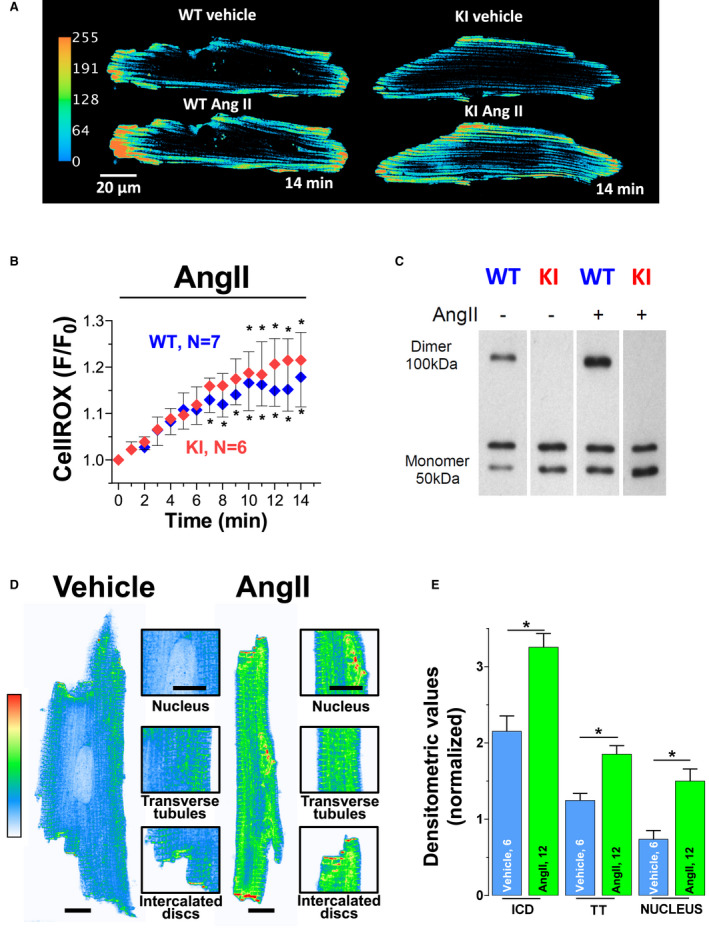
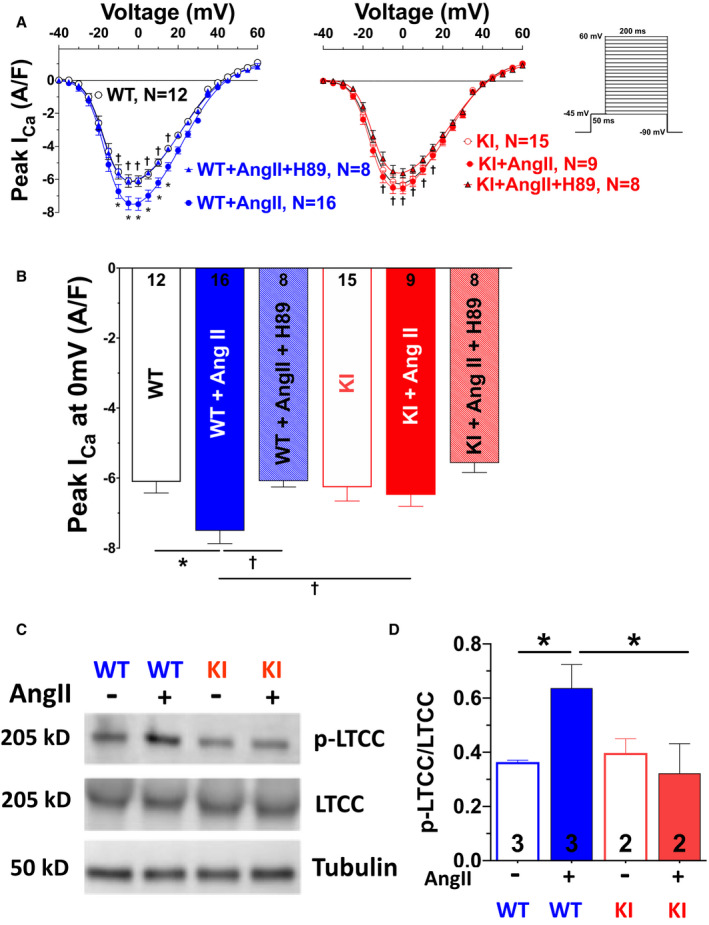
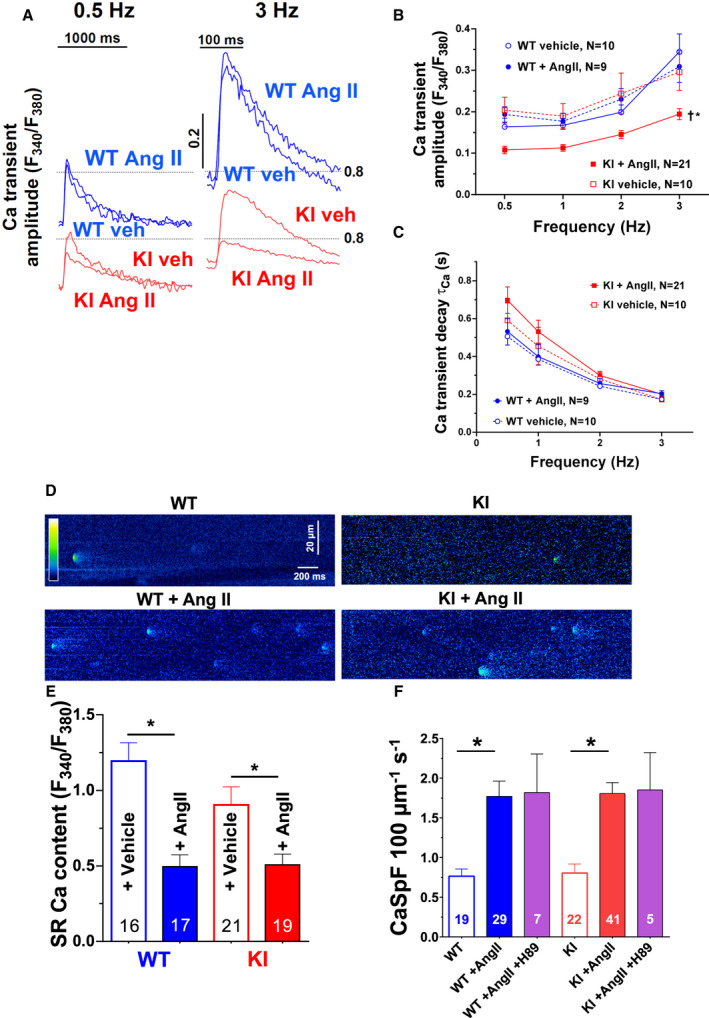
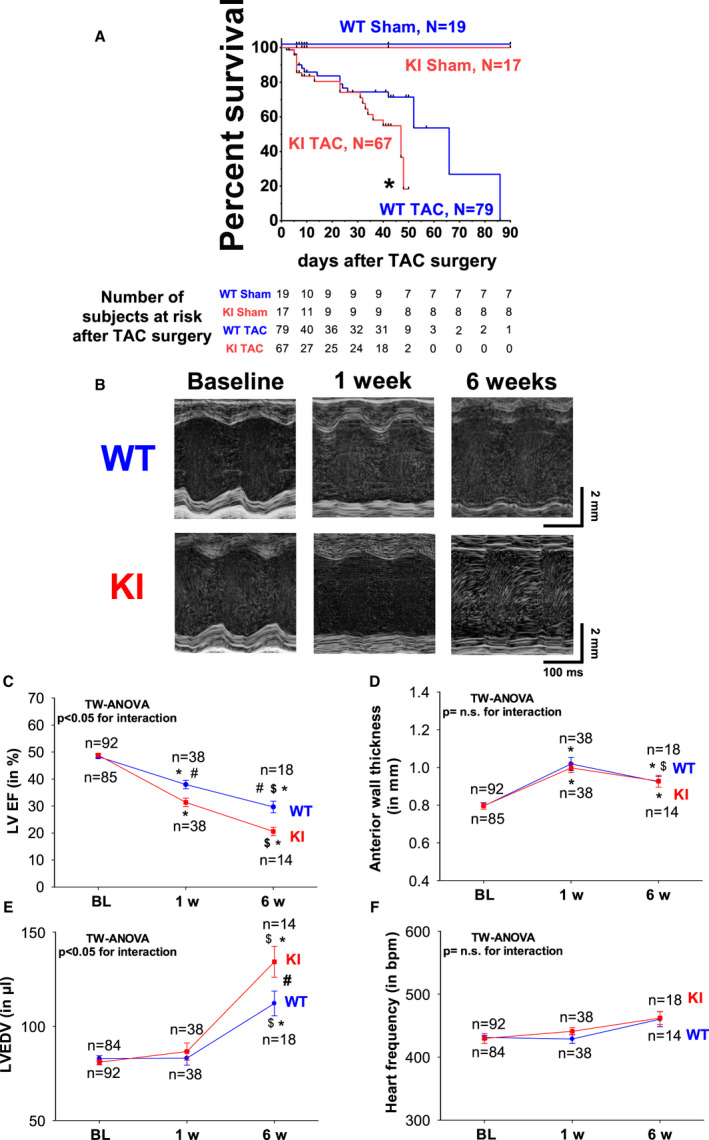
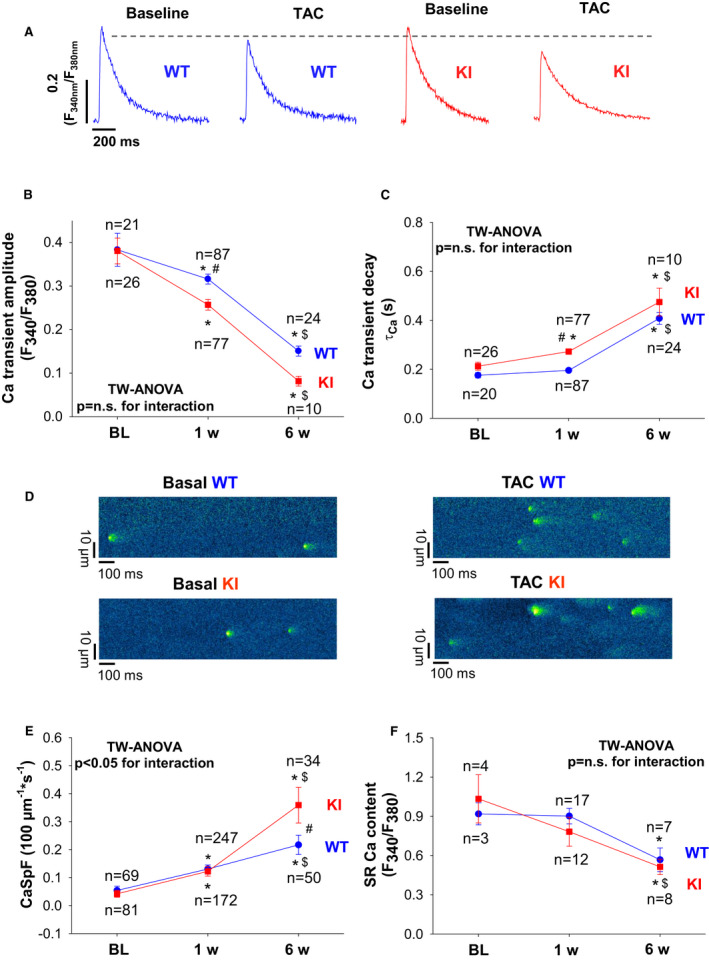
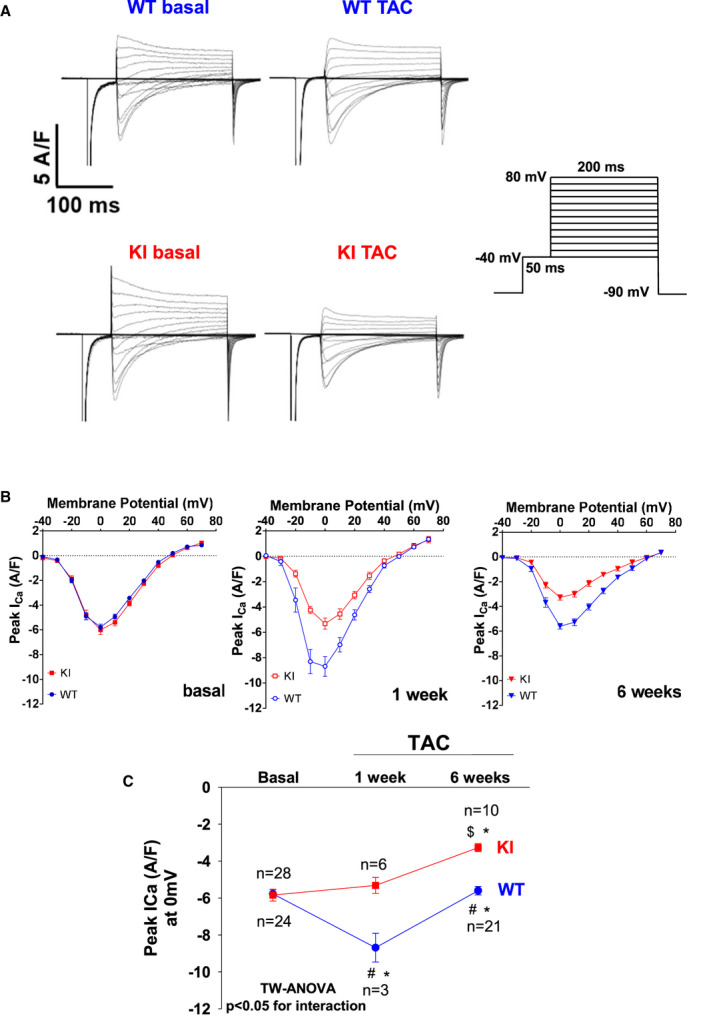
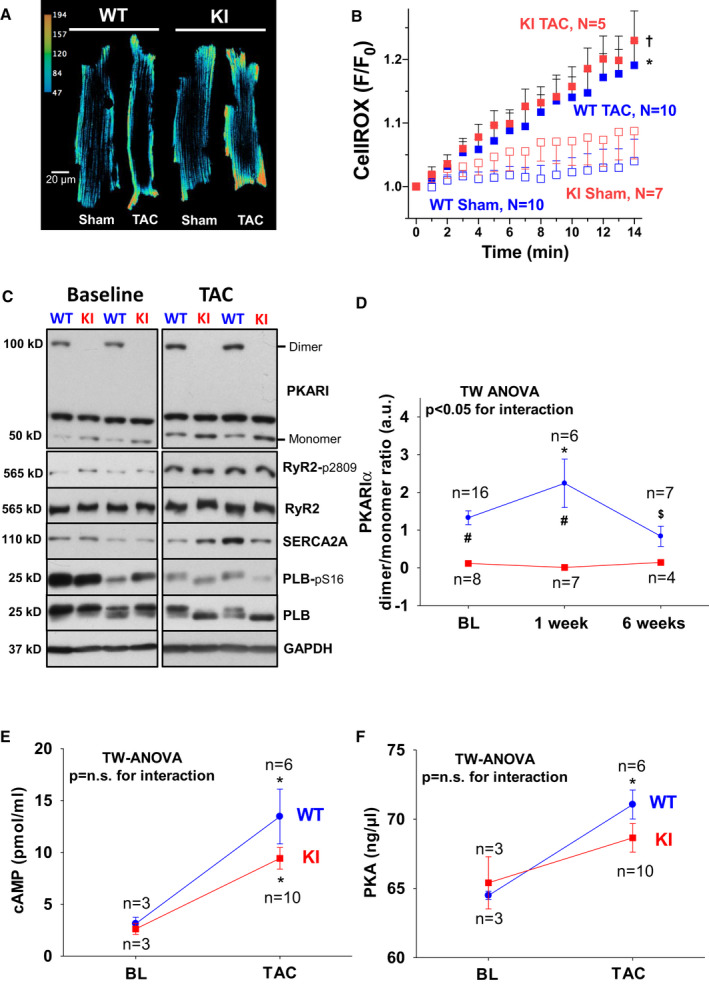
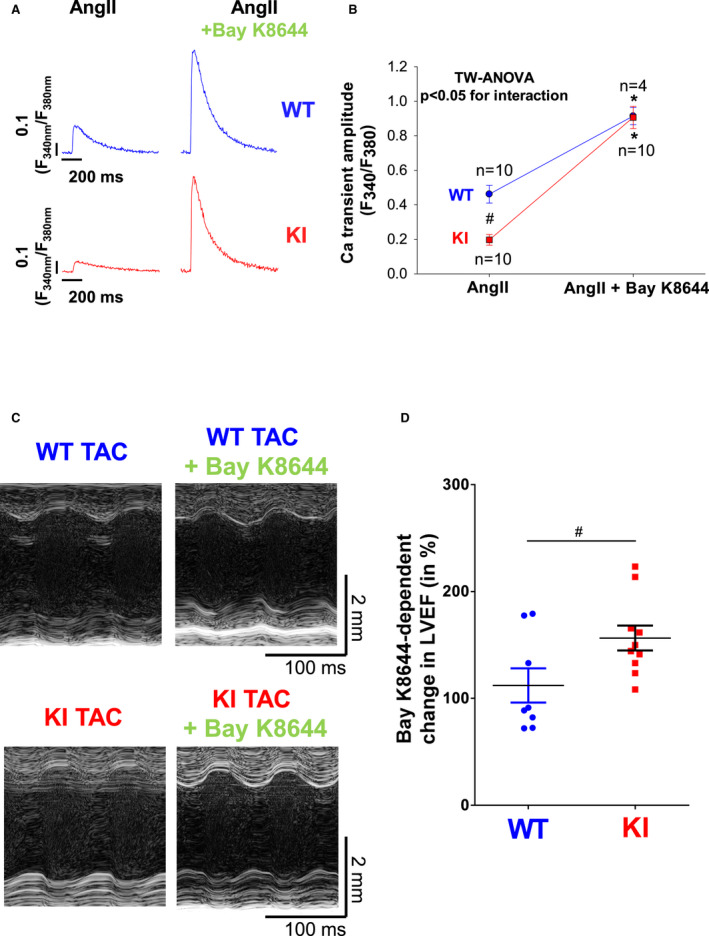
Background PKARIα (protein kinase A type I-α regulatory subunit) is redox-active independent of its physiologic agonist cAMP. However, it is unknown whether this alternative mechanism of PKARIα activation may be of relevance to cardiac excitation-contraction coupling. Methods and Results We used a redox-dead transgenic mouse model with homozygous knock-in replacement of redox-sensitive cysteine 17 with serine within the regulatory subunits of PKARIα (KI). Reactive oxygen species were acutely evoked by exposure of isolated cardiac myocytes to AngII (angiotensin II, 1 µmol/L). The long-term relevance of oxidized PKARIα was investigated in KI mice and their wild-type (WT) littermates following transverse aortic constriction (TAC). AngII increased reactive oxygen species in both groups but with RIα dimer formation in WT only. AngII induced translocation of PKARI to the cell membrane and resulted in protein kinase A-dependent stimulation of ICa (L-type Ca current) in WT with no effect in KI myocytes. Consequently, Ca transients were reduced in KI myocytes as compared with WT cells following acute AngII exposure. Transverse aortic constriction-related reactive oxygen species formation resulted in RIα oxidation in WT but not in KI mice. Within 6 weeks after TAC, KI mice showed an enhanced deterioration of contractile function and impaired survival compared with WT. In accordance, compared with WT, ventricular myocytes from failing KI mice displayed significantly reduced Ca transient amplitudes and lack of ICa stimulation. Conversely, direct pharmacological stimulation of ICa using Bay K8644 rescued Ca transients in AngII-treated KI myocytes and contractile function in failing KI mice in vivo. Conclusions Oxidative activation of PKARIα with subsequent stimulation of ICa preserves cardiac function in the setting of acute and chronic oxidative stress.

Keywords: heart failure; pressure overload; protein kinase A; redox.


Conflict of interest statement

None.

Figures

Figure 1
Figure 1. Acute exposure to Angiotensin II stimulates reactive oxygen species (ROS) and PKARIα (protein kinase A type I‐α regulatory subunit) oxidation.
Original traces (A) and mean data (B) of isolated ventricular myocytes from wild‐type (WT) and knock‐in (KI) mice loaded with the ROS sensor CellROX that were acutely exposed to AngII (angiotensin II). For improved visualization, gray scale values were converted to color using the depicted calibration bar. F/F0 indicates fluorescence intensity normalized to baseline fluorescence. AngII induced cytosolic ROS to a similar extent in WT and KI myocytes. Data are normally distributed (Shapiro‐Wilk test). *Indicates significance vs baseline using mixed‐effects analysis with Holm‐Sidak post‐test. C, An original Western blot of PKARIα dimer formation (ie, oxidation) in isolated WT and KI hearts perfused with AngII (1 µmol/L, 10 minutes). Upon nonreducing conditions, monomeric PKARIα subunits form a band at around 50 kDa, whereas oxidized PKARIα dimers have twice the molecular weight (at around 100 KDa). Compared with vehicle (AngII–), AngII increased PKARIα oxidation in WT only. Original traces (D) and mean values (E) for immunocytochemical analysis of PKARI (protein kinase A type I regulatory subunit) localization in isolated mouse ventricular myocytes. Scale bar in (D)=10 μm. Insets show magnification of subcellular localization at nucleus, transverse tubules (TT), and intercalated discs (ICD). For improved visualization, grayscale values were converted to color using the depicted calibration bar. Interestingly, exposure to AngII resulted in significantly enhanced PKARIα translocation to these specific regions of interest. At least 3 independent mice were used per group. Data are normally distributed (Shapiro‐Wilk test). *Indicates significance vs vehicle using 1‐way ANOVA with Holm‐Sidak post‐test.
Figure 2
Figure 2. AngII acutely regulates L‐type Ca current (I Ca) gating by oxidized PKARIα (protein kinase A type I‐α regulatory subunit).
Mean data for peak I Ca voltage relationship (A) and peak I Ca at 0 mV (B) measured by whole‐cell patch‐clamp technique in isolated mouse ventricular myocytes (protocol depicted on the right in A). Acute exposure to AngII (angiotensin II; 1 μmol/L, 10 minutes) significantly enhances peak I Ca, which could be blocked by inhibition of protein kinase A (PKA) using the PKA inhibitor H89. This AngII‐PKA–dependent enhancement of I Ca was completely absent in knock‐in (KI) myocytes. Data are normally distributed (Shapiro‐Wilk test). *Indicates significance vs wild‐type (WT). Indicates significance vs WT+AngII (2‐way repeated‐measures ANOVA, mixed‐effects model with Tukey post‐test). C and D, Original scans (C) and mean densitometric values (D) for Western blot analysis of L‐type Ca channel, alpha 1C subunit (CaV1.2) expression and serine 1928 phosphorylation (p‐LTCC [L‐type Ca channel]) in isolated hearts perfused with AngII (1 μmol/L, 10 minutes). Exposure to AngII significantly enhanced LTCC phosphorylation in WT but not KI mice. Data are normally distributed (Shapiro‐Wilk test). *Indicates significance vs WT+AngII using 1‐way ANOVA with Holm‐Sidak post‐test.
Figure 3
Figure 3. Lack of oxidized PKARIα (protein kinase A type I‐α regulatory subunit) impairs Ca handling upon acute AngII (angiotensin II) exposure.
Original traces of intracellular Ca transients at frequencies of 0.5 Hz (left) and 3 Hz (right) are shown in (A). Mean data for Ca transient amplitude upon a force‐frequency protocol (B) and the respective time constant (τ) of Ca transient decay (C) as measured in Fura‐2 loaded ventricular myocytes exposed to AngII or vehicle (veh). In wild‐type (WT) cardiomyocytes, exposure to AngII (1 μmol/L) does not affect Ca transient amplitude nor Ca transient decay. In contrast, AngII exposure significantly reduced Ca transient amplitude but did not alter Ca transient decay in myocytes lacking oxidative activation of PKRIα (knock‐in [KI]). Data are normally distributed (Shapiro‐Wilk test). *Indicates significance vs WTAngII. Indicates significance vs KI vehicle (2‐way repeated‐measures ANOVA, mixed‐effects model). D, Original confocal line scan images of isolated ventricular myocytes loaded with Fluo‐4 from WT (left panel) and KI (right panel) hearts. E, Sarcoplasmic reticulum (SR) Ca content as assessed by caffeine‐induced Ca transients (10 mmol/L) were evoked in ventricular myocytes loaded with Fura‐2. Exposure to AngII significantly reduced SR Ca content in both WT and KI myocytes. Data are normally distributed (Shapiro‐Wilk test). *Indicates significance using 1‐way ANOVA with Holm‐Sidak post‐test. F, Mean data for diastolic Ca spark frequency (CaSpF). Acute exposure to AngII (1 μmol/L) significantly enhanced CaSpF in both WT and KI myocytes to a similar extent. This increase was not abolished by PKA (protein kinase A) inhibition using the pharmacological PKA inhibitor H89. At least 3 independent mice were used per group. Data are not normally distributed. *Indicates significance using Kruskal‐Wallis test with Dunn post‐test. F340/F380 indicates the fluorescence intensity ratio measured with Fura‐2.
Figure 4
Figure 4. Enhanced heart failure development and increased mortality in PKARIα knock‐in (KI) mice.
Kaplan‐Meier analysis as depicted in (A) revealed that the survival of KI mice after transverse aortic constriction (TAC) (KI TAC) was dramatically reduced compared with wild‐type (WT) mice (WT TAC) *Indicates significance vs WT TAC). Original M‐mode traces (B) at baseline (BL), 1 week, and 6 weeks after TAC in WT (upper panel) and KI mice (lower panel). KI mice developed aggravated heart failure indicated by reduced left ventricular ejection fraction (LVEF) (C) in the face of comparable left ventricular hypertrophy (indicated by anterior wall thickness) (D) and initially compensated left ventricular end diastolic volume (LVEDV) (E). Heart frequency (F) was comparable between groups. Data are normally distributed (Shapiro‐Wilk test). *Indicates significance vs baseline. #Indicates significance vs WT. $Indicates significance vs previous phase using 2‐way (TW) ANOVA mixed‐effects model with Holm‐Sidak post‐test. n.s. indicates not significant.
Figure 5
Figure 5. Lack of oxidized PKARIα (protein kinase A type I‐α regulatory subunit) impairs Ca handling as early as 1 week after transverse aortic constriction (TAC).
Original traces (A) of intracellular Ca transients measured in Fura‐2–loaded ventricular myocytes from wild‐type (WT) (left panel) and knock‐in (KI) mice (right panel). Consistent with impaired ejection fraction, TAC resulted in significantly reduced Ca transient amplitude. However, this reduction was significantly more pronounced in KI mice. B, Mean data for Ca transient amplitudes during the time course of 6 weeks after TAC illustrate that Ca transient amplitudes were significantly decreased in KI as early as 1 week after TAC already. Data are normally distributed (Kolmogorov‐Smirnov test). Two‐way (TW) ANOVA with Holm‐Sidak post‐test. C, Sarcoplasmic reticulum (SR) Ca reuptake as approximated by Ca transient decay (τCa) was significantly increased in KI vs WT cells after TAC. Data are normally distributed (D'Agostino‐Pearson test). Two‐way ANOVA with Holm‐Sidak post‐test. D, Original confocal line scan images of isolated ventricular myocytes from WT and KI hearts loaded with Fluo‐4 at baseline (left panel) and following TAC (right panel). E, Mean data for diastolic Ca spark frequency (CaSpF) illustrate that CaSpF is increased in KI late after TAC (ie, after 6 weeks), but largely comparable at 1 week after TAC. Data are normally distributed (Shapiro‐Wilk test). Two‐way ANOVA with Holm‐Sidak post‐test. F, Mean data for SR Ca content as assessed by caffeine‐induced Ca transients. Data are normally distributed (Shapiro‐Wilk‐test). Two‐way ANOVA with Holm‐Sidak post‐test. *Indicates significance vs baseline (BL). #Indicates significance vs WT. $Indicates significance vs previous phase. n.s. indicates not significant. F340/F380 indicates the fluorescence intensity ratio measured with Fura‐2.
Figure 6
Figure 6. Oxidized PKARIα (protein kinase A type I‐α regulatory subunit) is required to stimulate I Ca upon transverse aortic constriction (TAC).
A, Original traces for I Ca measured by whole‐cell rupture‐patch clamp technique (protocol in the right panel) in isolated ventricular myocytes at baseline and late after TAC (ie, at 6 weeks). B, Mean data for peak I Ca voltage relationship at baseline (left panel), at 1 week after TAC (middle panel), and at 6 weeks after TAC (right panel). Peak I Ca at 0 mV is shown in (C). While I Ca density was transiently increased in wild‐type (WT) at 1 week after TAC and was still maintained at 6 weeks after TAC as compared with baseline, knock‐in (KI) cells displayed a lack of I Ca stimulation at 1 week and a reduction of peak I Ca at 6 weeks after TAC. Data are normally distributed (Shapiro‐Wilk test). *Indicates significance vs baseline. #Indicates significance vs WT. $Indicates significance vs previous phase using 2‐way (TW) ANOVA with Holm‐Sidak post‐test.
Figure 7
Figure 7. Absent PKARIα (protein kinase A type I‐α regulatory subunit) oxidation in PKARIα knock‐in (KI) following transverse aortic constriction (TAC).
Original traces (A) and mean data (B) of CellROX‐loaded isolated ventricular myocytes from wild‐type (WT) (left panel) and KI (right panel) following sham and TAC surgery imaged every minute for 13 minutes by confocal microscopy. F/F0 indicates the fluorescence intensity normalized to baseline fluorescence. For improved visualization, gray scale values were converted to color using the depicted calibration bar. TAC induced cytosolic ROS to a similar extent in WT and KI myocytes as depicted in (B). Data are normally distributed (Shapiro‐Wilk test). *Indicates significance vs KI sham. Indicates significance vs WT sham (using 2‐way [TW] ANOVA mixed‐effects model with Tukey post‐test). C, Original Western blots depict PKARIα dimer formation in WT hearts at baseline (BL) (upper left panel) and following TAC (upper right panel) that is completely absent in KI samples. Bottom panels in (C) depict representative Western blots of important protein kinase A (PKA)‐dependent target proteins including the RyR2 (ryanodine receptor type 2) (and PKA‐specific phosphorylation at serine 2809), SERCA2a (SR Ca ATPase 2a), and PLB (phospholamban) (and PKA‐specific phosphorylation at serine 16). Mean data for PKARIα oxidation (ie, dimer to monomer ratio) are given in (D). E, A TAC‐related increase in cAMP (3',5'‐cyclic adenosine monophosphate) was observed to a similar extent in WT and KI hearts. F, Comparable activity of PKA following TAC between groups. D, Data are normally distributed (D'Agostino‐Pearson test). Two‐way ANOVA with Holm–Sidak post‐test. E and F, Data are normally distributed (Shapiro‐Wilk test). Two‐way ANOVA with Holm‐Sidak post‐test. *Indicates significance vs baseline. #Indicates significance vs WT. $Indicates significance vs previous phase. GAPDH indicates glyceraldehyde‐3‐phosphate dehydrogenase; and n.s., not significant.
Figure 8
Figure 8. Pharmacological stimulation of I Ca (L‐type Ca current) using Bay K8644 restores Ca transients in AngII (angiotensin II)‐treated knock‐in (KI) myocytes and rescues left ventricular dysfunction in failing KI mice following transverse aortic constriction (TAC).
A, Original traces (A) of intracellular Ca transients measured in Fura‐2 loaded ventricular myocytes from wild‐type (WT) (upper panel) and KI mice (lower panel) in the absence (left) and presence of 1 µmol/L Bay K8644 (right). F340/F380 indicates the fluorescence intensity ratio measured with Fura‐2. Although Ca transients were significantly reduced in KI cells upon sole AngII treatment (left), addition of Bay K8644 induced a significant increase in Ca transient amplitude in both groups that was significantly more pronounced in KI cells (right). Average data for (A) are depicted in (B). Data are normally distributed (Shapiro‐Wilk test). *Indicates significance vs AngII control using 2‐way (TW) ANOVA with Holm‐Sidak post‐test. C, Original M‐mode traces of WT (upper panel) and KI mice (lower panel) after TAC and following acute stimulation of I Ca using Bay K8644. Average data in (D) demonstrate a significantly enhanced inotropic response in KI mice following acute stimulation of I Ca using Bay K8644. Data are normally distributed (D'Agostino‐Pearson test). #Indicates significance vs WT using unpaired t test. LVEF indicates left ventricular ejection fraction.

References

    1. Wagner S, Rokita AG, Anderson ME, Maier LS. Redox regulation of sodium and calcium handling. Antioxid Redox Signal. 2013;18:1063–1077. DOI: 10.1089/ars.2012.4818. - DOI - PMC - PubMed
    1. Sag CM, Wagner S, Maier LS. Role of oxidants on calcium and sodium movement in healthy and diseased cardiac myocytes. Free Radic Biol Med. 2013;63:338–349. DOI: 10.1016/j.freeradbiomed.2013.05.035. - DOI - PubMed
    1. Gill JS, McKenna WJ, Camm AJ. Free radicals irreversibly decrease Ca2+ currents in isolated guinea‐pig ventricular myocytes. Eur J Pharmacol. 1995;292:337–340. - PubMed
    1. Morris TE, Sulakhe PV. Sarcoplasmic reticulum Ca(2+)‐pump dysfunction in rat cardiomyocytes briefly exposed to hydroxyl radicals. Free Radic Biol Med. 1997;22:37–47. - PubMed
    1. Wagner S, Dantz C, Flebbe H, Azizian A, Sag CM, Engels S, Möllencamp J, Dybkova N, Islam T, Shah AM, et al. NADPH oxidase 2 mediates angiotensin II‐dependent cellular arrhythmias via PKA and CaMKII. J Mol Cell Cardiol. 2014;75:206–215. DOI: 10.1016/j.yjmcc.2014.07.011. - DOI - PubMed

Publication types

Substances