Review
. 2021 Sep;18(182):20210555.
doi: 10.1098/rsif.2021.0555. Epub 2021 Sep 29.

Early warning signals of infectious disease transitions: a review

Affiliations
Review

Early warning signals of infectious disease transitions: a review

Emma Southall et al. J R Soc Interface. 2021 Sep.

Abstract

Early warning signals (EWSs) are a group of statistical time-series signals which could be used to anticipate a critical transition before it is reached. EWSs are model-independent methods that have grown in popularity to support evidence of disease emergence and disease elimination. Theoretical work has demonstrated their capability of detecting disease transitions in simple epidemic models, where elimination is reached through vaccination, to more complex vector transmission, age-structured and metapopulation models. However, the exact time evolution of EWSs depends on the transition; here we review the literature to provide guidance on what trends to expect and when. Recent advances include methods which detect when an EWS becomes significant; the earlier an upcoming disease transition is detected, the more valuable an EWS will be in practice. We suggest that future work should firstly validate detection methods with synthetic and historical datasets, before addressing their performance with real-time data which is accruing. A major challenge to overcome for the use of EWSs with disease transitions is to maintain the accuracy of EWSs in data-poor settings. We demonstrate how EWSs behave on reported cases for pertussis in the USA, to highlight some limitations when detecting disease transitions with real-world data.

Keywords: critical slowing down; critical transitions; disease elimination; disease emergence; early warning signals; time-series signals.


Figures

Figure 1.
Figure 1.
Bifurcation diagram of a typical epidemiological model. Transcritical zero-eigenvalue bifurcation diagram for an SIS model: bifurcation occurs at R0 = 1; if R0 < 1 then the disease-free state (I* = 0) is stable while if R0 > 1 then the endemic steady state (I* > 0) is stable.
Figure 2.
Figure 2.
Time-series trends (theoretical). For the SIS model with external forcing the system is forced from the disease endemic state to the disease-free state ((a) disease elimination); and in reverse from the disease-free state ((b) disease emergence). The vertical red line denotes where the bifurcation occurs, when t = 250, R0 = 1. In both cases, the system is forced by slowly changing the transmission rate β(t) ∈ [0, 1] and keeping the recovery rate γ = 0.5 fixed, causing R0 to decrease from R0 = 2 to R0 = 0 (a) and in reverse R0 = 0 increases to R0 = 2 (b). The change in R0 happens at rate p = 1/500. Results for prevalence are shown by the solid black lines, and incidence by the dashed black lines. (a) Disease elimination theory and (b) disease emergence theory.
Figure 3.
Figure 3.
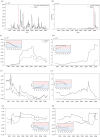
Time-series trends of EWSs. EWSs calculated on monthly pertussis incidence data. (a,c,e,g) show trends for Vermont (highest incidence burden between 1992 and 2007). (b,d,f,h) show trends for Mississippi (lowest incidence burden between 1992 and 2007). EWSs calculated using spatial detrending are shown by solid lines, and with Gaussian detrending by dashed lines (window size 10% of time-series length (window size = 70), standard deviation of Gaussian filter calculated using Silverman’s rule of thumb (s.d. = 4.55, mean over states)). EWSs were calculated on detrended time series using moving averages (right window) with window size 10% of time series, data prior to 1991 was cut off after calculations. Inset shows Kendall’s τ score for each EWS on varying amounts of data up to 2007. Kendall’s τ at time point t is calculated over the window EWS ∈ [t, 2007]. (a) Incidence (Vermont). (b) Incidence (Mississippi). (c) Variance (Vermont). (d) Variance (Mississippi). (e) Coefficient of variation (Vermont). (f) Coefficient of variation (Mississippi). (g) Autocorrelation lag-1 (Vermont). (h) Autocorrelation lag-1 (Mississippi).
Figure 4.
Figure 4.
Kendall’s τ score for variance, coefficient of variation (CoV) and autocorrelation lag-1 (AC(1)). Kendall’s τ score calculated on EWSs for each state between 1992 and 2007. A score near 1 indicates an increasing trend in the EWS, while a score near −1 indicates a decreasing trend. (a,c,e) show EWSs calculated on spatial-detrending data; (b,d,f) show EWSs calculated on Gaussian-detrending data as described in electronic supplementary material, figure S2. States labelled ‘H’ indicate the four states of highest incidence (Vermont, Massachusetts, New Hampshire, Idaho); states labelled ‘L’ indicate the four states with lowest incidence during this period (Mississippi, Louisiana, West Virginia, Georgia). (a) Variance (spatial detrending). (b) Variance (Gaussian detrending). (c) CoV (spatial detrending). (d) CoV (Gaussian detrending). (e) AC(1) (spatial detrending). (f) AC(1) (Gaussian detrending).

References

    1. World Health Organization. 2002The world health report 2002: reducing risks, promoting healthy life. World Health Organization. See https://apps.who.int/iris/handle/10665/67454. - PubMed
    1. World Health Organization. 2019 Poliomyelitis. See https://www.who.int/news-room/fact-sheets/detail/poliomyelitis (accessed 4 June 2021).
    1. Ngonghala CN, De Leo GA, Pascual MM, Keenan DC, Dobson AP, Bonds MH. 2017General ecological models for human subsistence, health and poverty. Nat. Ecol. Evol. 1, 1153-1159. (10.1038/s41559-017-0221-8) - DOI - PubMed
    1. Farrington CP, Andrews NJ, Beale AD, Catchpole MA. 1996A statistical algorithm for the early detection of outbreaks of infectious disease. J. R. Stat. Soc. A (Stat. Soc.) 159, 547-563. (10.2307/2983331) - DOI
    1. Unkel S, Farrington CP, Garthwaite PH, Robertson C, Andrews N. 2012Statistical methods for the prospective detection of infectious disease outbreaks: a review. J. R. Stat. Soc. A (Stat. Soc.) 175, 49-82. (10.1111/rssa.2011.175.issue-1) - DOI

Publication types