

Global socioeconomic inequality in the burden of communicable and non-communicable diseases and injuries: an analysis on global burden of disease study 2019
- PMID: 34583668
- PMCID: PMC8480106
- DOI: 10.1186/s12889-021-11793-7
Global socioeconomic inequality in the burden of communicable and non-communicable diseases and injuries: an analysis on global burden of disease study 2019
Abstract
Background: Examining the distribution of the burden of different communicable and non-communicable diseases and injuries worldwide can present proper evidence to global policymakers to deal with health inequality. The present study aimed to determine socioeconomic inequality in the burden of 25 groups of diseases between countries around the world in 2019.
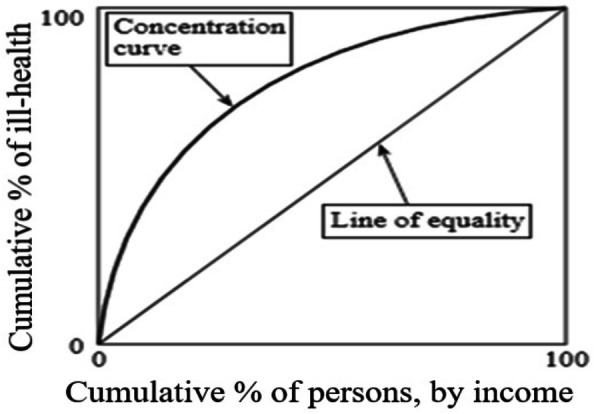
Methods: In the current study data according to 204 countries in the world was gathered from the Human Development Report and the Global Burden of Diseases study. Variables referring to incidence, prevalence, years of life lost (YLL), years lived with disability (YLD) and disability adjusted life years (DALY) resulting by 25 groups of diseases and injuries also human development index was applied for the analysis. For measurement of socioeconomic inequality, concentration index (CI) and curve was applied. CI is considered as one of the popular measures for inequality measurement. It ranges from - 1 to + 1. A positive value implies that a variable is concentrated among the higher socioeconomic status population and vice versa.
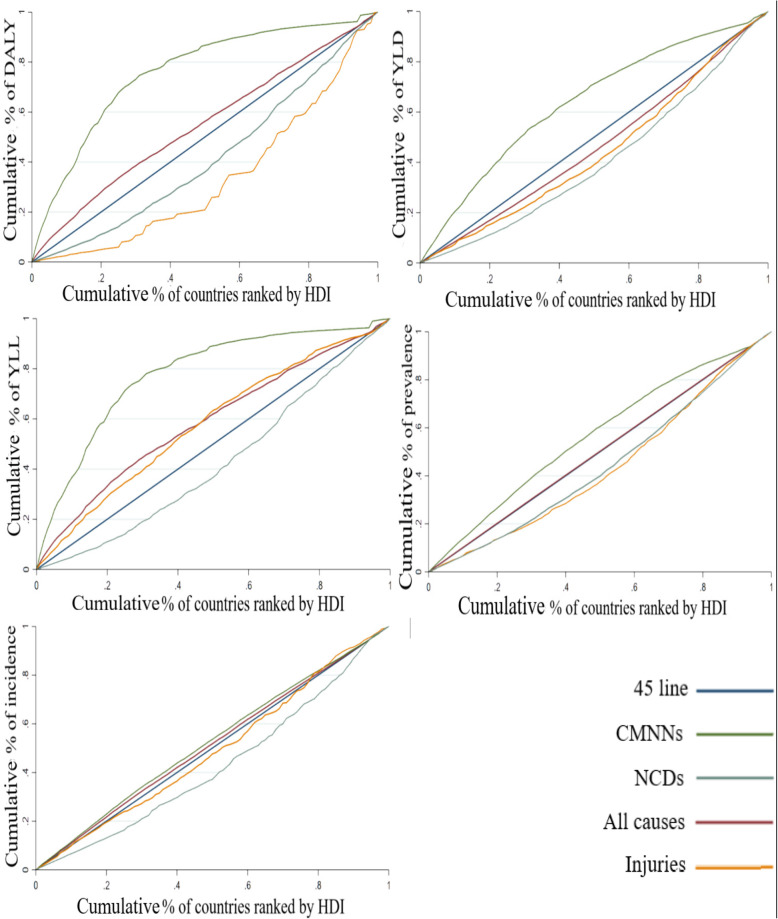
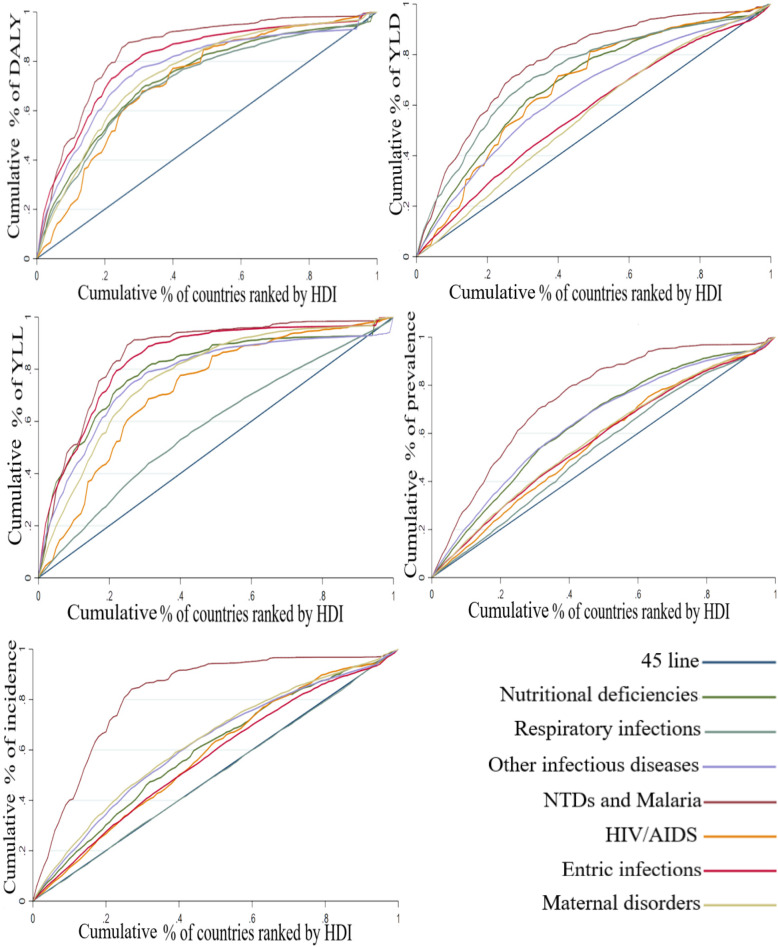
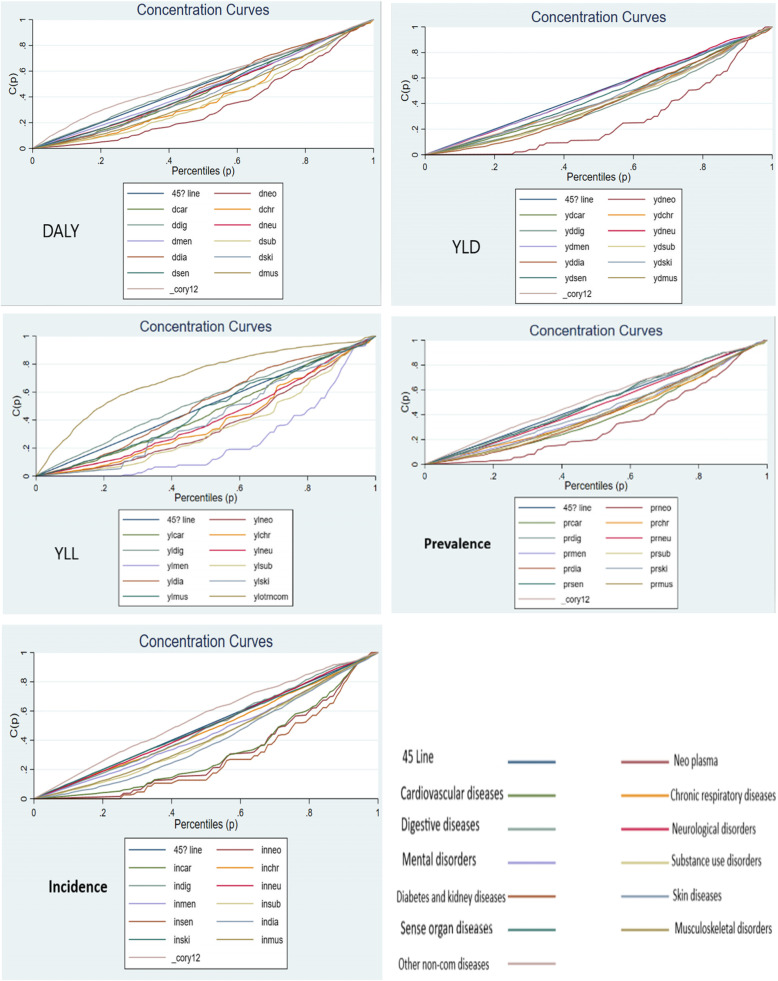
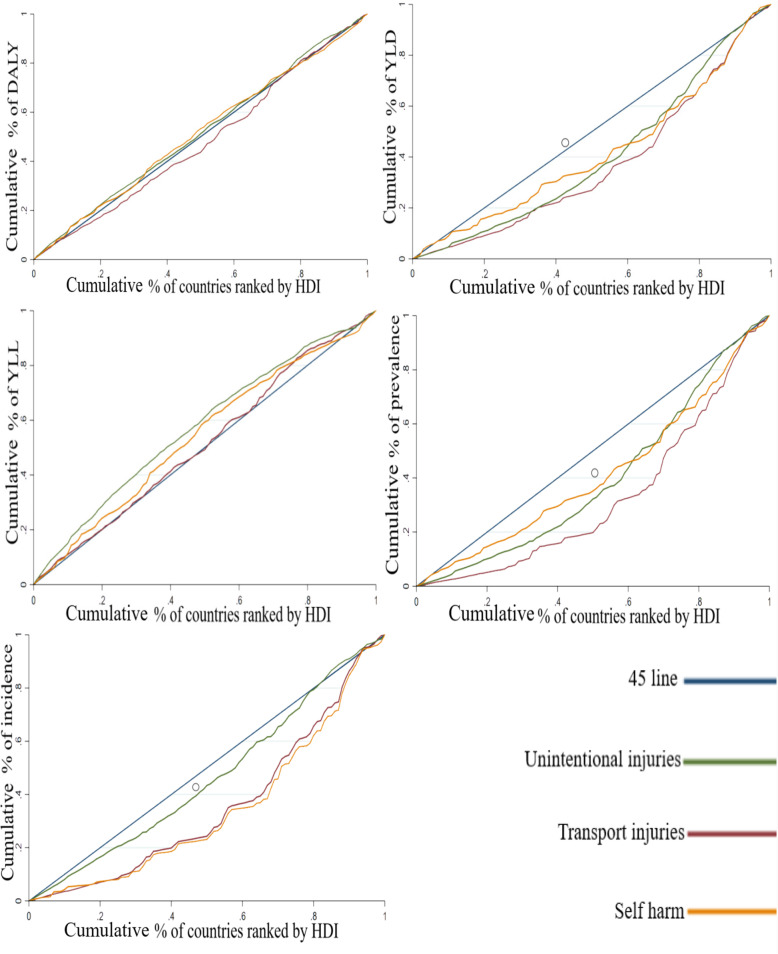
Results: The findings showed that CI of the incidence, prevalence, YLL, YLD and DALY for all causes were - 0.0255, - 0.0035, - 0.1773, 0.0718 and - 0.0973, respectively. CI for total Communicable, Maternal, Neonatal, and Nutritional Diseases (CMNNDs) incidence, prevalence, YLL, YLD and DALY were estimated as - 0.0495, - 0.1355, - 0.5585, - 0.2801 and - 0.5203, respectively. Moreover, estimates indicated that CIs of incidence, prevalence, YLL, YLD and DALY for Non-Communicable Diseases (NCDs) were 0.1488, 0.1218, 0.1552, 0.1847 and 0.1669, respectively. Regarding injuries, the CIs of incidence, prevalence, YLL, YLD and DALY were determined as 0.0212, 0.1364, - 0.1605, 0.1146 and 0.3316, respectively. In the CMNNDs group, highest and lowest CI of DALY were related to the respiratory infections and tuberculosis (- 0.4291) and neglected tropical diseases and malaria (- 0.6872). Regarding NCDs, the highest and lowest CI for DALY is determined for neoplasms (0.3192) and other NCDs (- 0.0784). Moreover, the maximum and minimum of CI of DALY for injuries group were related to the transport injuries (0.0421) and unintentional injuries (- 0.0297).
Conclusions: The distribution of all-causes and CMNNDs burden were more concentrated in low-HDI countries and there are pro-poor inequality. However, there is a pro-rich inequality for NCDs' burden i.e. it was concentrated in high-HDI countries. On the other hand, the concentration of DALY, YLD, prevalence, and incidence in injuries was observed in the countries with higher HDI, while YLL was concentrated in low-HDI countries.
Keywords: Burden of diseases; Communicable diseases; Human development index; Inequality; Injuries; Non-communicable.
© 2021. The Author(s).
Conflict of interest statement
The authors declared no potential conflicts of interest.
Figures
Similar articles
-
Socio-economic inequality in the nutritional deficiencies among the world countries: evidence from global burden of disease study 2019.J Health Popul Nutr. 2025 Jan 13;44(1):8. doi: 10.1186/s41043-025-00739-z. J Health Popul Nutr. 2025. PMID: 39806471 Free PMC article.
-
Nations within a nation: variations in epidemiological transition across the states of India, 1990-2016 in the Global Burden of Disease Study.Lancet. 2017 Dec 2;390(10111):2437-2460. doi: 10.1016/S0140-6736(17)32804-0. Epub 2017 Nov 14. Lancet. 2017. PMID: 29150201 Free PMC article.
-
Inequalities in the burden of non-communicable diseases across European countries: a systematic analysis of the Global Burden of Disease 2019 study.Int J Equity Health. 2023 Jul 28;22(1):140. doi: 10.1186/s12939-023-01958-8. Int J Equity Health. 2023. PMID: 37507733 Free PMC article.
-
Cutaneous leishmaniasis and co-morbid major depressive disorder: A systematic review with burden estimates.PLoS Negl Trop Dis. 2019 Feb 25;13(2):e0007092. doi: 10.1371/journal.pntd.0007092. eCollection 2019 Feb. PLoS Negl Trop Dis. 2019. PMID: 30802261 Free PMC article.
-
Burden of non-communicable disease studies in Europe: a systematic review of data sources and methodological choices.Eur J Public Health. 2022 Apr 1;32(2):289-296. doi: 10.1093/eurpub/ckab218. Eur J Public Health. 2022. PMID: 35015851 Free PMC article.
Cited by
-
Trends and projections of the global burden of thyroid cancer from 1990 to 2030.J Glob Health. 2024 May 17;14:04084. doi: 10.7189/jogh.14.04084. J Glob Health. 2024. PMID: 38751316 Free PMC article.
-
Commentary: Developing technical support and strategic dialogue at the country level to achieve primary health care-based health systems beyond the COVID-19 era.Front Public Health. 2023 Aug 25;11:1212271. doi: 10.3389/fpubh.2023.1212271. eCollection 2023. Front Public Health. 2023. PMID: 37693718 Free PMC article. No abstract available.
-
Global burden and inequality of maternal and neonatal disorders: based on data from the 2019 Global Burden of Disease study.QJM. 2024 Feb 7;117(1):24-37. doi: 10.1093/qjmed/hcad220. QJM. 2024. PMID: 37773990 Free PMC article.
-
The Socio-Economic Burden of Spinal Muscular Atrophy: A Cost-of-Illness Study in Bulgaria.Healthcare (Basel). 2025 Feb 13;13(4):401. doi: 10.3390/healthcare13040401. Healthcare (Basel). 2025. PMID: 39997276 Free PMC article.
-
The nurture of nature: why physical and psychological differences between the sexes are greater in healthier, wealthier societies.Biol Lett. 2025 Jun;21(6):20250187. doi: 10.1098/rsbl.2025.0187. Epub 2025 Jun 25. Biol Lett. 2025. PMID: 40555376 Review.
References
-
- World Health Organization . The world health report 2000: health systems: improving performance: World Health Organization. 2000.
-
- Mill J, Astle B, Ogilvie L, Opare M. Global Health and Equity. Canadian Nurse. 2005;101:5. - PubMed
-
- Shin H. Income related inequity in health care access and delivery: University of South Carolina. 2003.
Publication types
MeSH terms
LinkOut - more resources
Full Text Sources
Medical
