

Identification and validation of hub genes of synovial tissue for patients with osteoarthritis and rheumatoid arthritis
- PMID: 34583778
- PMCID: PMC8480049
- DOI: 10.1186/s41065-021-00201-0
Identification and validation of hub genes of synovial tissue for patients with osteoarthritis and rheumatoid arthritis
Abstract
Background: Osteoarthritis (OA) and rheumatoid arthritis (RA) were two major joint diseases with similar clinical phenotypes. This study aimed to determine the mechanistic similarities and differences between OA and RA by integrated analysis of multiple gene expression data sets.
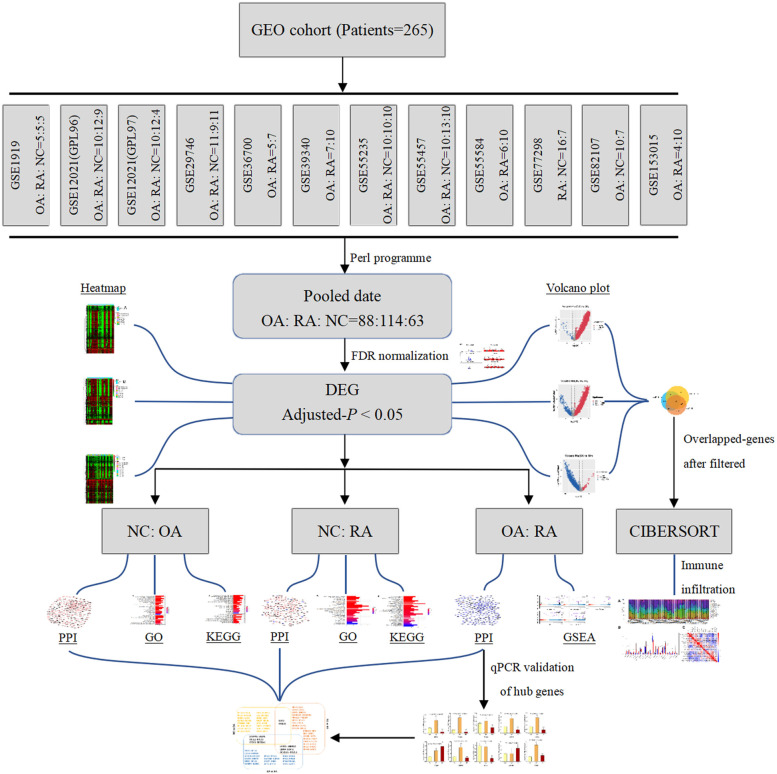
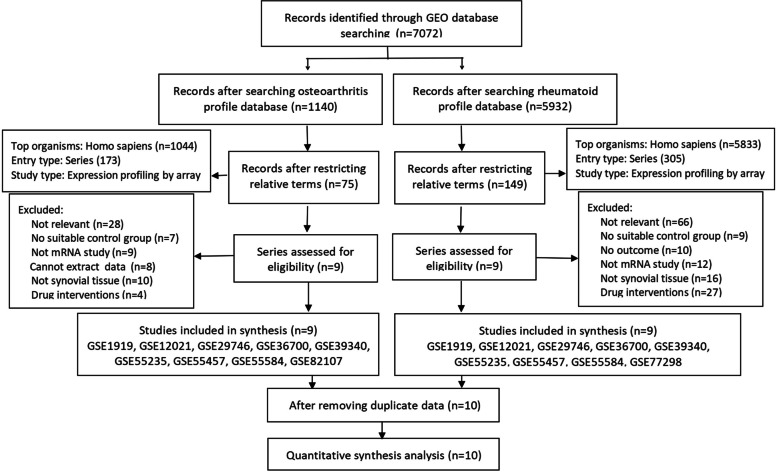
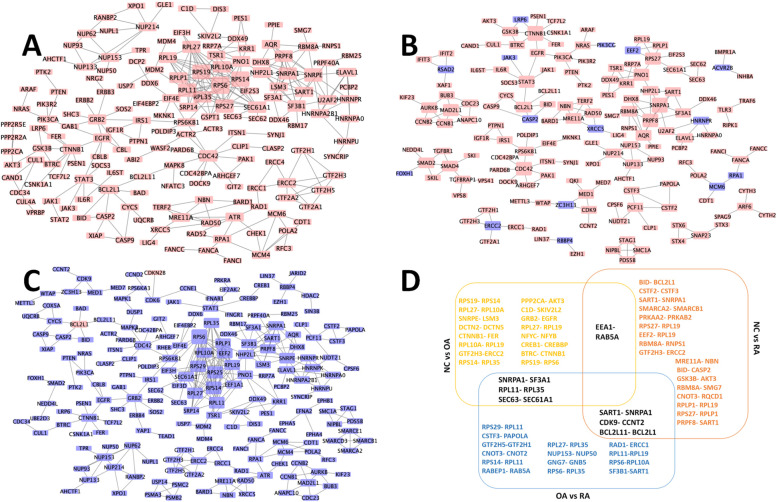
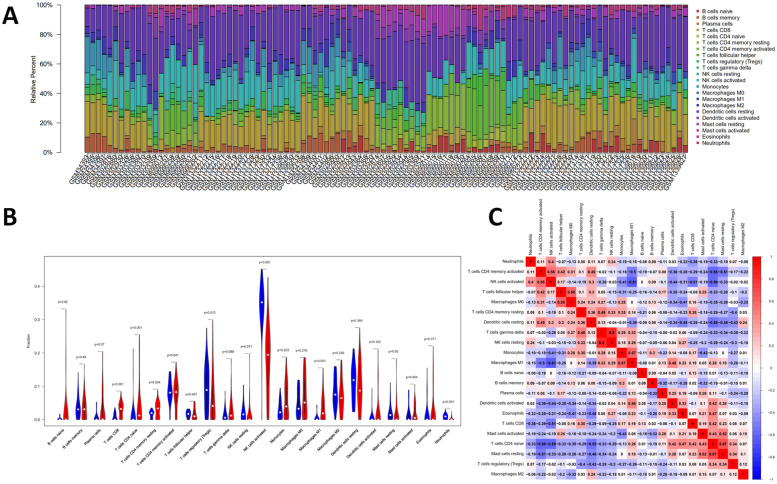
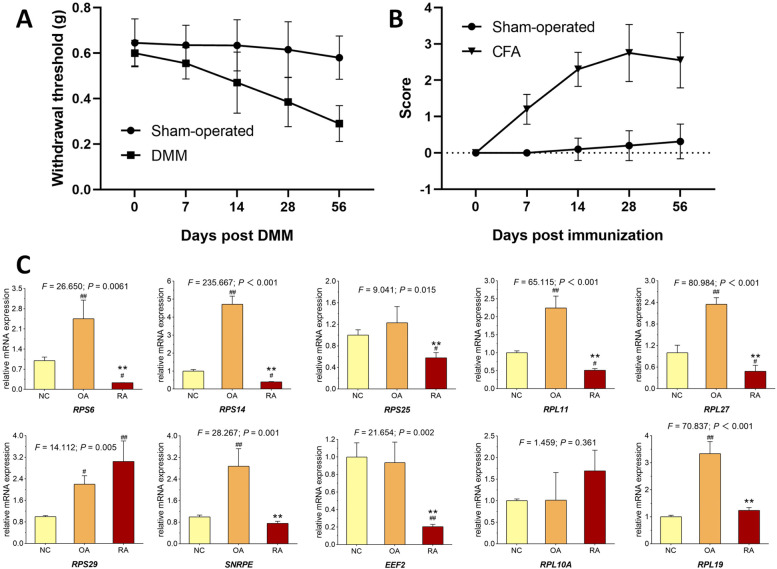
Methods: Microarray data sets of OA and RA were obtained from the Gene Expression Omnibus (GEO). By integrating multiple gene data sets, specific differentially expressed genes (DEGs) were identified. The Gene Ontology (GO) functional annotation, Kyoto Encyclopedia of Genes and Genomes (KEGG) pathways and protein-protein interaction (PPI) network analysis of DEGs were conducted to determine hub genes and pathways. The "Cell Type Identification by Estimating Relative Subsets of RNA Transcripts (CIBERSORT)" algorithm was employed to evaluate the immune infiltration cells (IICs) profiles in OA and RA. Moreover, mouse models of RA and OA were established, and selected hub genes were verified in synovial tissues with quantitative polymerase chain reaction (qPCR).
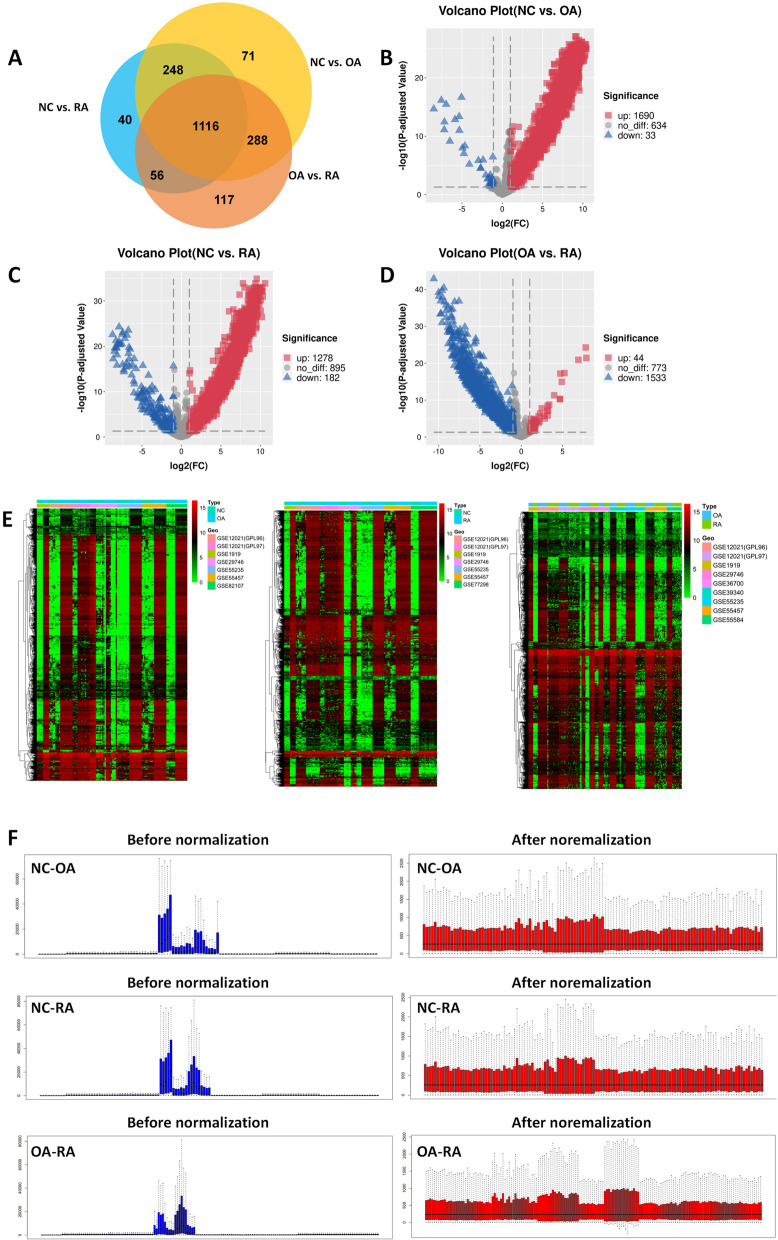
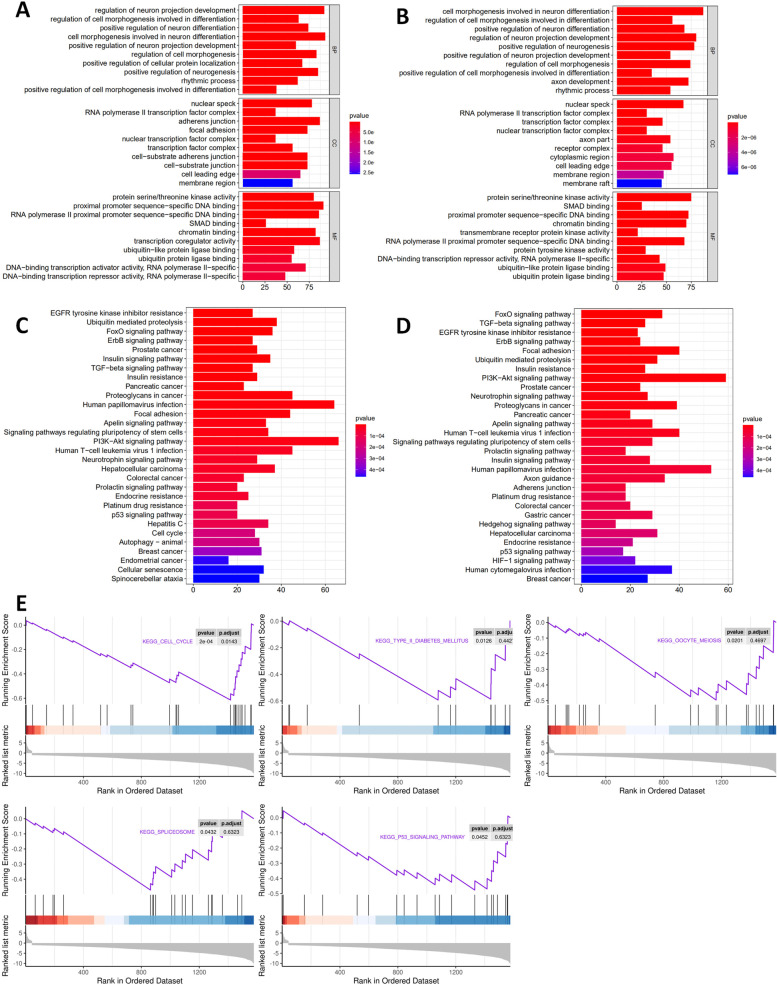
Results: A total of 1116 DEGs were identified between OA and RA. GO functional enrichment analysis showed that DEGs were enriched in regulation of cell morphogenesis involved in differentiation, positive regulation of neuron differentiation, nuclear speck, RNA polymerase II transcription factor complex, protein serine/threonine kinase activity and proximal promoter sequence-specific DNA binding. KEGG pathway analysis showed that DEGs were enriched in EGFR tyrosine kinase inhibitor resistance, ubiquitin mediated proteolysis, FoxO signaling pathway and TGF-beta signaling pathway. Immune cell infiltration analysis identified 9 IICs with significantly different distributions between OA and RA samples. qPCR results showed that the expression levels of the hub genes (RPS6, RPS14, RPS25, RPL11, RPL27, SNRPE, EEF2 and RPL19) were significantly increased in OA samples compared to their counterparts in RA samples (P < 0.05).
Conclusion: This large-scale gene analyses provided new insights for disease-associated genes, molecular mechanisms as well as IICs profiles in OA and RA, which may offer a new direction for distinguishing diagnosis and treatment between OA and RA.
Keywords: Bioinformatics analysis; Differentially expressed genes; Immune infiltration; Osteoarthritis; Rheumatoid arthritis.
© 2021. The Author(s).
Conflict of interest statement
The authors declare that they have no competing interests.
Figures
References
-
- Misra S, Mondal S, Chatterjee S, Guin A, Sinhamahapatra P, Ghosh A. Association of angiogenic and inflammatory markers with power doppler ultrasound vascularity grade and DAS28-CRP in early rheumatoid arthritis: A comparative analysis. Biomed Res Int. 2018;2018:6906374. doi: 10.1155/2018/6906374. - DOI - PMC - PubMed
-
- Ma VY, Chan L, Carruthers KJ. Incidence, prevalence, costs, and impact on disability of common conditions requiring rehabilitation in the United States: stroke, spinal cord injury, traumatic brain injury, multiple sclerosis, osteoarthritis, rheumatoid arthritis, limb loss, and back pain. Arch Phys Med Rehabil. 2014;95(5):986. doi: 10.1016/j.apmr.2013.10.032. - DOI - PMC - PubMed
-
- Wasserman AM. Diagnosis and management of rheumatoid arthritis. Am Fam Physician. 2011;84(11):1245–1252. - PubMed
MeSH terms
Grants and funding
LinkOut - more resources
Full Text Sources
Medical
Research Materials
Miscellaneous
