. 2021 Sep 28;4(12):e202101141.
doi: 10.26508/lsa.202101141. Print 2021 Dec.

The DREAM complex represses growth in response to DNA damage in Arabidopsis

Affiliations

The DREAM complex represses growth in response to DNA damage in Arabidopsis

Lucas Lang et al. Life Sci Alliance. .

Abstract

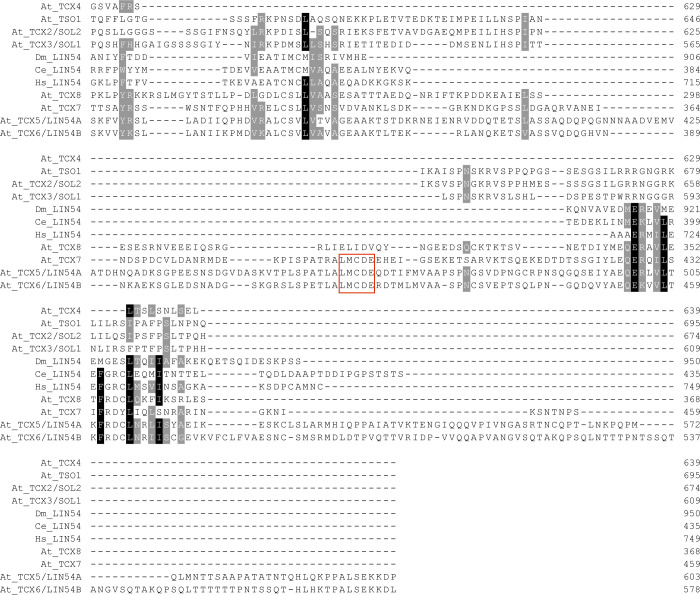
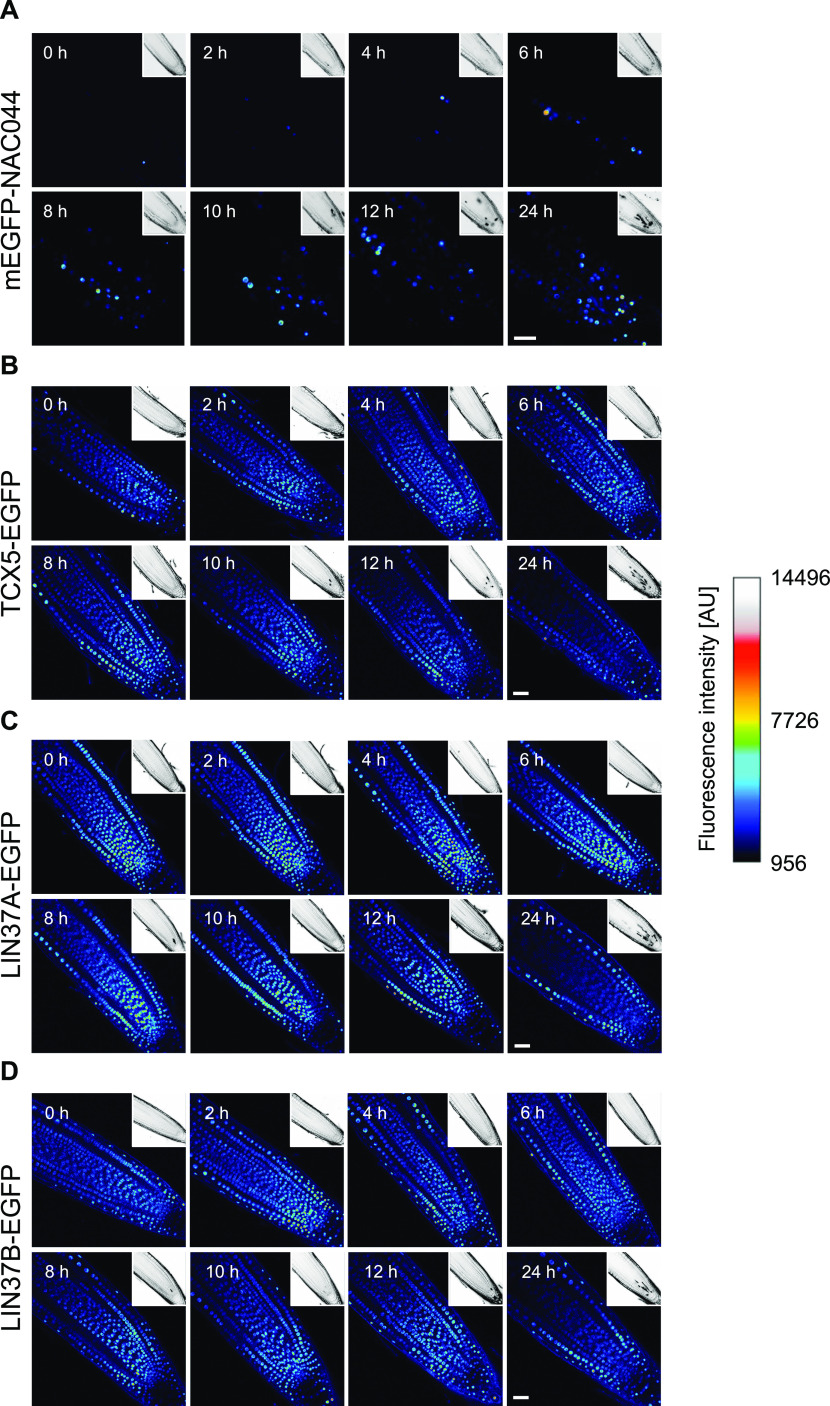
The DNA of all organisms is constantly damaged by physiological processes and environmental conditions. Upon persistent damage, plant growth and cell proliferation are reduced. Based on previous findings that RBR1, the only Arabidopsis homolog of the mammalian tumor suppressor gene retinoblastoma, plays a key role in the DNA damage response in plants, we unravel here the network of RBR1 interactors under DNA stress conditions. This led to the identification of homologs of every DREAM component in Arabidopsis, including previously not recognized homologs of LIN52. Interestingly, we also discovered NAC044, a mediator of DNA damage response in plants and close homolog of the major DNA damage regulator SOG1, to directly interact with RBR1 and the DREAM component LIN37B. Consistently, not only mutants in NAC044 but also the double mutant of the two LIN37 homologs and mutants for the DREAM component E2FB showed reduced sensitivities to DNA-damaging conditions. Our work indicates the existence of multiple DREAM complexes that work in conjunction with NAC044 to mediate growth arrest after DNA damage.


Conflict of interest statement

The authors declare that they have no conflict of interest.

Figures

Figure 1.
Figure 1.. Overview of tandem affinity purification (TAP) results from cisplatin-treated cell cultures.
Cytoscape representation of all TAP experiments from cisplatin-treated cell culture. Proteins taken as baits are shown in large rectangles, proteins only found as prey are represented by small rectangles. TAPs with NAC044, LIN52A, and TCX5 as bait were performed with both N-terminally and C-terminally tagged proteins. Thick black edges indicate that the corresponding prey was detected with both tags, whereas dashed and dotted edges denote detection only with N-terminal and C-terminal tagging, respectively. For RBR1, only an N-terminally tagged version was used. If an edge connects two proteins which both served as bait in different experiments, arrowheads indicate which proteins have been found as prey. Dark blue: MuvB-core proteins; light blue: other DREAM components; orange: known DNA damage regulators; grey: other interactors.
Figure S1.
Figure S1.. Multiple sequence alignment of LIN52 homologs.
Protein sequence alignment of the LIN52 homologs from Caenorhabditis elegans (Cell; Q10120), Drosophila melanogaster (Dme; NP_572256.1), Arabidopsis thaliana (Ath; LIN52A = AT2G45250.1; LIN52B = AT4G38280.1), and human (Hs; Q52LA3). The LxSxExL motif of the human LIN52 which binds to the LxCxE cleft in p107 is boxed in red (Guiley et al, 2015). Note that the Arabidopsis LIN52 homologs are not conserved in this region.
Figure S2.
Figure S2.. Label-free GFP pulldowns of individual DREAM complex members.
(A, B, C, D) Volcano plots representing fold change (Log2) plotted against adjusted P-values (−Log10) for protein interactors of E2FA-GFP (A), E2FB-GFP (B), E2FC-GFP (C), and RBR1-GFP (D) that passed filtration for each bait. The statistically enriched bait interactors are color-coded blue in the upper right hand corner, separated from background (black) by cut-off criteria represented by dashed grey lines. Known DREAM homologs are indicated red and are annotated.
Figure 2.
Figure 2.. Meta-Analysis of FP-IP results from seedlings.
Cytoscape representation of a meta-analysis of 182 FP-IPs using different bait proteins (35 × E2FA-GFP [blue], 39 × E2FB-GFP [red], 20 × E2FC-GFP [green], 32 × RBR1-GFP [yellow], 3 × DPA-GFP [orange], and 3 × DPB-CFP [pale-orange], 50 × GFP [control]). To reduce complexity, only prey proteins which were enriched in at least one third of the IPs of one bait are shown. For the more comprehensive dataset, see Table S4. The thickness of the edges corresponds to the frequency of positive IPs by which a bait/prey interaction was found. Proteins that were also identified in the tandem affinity purification experiments are represented by an ellipse. Prey proteins are grouped according to their occurences in different E2F-IPs. DREAM complex homologs are shown in dark blue. Additional proteins that display an interaction pattern like the DREAM component homologs, that is, do not interact with E2FA, but interact with E2FB/C and the DPs, are shown in bold with a thick outline.
Figure 3.
Figure 3.. Binary interactions of DREAM complex components and additional proteins.
Results of Y2H assays testing the here-identified DREAM complex components and selected additional proteins for binary interactions. AD, activating domain; BD, DNA-binding domain. (A) Interaction matrix. Signal strength was classified according to yeast growth on different dropout media in two categories and is indicated by shades of blue. Dark blue, signal on QDO; light blue, signal on TDO but not on QDO; orange, signal not stronger than with mEGFP control; dark grey, strong auto-activation observed using the BD construct and an AD-mEGFP control. (B) Cytoscape representation of the observed interaction network. Interactions are indicated by an edge between two protein nodes and were classified according to yeast growth in two categories. If yeast growth was observed with a pair of proteins in both AD/BD combinations, the stronger signal is shown. Thick line, growth on QDO; thin line, growth on TDO but not on QDO. Dark blue, MuvB-core proteins; light blue, other DREAM components; orange, known DNA damage regulators; grey, other interactors.
Figure S3.
Figure S3.. Multiple sequence alignment of LIN54 homologs.
Protein sequence alignment of LIN54 homologs from Drosophila melanogaster (Dm; A1Z9E2), Caenorhabditis elegans (Ce; Q95QD7), human (Hs; Q6MZP7), and Arabidopsis thaliana (At; TSO1 = AT3G22780.1; TCX2/SOL2 = AT4G14770.1; TCX3/SOL1 = AT3G22760.1; TCX4 = AT3G04850.1; TCX5/LIN54A = AT4G29000.1; TCX6/LIN54B = AT2G20110.1; TCX7 = AT5G25790.1; TCX8 = AT3G16160.1). Only Arabidopsis TCX5 and TCX6 were identified in complexes with other DREAM components in this study. LxCxE motifs are boxed in red. The DNA-binding CRC domain of the human LIN54 as annotated by Prosite (annotation rule: PRU00971) is boxed in green.
Figure 4.
Figure 4.. The LxCxE motif of TCX5 and TCX6 is essential for interaction with RBR1.
Y2H interaction assays to test for binary interaction of wild type as well as mutant TCX5 and TCX6 with RBR1, TCX6, and mEGFP as auto-activation control. AxAxA replaces the LxCxE motif in the mutant proteins. AD, activating domain; BD, DNA-binding domain. Yeast cells were diluted as shown on top and spotted on different dropout media as indicated below. Growth on TDO and QDO indicates interaction.
Figure S4.
Figure S4.. LIN54 homologs without LxCxE motif do not interact with RBR1 in the Y2H assay.
Y2H interaction assays to test for binary interaction of different wild type or mutated LIN54 homologs (TCX5, TCX5AxAxA, TCX6, TCXAxAxA, TSO1, SOL1, SOL2) with RBR1. AxAxA replaces the LxCxE motif in the mutant proteins. AD, activating domain; BD, DNA-binding domain. Yeast cells were diluted as shown on top and spotted on different dropout media as indicated below. Growth on TDO and QDO indicates interaction. Interaction with RBR1 was only detected for TCX5 and TCX6, whereas no interaction was seen for TCX5AxAxA, TCX6AxAxA, TSO1, SOL1, and SOL2, which by mutation or naturally do not contain an LxCxE motif. mEGFP was used as auto-activation control. MYB3R3 was included as positive control for the TSO1, SOL1, and SOL2 Y2H constructs.
Figure S5.
Figure S5.. Expression of LIN54 homologs in Arabidopsis thaliana.
Publicly available mRNA seq data of 1879 wild-type A. thaliana samples were analyzed for TSO1, TCX2 (SOL2), TCX3 (SOL1), TCX4, TCX5 (LIN54A), TCX6 (LIN54B), TCX7, and TCX8 using the GENEVESTIGATOR Software (Hruz et al, 2008). (A, B) Expression levels are displayed with respect to developmental stages (A) and anatomy (B).
Figure 5.
Figure 5.. The LxCxE domain of NAC044 is essential for interaction with RBR1.
Y2H interaction assays to test for binary interaction of wild type as well as mutant NAC044 with RBR1, LIN37B, and mEGFP as auto-activation control. AxAxA replaces the LxCxE motif in the mutant NAC044. AD, activating domain; BD, DNA-binding domain. Yeast cells were diluted as shown on top and spotted on different dropout media as indicated below. Growth on TDO and QDO indicates interaction.
Figure S6.
Figure S6.. The PRONAC044:mEGFP:NAC044 construct complements the DNA damage tolerance of nac044-1.
The PRONAC044:mEGFP:NAC044 genomic construct rescues the DNA damage tolerance phenotype of nac044-1. (A, B, C, D) Root length of Col-0, nac044-1, and PRONAC044:mEGFP:NAC044 (in nac044-1 background) after 6 d of growth on 0.05% vol/vol DMF (mock) plates (A, C) and on 15 μM cisplatin plates (B, D) are shown. (A, B) Quantification of three replicates à 7–10 roots; (C, D) representative whole-plant photographs. A box plot of the replicate means is shown. Significant differences were determined by ANOVA and Tukey post hoc test (P < 0.05).
Figure 6.
Figure 6.. Time course of NAC044, TCX5, LIN37A, and LIN37B protein expression after cisplatin treatment.
(A, B, C, D) Using genomic reporter lines to include the native regulatory sequences, expression of mEGFP-NAC044 (A), TCX5-EGFP (B), LIN37A-EGFP (C), and LIN37B-EGFP (D) was followed for 24 h after transfer of 6-d-old seedlings to 50 μM cisplatin-containing plates. Representative images of root tips at different time points, as indicated in the upper left corner of each panel, are shown here using the royal LUT in ImageJ. PI staining of the corresponding part of the root tip is shown as inset in the upper right corner of each panel. Scale bar = 30 μm. Microscopic settings were kept constant for each line, but not necessarily between lines.
Figure S7.
Figure S7.. Arabidopsis mutants isolated in this study.
Schematic representation of genes for which mutants were isolated or generated in this study. The T-DNA insertion sites of different mutant alleles are indicated as well as the location of primers used for expression analysis. The presence of full-length, N-terminal, and C-terminal transcripts in the different insertion lines was checked by RT-PCR using H2A10 as a control for the generated cDNA. (A) T-DNA insertion lines of ALY1, ALY2, and ALY3. (B) T-DNA insertion lines of LIN37A and LIN37B. (C) CRISPR line of LIN52A and T-DNA insertion line of LIN52B. The line lin52a-c1 was generated by CRISPR/Cas9-induced insertion of a single thymine after 471 bp in the genomic sequence counting from translational start in LIN52A leading to the amino acid changes indicated in red and resulting in a premature stop codon signified by an asterisk. (D) T-DNA insertion lines of TCX5 and TCX6. u: unspecific amplicon in the TCX6 N-terminal transcription assay as determined by sequencing. For the schematic representation of genes, light blue rectangles indicate exons, whereas black lines in between the rectangles show introns. Grey rectangles and pentagon arrows represent 5′ UTRs and 3′ UTRs, respectively. GeneRuler DNA ladder Mix, GeneRuler DNA ladder 1 kb+ and 1 kb were used as DNA ladders and labelled as Mix, 1 kb+, and 1 kb, respectively.
Figure S8.
Figure S8.. Root growth of DREAM component mutants on MMC.
(A, B, C, D) Root length of nac044-1 and different DREAM component single mutants (A, B, C) as well as aly double mutants (nac044-1 as control) (D) after 6 d of growth on control plates (blue) and on 3.3 μg/μl MMC plates (red) are shown as quantification of three replicates à 11–15 roots. A box plot of the replicate means is shown. (A, B, C, D) Significant differences were determined by ANOVA and Dunnett’s post hoc test (*P < 0.05) for single mutant assays (A, B, C) or Tukey post hoc test (P < 0.05) for double mutant assays (D).
Figure 7.
Figure 7.. Double mutants for LIN37A and LIN37B display less repression of root growth under DNA-damaging conditions than the wild type.
(A, B) Root growth of the wild type, lin37a, lin37b, and lin37a lin37b double mutants on control plates and in the presence of cisplatin (A: representative pictures; B: quantification). Plants grown for 5 d in the absence of cisplatin were transferred to medium containing 0 or 10 μM cisplatin, and grown for further 7 d. Data are presented as mean ± SD (n = 10). Significant differences as determined by two-way ANOVA and Tukey–Kramer post hoc test (P < 0.05) are indicated by differing letters over the bars.
Figure 8.
Figure 8.. An E2FB-containing DREAM complex is enriched under DNA damage conditions.
(A) Confocal analysis of seedling roots expressing pgE2FA-3xvYFP or pgE2FB-3xvYFP indicates an overall increase in E2FB-3xvYFP but not E2FA-3xvYFP fluorescence after 24 h treatment with 50 μM cisplatin. Scale bar = 50 μm. (B, C, D) Quantification by FP-IP. (B, C, D) 1 d of cisplatin treatment (50 μM) of 6-d-old E2F-GFP-expressing seedlings increases the quantity of DREAM components specifically in the protein complexes containing E2FB (B) but not E2FA (C) or E2FC (D). Interacting protein partners were immunopurified from the corresponding E2F-GFP translational lines by using anti-GFP-containing magnetic beads, and components were identified with mass spectrometry. Graphs show fold change calculated as a ratio of immunoprecipitated components after cisplatin treatment relative to untreated conditions. Values represent the mean of three biological replicates ± SE.
Figure 9.
Figure 9.. DNA damage-induced cell cycle arrest requires E2FB.
(A) Whole-plant photographs of Col-0, e2fb-1, and e2fb-2 treated with 0.05% vol/vol DMF (mock) or 15 μM cisplatin. Scale bar = 10 mm. (B) Primary root length Col-0, e2fb-1, and e2fb-2 seedlings after 6 d of 15 μM cisplatin or mock treatment. An average of 20 roots were measured for each genotype and condition. A box plot of the replicate means is shown. Significant differences were determined by ANOVA and Tukey post hoc test (P < 0.05). (C) Representative confocal images of EdU-labelled root tips of Col-0, e2fb-1, and e2fb-2 treated with 50 μM cisplatin or 0.16% vol/vol DMF (mock) for 3 h. Scale bar = 50 μm. (D) Percentage of EdU-positive S phase cells relative to DAPI-stained nuclei in the root meristems of Col-0, e2fb-1, and e2fb-2 treated with 50 μM cisplatin or 0.16% DMF (mock) for 3 h. An average of 25 roots were imaged for each genotype and condition. A box plot of the replicate means is shown, outlier values are shown as circles. Significant differences were determined by ANOVA and Tukey post hoc test (P < 0.05).
Figure S9.
Figure S9.. Analysis of root growth and mitotic features in e2fb mutants upon cisplatin treatment.
(A) Time course of primary root growth of Col-0, e2fb-1, and e2fb-2 after transfer to 15 μM cisplatin presented as a percentage of mock-treated root growth. Significant differences were determined by ANOVA and Dunnett’s post hoc test (*P < 0.05; **P < 0.01). ns, not significant. (B) Number of mitotic cells relative to DAPI-stained nuclei in the root meristems of Col-0, e2fb-1, and e2fb-2 treated with 50 μM cisplatin or 0.16% DMF (mock) for 3 h. An average of 25 roots were imaged for each genotype and condition, data used here is from EdU-labelled roots. A box plot of the observed mitotic cell counts is shown, outlier values are shown as circles. No significant differences were detected by ANOVA testing (P < 0.05). (C) Confocal images of DAPI-stained Col-0, e2fb-1, and e2fb-2 root tips. Mitotic features are indicated by red arrows. Scale bar = 50 μm.
Figure S10.
Figure S10.. Analysis of cell death in e2fb mutants upon cisplatin treatment.
(A) Representative confocal images of PI-stained root tips of Col-0, e2fb-1, and e2fb-2 treated with 50 μM cisplatin or 0.16% vol/vol DMF (mock) for 24 h. Scale bar = 50 μm. (B) Quantification of the areas of dead (PI-positive) columella and lateral root cap stem cells and their daughter cells in Col-0, e2fb-1, and e2fb-2 treated with 50 μM cisplatin. An average of 18 roots were imaged for each genotype and condition. A box plot of the observed dead cell areas is shown. Significant differences were determined by ANOVA and Dunnett’s post hoc test (**P < 0.01). (C) Quantification of the areas of dead (PI-positive) cells in the vasculature of Col-0, e2fb-1, and e2fb-2 treated with 50 μM cisplatin. An average of 18 roots were imaged for each genotype and condition. A box plot of the observed dead cell areas is shown, outlier values are shown as circles. No significant differences were detected by ANOVA testing (P < 0.05).

References

    1. Alonso JM, Stepanova AN, Leisse TJ, Kim CJ, Chen H, Shinn P, Stevenson DK, Zimmerman J, Barajas P, Cheuk R, et al. (2003) Genome-wide insertional mutagenesis of Arabidopsis thaliana. Science 301: 653–657. 10.1126/science.1086391 - DOI - PubMed
    1. Andersen SU, Algreen-Petersen RG, Hoedl M, Jurkiewicz A, Cvitanich C, Braunschweig U, Schauser L, Oh SA, Twell D, Jensen EØ (2007) The conserved cysteine-rich domain of a tesmin/TSO1-like protein binds zinc in vitro and TSO1 is required for both male and female fertility in Arabidopsis thaliana. J Exp Bot 58: 3657–3670. 10.1093/jxb/erm215 - DOI - PubMed
    1. Bauer DC, Buske FA, Bailey TL (2010) Dual-functioning transcription factors in the developmental gene network of Drosophila melanogaster. BMC Bioinformatics 11: 366. 10.1186/1471-2105-11-366 - DOI - PMC - PubMed
    1. Biedermann S, Harashima H, Chen P, Heese M, Bouyer D, Sofroni K, Schnittger A (2017) The retinoblastoma homolog RBR1 mediates localization of the repair protein RAD51 to DNA lesions in Arabidopsis. EMBO J 36: 1279–1297. 10.15252/embj.201694571 - DOI - PMC - PubMed
    1. Boruc J, Mylle E, Duda M, De Clercq R, Rombauts S, Geelen D, Hilson P, Inzé D, Van Damme D, Russinova E (2010) Systematic localization of the Arabidopsis core cell cycle proteins reveals novel cell division complexes. Plant Physiol 152: 553–565. 10.1104/pp.109.148643 - DOI - PMC - PubMed

Publication types

MeSH terms

LinkOut - more resources