Comparative Study
. 2021 Oct 5;118(40):e2104684118.
doi: 10.1073/pnas.2104684118.

Inequality in mortality between Black and White Americans by age, place, and cause and in comparison to Europe, 1990 to 2018

Affiliations
Comparative Study

Inequality in mortality between Black and White Americans by age, place, and cause and in comparison to Europe, 1990 to 2018

Hannes Schwandt et al. Proc Natl Acad Sci U S A. .

Abstract

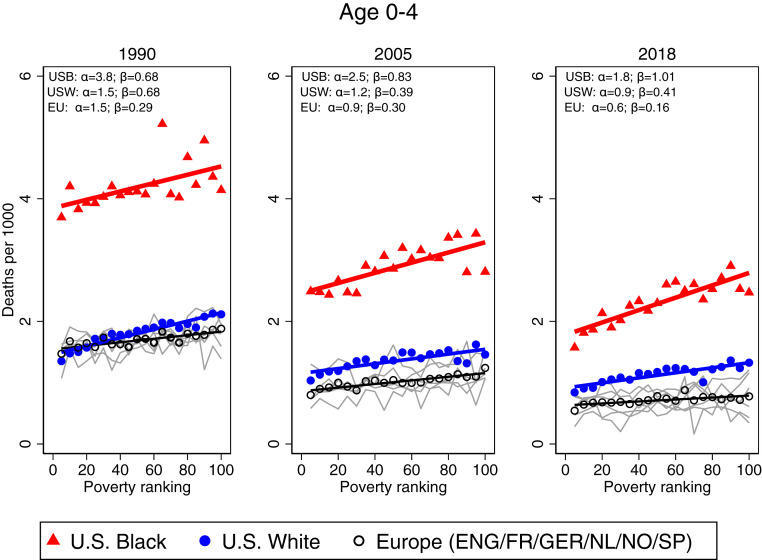
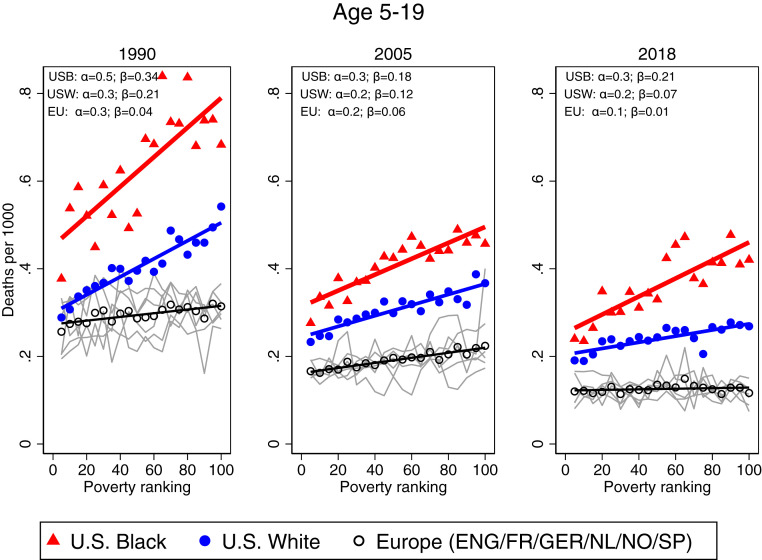
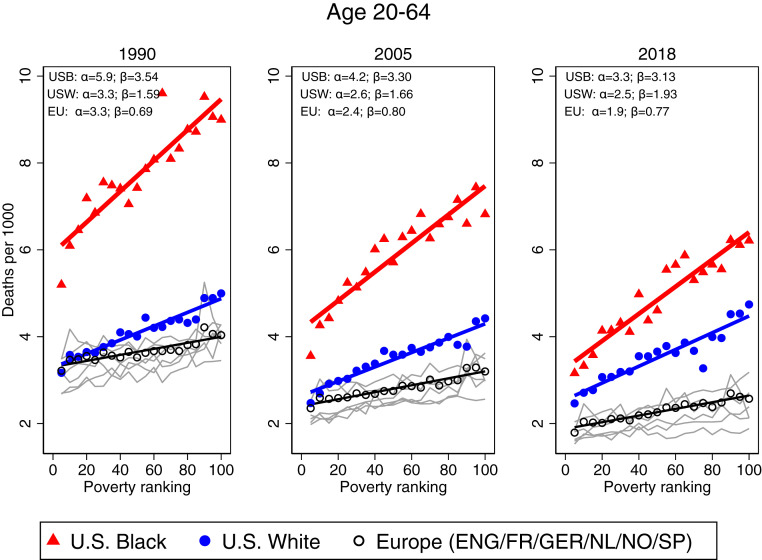
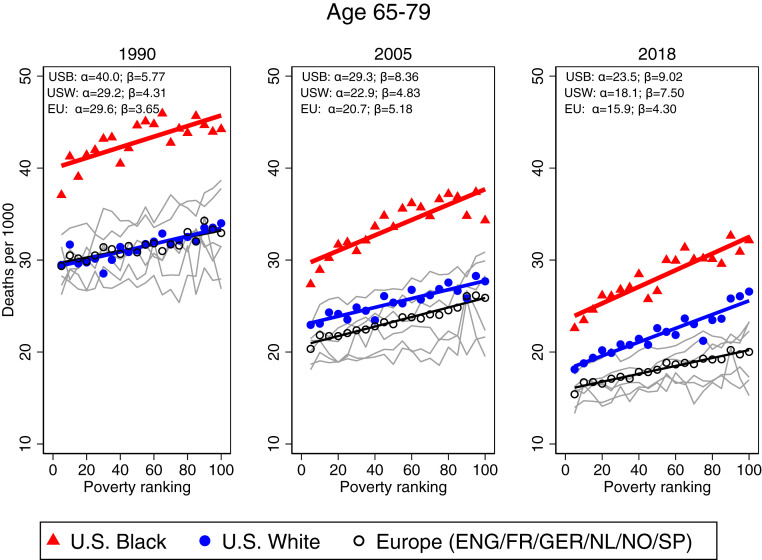
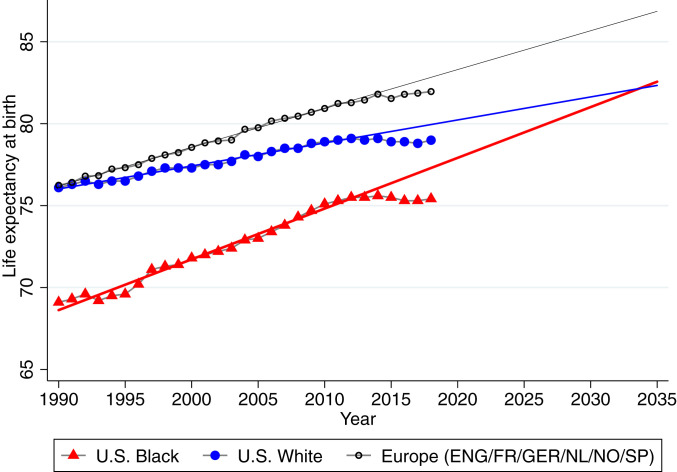
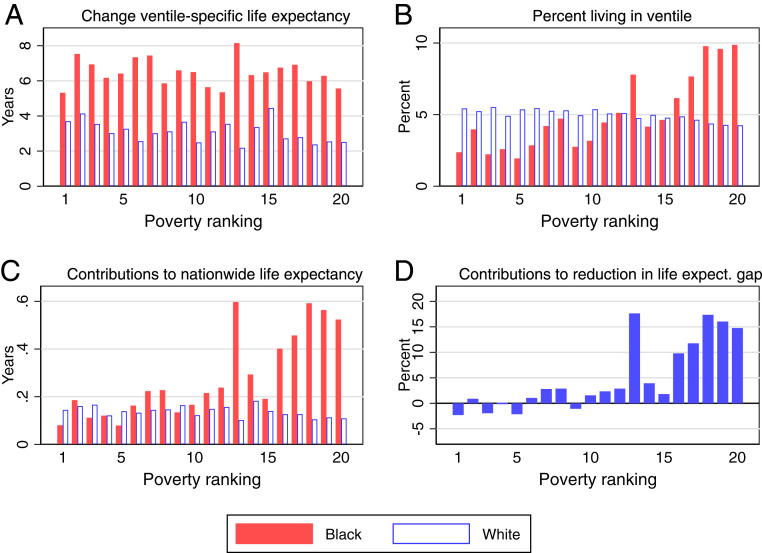
Although there is a large gap between Black and White American life expectancies, the gap fell 48.9% between 1990 and 2018, mainly due to mortality declines among Black Americans. We examine age-specific mortality trends and racial gaps in life expectancy in high- and low-income US areas and with reference to six European countries. Inequalities in life expectancy are starker in the United States than in Europe. In 1990, White Americans and Europeans in high-income areas had similar overall life expectancy, while life expectancy for White Americans in low-income areas was lower. However, since then, even high-income White Americans have lost ground relative to Europeans. Meanwhile, the gap in life expectancy between Black Americans and Europeans decreased by 8.3%. Black American life expectancy increased more than White American life expectancy in all US areas, but improvements in lower-income areas had the greatest impact on the racial life expectancy gap. The causes that contributed the most to Black Americans' mortality reductions included cancer, homicide, HIV, and causes originating in the fetal or infant period. Life expectancy for both Black and White Americans plateaued or slightly declined after 2012, but this stalling was most evident among Black Americans even prior to the COVID-19 pandemic. If improvements had continued at the 1990 to 2012 rate, the racial gap in life expectancy would have closed by 2036. European life expectancy also stalled after 2014. Still, the comparison with Europe suggests that mortality rates of both Black and White Americans could fall much further across all ages and in both high-income and low-income areas.

Keywords: age-specific mortality; area-level socioeconomic status; international comparison; life expectancy; racial divide.


Conflict of interest statement

The authors declare no competing interest.

Figures

Fig. 1.
Fig. 1.
One-year mortality for Black Americans, White Americans, and six European countries, ages 0 to 4, for (Left) 1990, (Middle) 2005, and (Right) 2018. Average 1-y mortality rates are plotted across poverty rate percentiles. For US Black (USB) and US White (USW) mortality, each bin represents a group of counties with about 5% of the overall population in the respective year. Black circles show population-weighted average mortality rates across England (ENG), France (FR), Germany (GER), the Netherlands (NL), Norway (NO), and Spain (SP), and each circle represents a group of municipalities or districts representing 5% of the overall population of each country in the respective year. Gray lines show mortality for each European country (see SI Appendix, Figs. S5–S9 for colorized figures with an extended set of European countries). Germany and Spain are included with 2016 data in Right. Straight lines provide linear fits. α and β refer to the fitted lines’ intercepts and slopes, respectively. Additional numerical values are reported in SI Appendix, Table S1.
Fig. 2.
Fig. 2.
One-year mortality for Black Americans, White Americans, and six European countries, ages 5 to 19, for (Left) 1990, (Middle) 2005, and (Right) 2018. Straight lines provide linear fits. α and β refer to the fitted lines’ intercepts and slopes, respectively. For further notes, see Fig. 1. Numerical values and the slopes of fitted lines are reported in SI Appendix, Table S2.
Fig. 3.
Fig. 3.
One-year mortality for Black Americans, White Americans, and six European countries, ages 20 to 64, for (Left) 1990, (Middle) 2005, and (Right) 2018. Straight lines provide linear fits. α and β refer to the fitted lines’ intercepts and slopes, respectively. For further notes, see Fig. 1. Numerical values and the slopes of fitted lines are reported in SI Appendix, Table S3.
Fig. 4.
Fig. 4.
One-year mortality for Black Americans, White Americans, and six European countries, ages 65 to 79, for (Left) 1990, (Middle) 2005, and (Right) 2018. Straight lines provide linear fits. α and β refer to the fitted lines’ intercepts and slopes, respectively. For further notes, see Fig. 1. Numerical values and the slopes of fitted lines are reported in SI Appendix, Table S4.
Fig. 5.
Fig. 5.
Life expectancy for Black Americans, White Americans, and six European countries, extrapolated to 2035 fitting a linear trend through 1990 to 2012. Black American, White American, and European life expectancies are plotted over time and extrapolated to 2035 using a linear trend through 1990 to 2012. Black circles show the population weighted average life expectancy across England, France, Germany, the Netherlands, Norway, and Spain.
Fig. 6.
Fig. 6.
Population distribution in 1990 and life expectancy contribution for 1990 to 2018, by ventile and race. (A) The change in race-specific life expectancy calculated within each ventile between 1990 and 2018. (B) The percent of the overall US Black and White population living in each ventile in 1990. (C) The contribution of the mortality changes in each ventile to the countrywide race-specific life expectancy. (D) The percent contribution of the mortality changes in each ventile to the reduction in the life expectancy gap between Black and White Americans.

References

    1. Murray C. J. L., et al., Eight Americas: Investigating mortality disparities across races, counties, and race-counties in the United States. PLoS Med. 3, e260 (2006). - PMC - PubMed
    1. Shiels M. S., et al., Trends in premature mortality in the USA by sex, race, and ethnicity from 1999 to 2014: An analysis of death certificate data. Lancet 389, 1043–1054 (2017). - PMC - PubMed
    1. Harper S., Lynch J., Burris S., Davey Smith G., Trends in the black-white life expectancy gap in the United States, 1983–2003. JAMA 297, 1224–1232 (2007). - PubMed
    1. Adler N. E., Rehkopf D. H., U.S. disparities in health: Descriptions, causes, and mechanisms. Annu. Rev. Public Health 29, 235–252 (2008). - PubMed
    1. Harper S., Rushani D., Kaufman J. S., Trends in the black-white life expectancy gap, 2003-2008. JAMA 307, 2257–2259 (2012). - PubMed

Publication types

LinkOut - more resources