. 2021 Sep 28;12(1):5677.
doi: 10.1038/s41467-021-25815-w.

Probabilistic tsunami forecasting for early warning

Affiliations

Probabilistic tsunami forecasting for early warning

J Selva et al. Nat Commun. .

Abstract

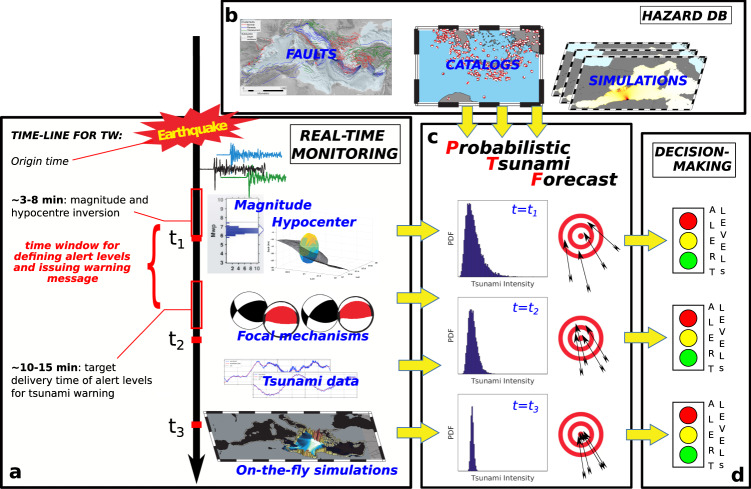
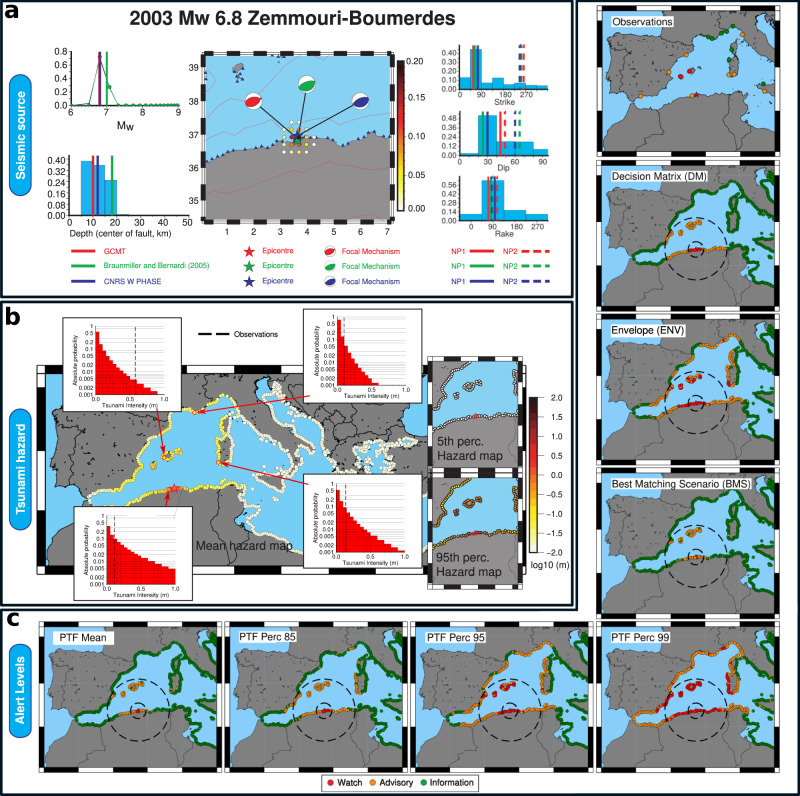
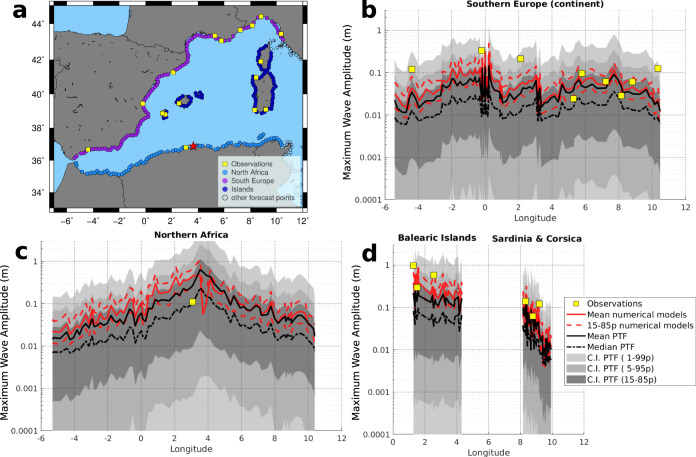
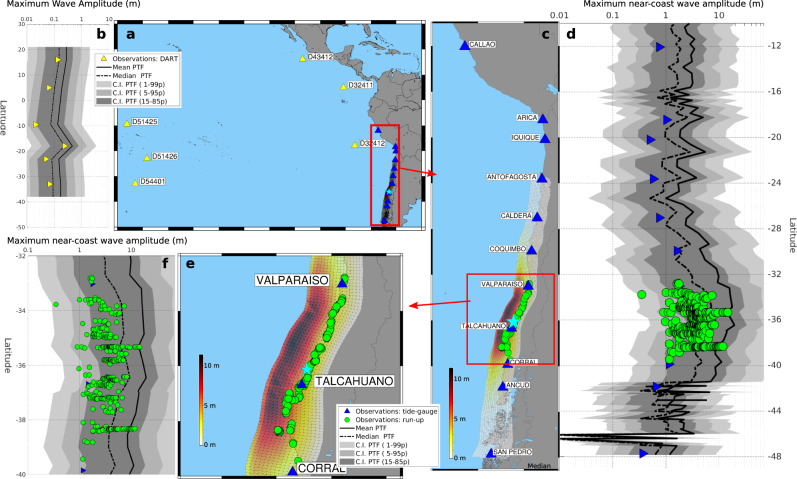
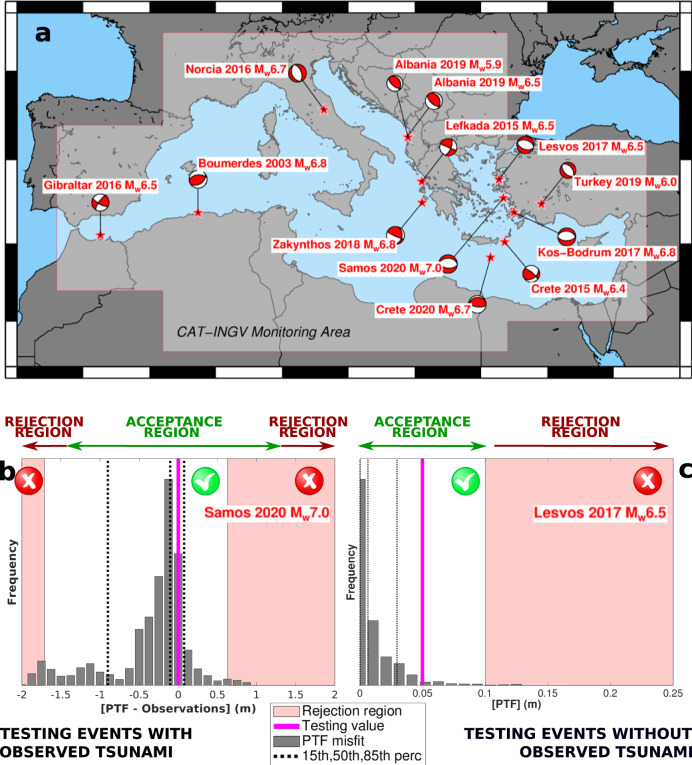
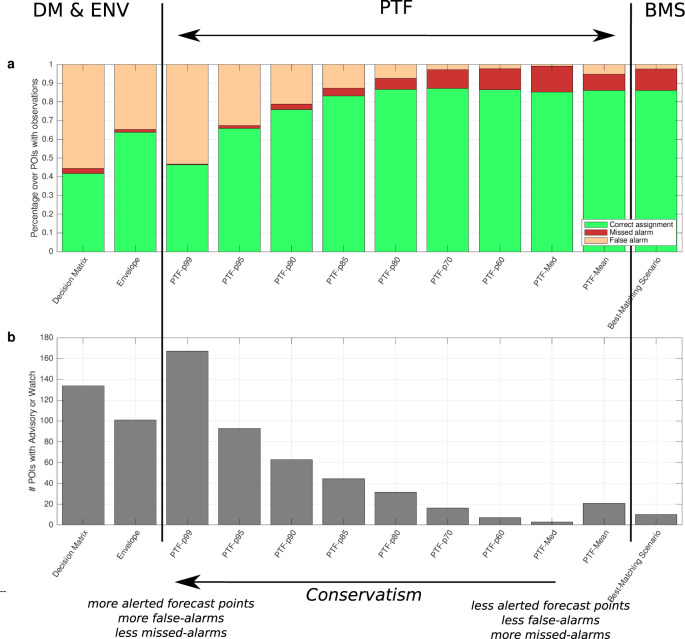
Tsunami warning centres face the challenging task of rapidly forecasting tsunami threat immediately after an earthquake, when there is high uncertainty due to data deficiency. Here we introduce Probabilistic Tsunami Forecasting (PTF) for tsunami early warning. PTF explicitly treats data- and forecast-uncertainties, enabling alert level definitions according to any predefined level of conservatism, which is connected to the average balance of missed-vs-false-alarms. Impact forecasts and resulting recommendations become progressively less uncertain as new data become available. Here we report an implementation for near-source early warning and test it systematically by hindcasting the great 2010 M8.8 Maule (Chile) and the well-studied 2003 M6.8 Zemmouri-Boumerdes (Algeria) tsunamis, as well as all the Mediterranean earthquakes that triggered alert messages at the Italian Tsunami Warning Centre since its inception in 2015, demonstrating forecasting accuracy over a wide range of magnitudes and earthquake types.


Conflict of interest statement

The authors declare no competing interests.

Figures

Fig. 1
Fig. 1. PTF concept.
a Timeline for tsunami warning: real-time information from an earthquake that just occurred and from the ongoing tsunami gradually integrates b local long-term hazard information, c progressively increasing the precision of the probabilistic forecasts (hazard curves) produced by the Probabilistic Tsunami Forecasting (PTF). d At any time, PTF can be transformed into alert levels (here represented as traffic lights) useful for decision making. In the current study, implementation refers to the time t1, when only earthquake magnitude and hypocentre estimates are available from real-time observations.
Fig. 2
Fig. 2. PTF workflow: example for the 2003 Zemmouri-Boumerdes tsunami.
a PTF source model: marginal distributions for earthquake magnitude and depth (left), location (centre), and fault parameters (right) for the ensemble describing source variability. Several revised moment tensor solutions are plotted as vertical lines for comparison. Distributions are consistent with seismic observations. For example, the ~30° southern-dipping realistic fault plane is strongly emphasized in the PTF source ensemble. b PTF results: tsunami intensity measure distribution (hazard curve) at four selected coastal locations in the western Mediterranean compared with observations (dashed vertical lines), and hazard maps involving all forecast points derived from different PTF’s statistics (mean, 5–95th percentiles), showing uncertainty and spatial pattern of the tsunami forecast. c NEAMTWS Alert levels assigned from observations, decision matrix (DM), best-matching-scenario (BMS), envelope (ENV), and PTF mean, and 85, 95, and 99th percentiles; dashed lines indicate local and regional areas, as defined in the DM (Supplementary Table 8). NEAMTWS considers three alert levels (Information, Advisory, and Watch), each corresponding to off-coast tsunami wave amplitudes intervals: alert levels are assigned comparing tsunami near-coast wave amplitude with alert-level intervals.
Fig. 3
Fig. 3. PTF for the 2003 Zemmouri-Boumerdes tsunami.
a selection of forecast points for specific comparison and b–d graphical comparison between tsunami observations (yellow squares) and maximum wave amplitudes evaluated from numerical models (red lines: mean and 15–85 percentiles with solid and dashed lines, respectively), and PTF statistics (black lines: mean and percentiles with solid and dashed lines, respectively) at all forecast points in b northwest Africa, c southwest Europe, and d the main islands.
Fig. 4
Fig. 4. PTF for the 2010 M8.8 Maule tsunami.
a Epicentre and location of deep-sea (DART) observations (yellow triangles) and b corresponding comparison between deep-sea observations and PTF forecasts (black lines and grey areas). c Epicentre (star), average of the slip distributions used in the ensemble, and location of coastal observations (tide-gauges and run-up as blue triangles and green circles, respectively; run-up is halved to compare with wave amplitude, see Supplementary Note 6). d Graphical comparison between coastal observations and PTF forecasts (black lines and grey areas). e, f Same as b, c zoomed over the area with run-up measures.
Fig. 5
Fig. 5. Testing PTF.
a Testing dataset and monitoring area of CAT-INGV; additional details are reported in Supplementary Table 2. b Example of test for events with observed tsunami: the case of 2020 Mw 7.0 Samos-Izmir earthquake. PTF misfit distribution ([PTF-Observations]) is evaluated as the difference between near-coast wave amplitudes sampled from the PTF source ensemble and observations and staked for all observation points (see Methods). Gray bars report the misfit distribution, along with its 15, 50, and 85 percentiles (dashed lines). The model is rejected if the testing value (null misfit, purple line) falls in the rejection area (light red area); otherwise, the test is passed. c Example of test for events without observed tsunami: the case of 2017 Mw 6.5 Lesbos earthquake. The PTF distribution ([PTF]), obtained sampling from the PTF source ensemble, is expected to encompass small values. The model is rejected if the testing value (the 95th percentile of [PTF], purple line) falls in the rejection area (light red area: near-coast wave amplitude < 0.1 m); otherwise, the test is passed. To keep spatial correlations, in both [PTF-Observations] and [PTF] the uncertainty in propagation is averaged (see Methods). All the other case studies are reported in Supplementary Figs. 4 and 5.
Fig. 6
Fig. 6. Alert levels from PTF and non-probabilistic methods.
We compare the assigned and observed alert levels based on DM, ENV, BMS, and PTF statistics for the 13 events in the testing dataset considered in this paper (Fig. 5a). a Average percentage of correct- (green), false- (yellow) and missed alarms (red) at forecast points with observations. b Average total number of forecast points with advisory and watch levels at all forecast points. Note that CAT-INGV DM is less conservative than the original NEAMTWS DM. The different PTF statistics allow covering the full range of conservative choices, encompassing the range defined by existing non-probabilistic methods. The selection of a specific PTF percentile can be explicitly linked to a pre-defined level of conservatism, quantifying the expected rate of false/missed alarms.

References

    1. Satake K, Fujii Y, Harada T, Namegaya Y. Time and space distribution of Coseismic Slip of the 2011 Tohoku earthquake as inferred from tsunami waveform data. Bull. Seismol. Soc. Am. 2013;103:1473–1492. doi: 10.1785/0120120122. - DOI
    1. Palmer TN, et al. Representing model uncertainty in weather and climate prediction. Annu. Rev. Earth Planet. Sci. 2005;33:163–193. doi: 10.1146/annurev.earth.33.092203.122552. - DOI
    1. Leutbecher M, Palmer TN. Ensemble forecasting. J. Comput. Phys. 2008;227:3515–3539. doi: 10.1016/j.jcp.2007.02.014. - DOI
    1. Bernard E, Titov V. Evolution of tsunami warning systems and products. Philos. Trans. A Math. Phys. Eng. Sci. 2015;373:20140371. - PMC - PubMed
    1. Kanamori H, Rivera L. Source inversion of W phase: speeding up seismic tsunami warning. Geophys. J. Int. 2008;175:222–238. doi: 10.1111/j.1365-246X.2008.03887.x. - DOI

Publication types