. 2021 Sep 28;12(1):5674.
doi: 10.1038/s41467-021-25965-x.

Gut bacteria identified in colorectal cancer patients promote tumourigenesis via butyrate secretion

Affiliations

Gut bacteria identified in colorectal cancer patients promote tumourigenesis via butyrate secretion

Shintaro Okumura et al. Nat Commun. .

Abstract

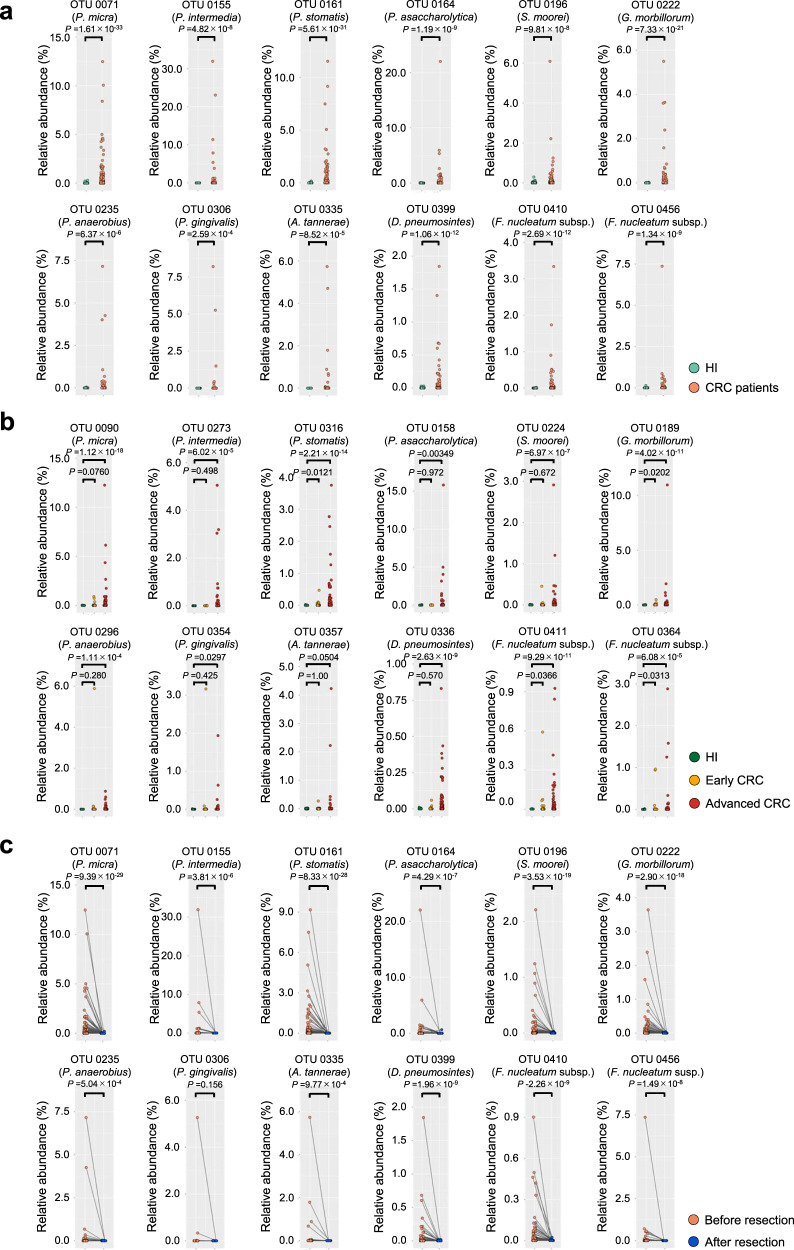
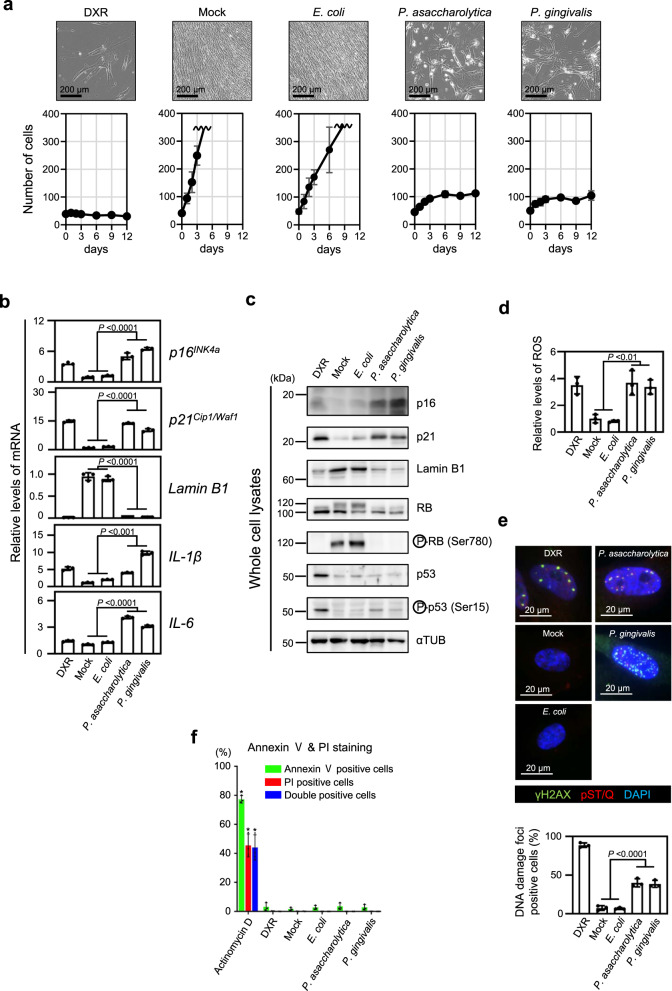
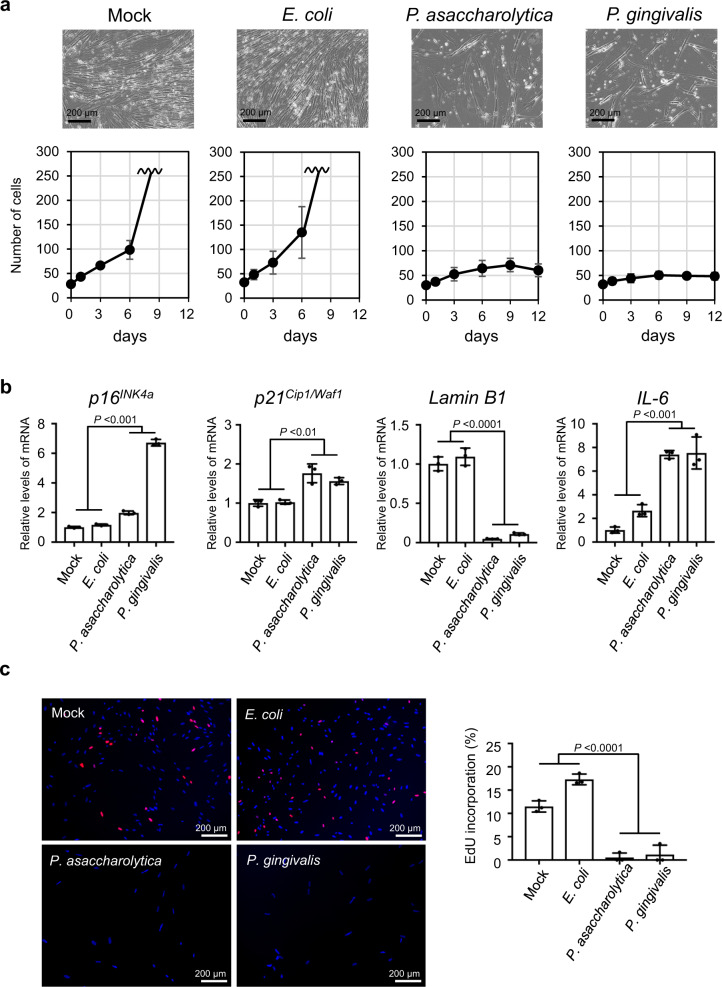
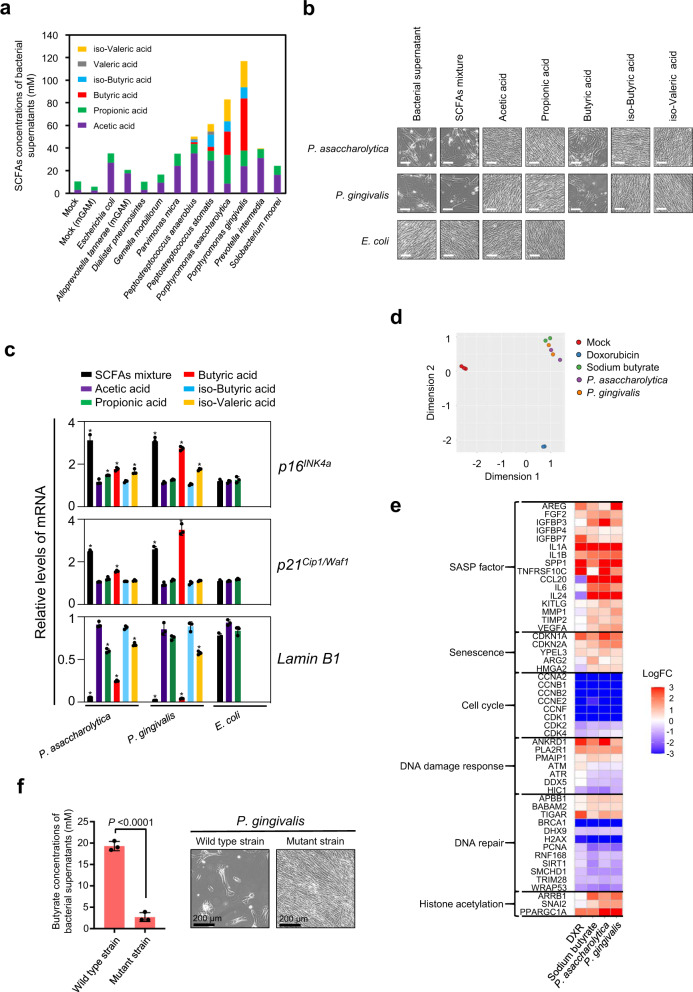
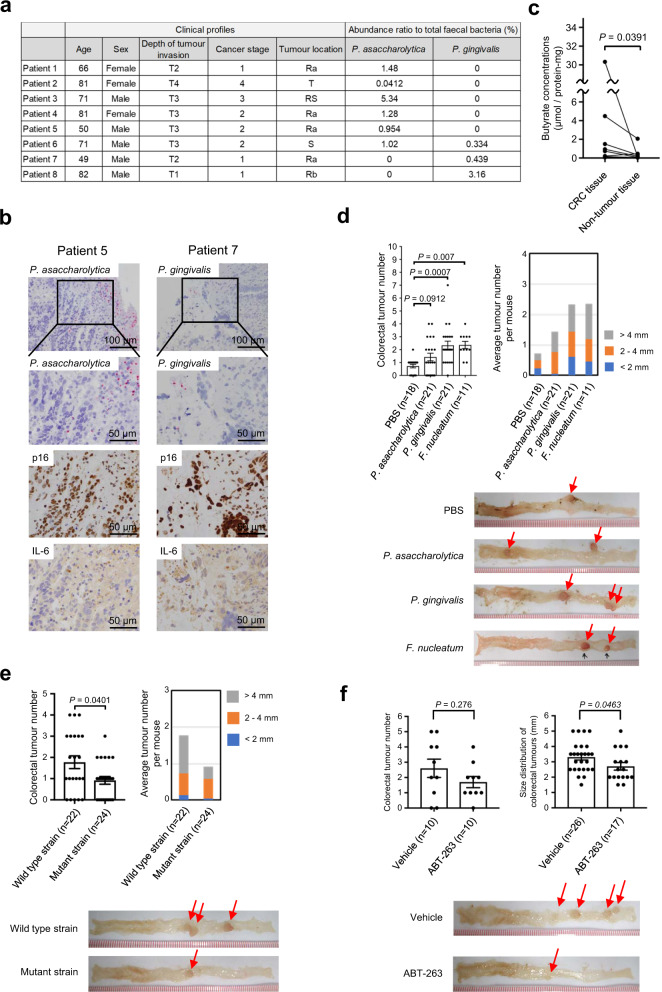
Emerging evidence is revealing that alterations in gut microbiota are associated with colorectal cancer (CRC). However, very little is currently known about whether and how gut microbiota alterations are causally associated with CRC development. Here we show that 12 faecal bacterial taxa are enriched in CRC patients in two independent cohort studies. Among them, 2 Porphyromonas species are capable of inducing cellular senescence, an oncogenic stress response, through the secretion of the bacterial metabolite, butyrate. Notably, the invasion of these bacteria is observed in the CRC tissues, coinciding with the elevation of butyrate levels and signs of senescence-associated inflammatory phenotypes. Moreover, although the administration of these bacteria into ApcΔ14/+ mice accelerate the onset of colorectal tumours, this is not the case when bacterial butyrate-synthesis genes are disrupted. These results suggest a causal relationship between Porphyromonas species overgrowth and colorectal tumourigenesis which may be due to butyrate-induced senescence.


Conflict of interest statement

The authors declare no competing interests.

Figures

Fig. 1
Fig. 1. Gut bacteria enriched in CRC patients.
a Scatter plots showing the abundance (%) of indicated bacterial OTUs enriched in colorectal cancer (CRC) patients of Cohort-1 as determined by 16S rRNA gene-sequencing analysis. The green and red dots represent healthy individuals (HI) or CRC patients, respectively. The name of bacterial species most likely to correspond to each OTU is shown. Statistical significance was determined with a two-tailed Wilcoxon rank-sum test. b Scatter plots showing the abundance (%) of indicated bacterial OTUs enriched in CRC patients of Cohort-2 as determined by 16S rRNA gene-sequencing analysis. Green, yellow and red dots represent healthy individuals (HI) or early CRC patients, or advanced CRC patients, respectively. Statistical significance was determined with a Kruskal–Wallis rank-sum test followed by two-tailed pairwise Wilcoxon rank-sum tests. c Scatter plots showing the abundances (%) of the indicated OTUs in total gut bacteria of CRC patients of Cohort-1 before (red dots) and after (blue dots) surgical resection of primary tumours. Statistical significance was determined with a two-tailed Wilcoxon signed-rank test. P values < 0.05 were considered significant. Source data are provided as a Source Data file.
Fig. 2
Fig. 2. Induction of cellular senescence in fibroblasts by gut bacteria.
ae, Early passage TIG-3 cells were cultured with tissue culture media containing the indicated bacterial conditioned media or the plain bacterial culture media with (DXR) or without (Mock) doxorubicin at a ratio of 1/30 for 9 days, and then subsequently cultured with plain tissue culture medium for another 3 days. Cell numbers were counted throughout the experiments, and representative photographs of the cells in the indicated culture conditions on day 12 are shown at the top of the panels. These assays were performed in triplicate (both biological and technical replicates) and representative data were shown (a). Cells on day 9 were subjected to RT-qPCR analysis for indicated genes (b), western blotting analysis using antibodies shown right (c), analysis of intracellular ROS levels (d) or to immunofluorescence staining for markers of DNA damage (γ-H2AX (green) and pST/Q (red)) and DNA staining with 4′, 6-diamidino-2-phenylindole (DAPI) (blue) (e). The histograms indicate the percentage of nuclei that contain more than 3 foci positive for both γ-H2AX and pST/Q staining (e). The assay was performed three times and representative data is shown (c). f TIG-3 cells were cultured with or without (Mock) the indicated bacterial culture supernatants for 9 days, and then subjected to annexin V and Propidium iodide (PI) staining analyses. Actinomycin D treated cells were used as a positive control for apoptotic cells, and doxorubicin (DXR) treated cells were used as a positive control for senescent cells. The histogram shows the percentage of cells that were positive for Annexin V (green bar), PI (red bar) or both (blue bar), respectively. Double positive cells represent apoptotic cells. For all bar graphs, error bars indicate mean ± standard deviation (s.d.) with three biologically independent replicates. Statistical significance was determined with one-way ANOVA followed by Tukey’s test (b), (d), (e) or two-tailed Dunnett’s test for comparing with mock (f). P values < 0.05 were considered significant. Source data are provided as a Source Data file.
Fig. 3
Fig. 3. Induction of cellular senescence in intestinal epithelial cells by gut bacteria.
a, b Early passage normal human colonic epithelial cells (CCD 841 CoN) were cultured with tissue culture media containing the indicated bacterial conditioned media or the plain bacterial culture media (Mock) at a ratio of 1/30 for 9 days, changing the medium every 3 days, and then subsequently cultured with plain tissue culture medium for another 3 days. Cell numbers were counted throughout the experiments, and representative photographs of the cells in the indicated culture conditions on day 12 are shown at the top of the panels. These assays were performed in triplicate (both biological and technical replicates) and representative data were shown (a). Cells on day 9 were subjected to RT-qPCR analysis for indicated genes (b). c Early passage normal human colonic epithelial cells (CCD 841 CoN) were cultured with tissue culture media containing the indicated bacterial conditioned media or the plain bacterial culture media (Mock) at a ratio of 1/30 for 9 days, changing the medium every 3 days, and then subsequently cultured with plain tissue culture medium for another 7 days. These cells were then subjected to EdU incorporation analysis. EdU (red) and DNA staining with 4′, 6-diamidino-2-phenylindole (DAPI) (blue) were shown. Representative photographs of the cells in the indicated culture conditions are shown. The histograms indicate the percentages of cells that were positive for EdU. These assays were performed in triplicate (both biological and technical replicates) and representative data were shown (b, c). For all graphs, error bars indicate mean ± s.d. with three biologically independent replicates. Statistical significance was determined with one-way ANOVA followed by Tukey’s test. P values < 0.05 were considered significant (b, c). Source data are provided as a Source Data file.
Fig. 4
Fig. 4. Butyrate provokes cellular senescence in HDFs.
a The concentrations of SCFAs present in indicated bacterial conditioned media or plain bacterial culture media of GAM (Mock) or modified GAM (Mock-mGAM) were shown. be Early passage TIG-3 cells were cultured for 9 days with tissue culture media containing indicated bacterial conditioned media at the ratio of 1/30 or indicated each SCFA or the mixture of these SCFAs in the same concentrations present in the bacterial conditioned media for 9 days. Representative photographs of the cells in the indicated culture conditions are shown. Scale bars represent 100 μm (b). Cells were then subjected to RT-qPCR analysis for indicated genes (one-way ANOVA followed by two-tailed Dunnett’s test for comparing with SCFAs mixture of E. coli. P values < 0.05 were considered significant) (c), or subjected to RNA sequencing analysis (d, e). Multi-dimensional scaling (MDS) plots based on the differential gene expression analysis were shown (d). Heatmap represents the ratio of gene expression between indicated cells and Mock-treated cells. The colours in the heatmap represent log fold-change (LogFC) relative to mock, with blue indicating three-fold lower expression and red three-fold higher expression (e). Three biological replicates of Mock and two biological replicates of the other conditions were analysed (d, e). The concentrations of doxorubicin (DXR) and Sodium butyrate used were 200 ng/ml or 3 mM, respectively. f Measurements of butyrate concentrations in the indicated bacterial conditioned media (left). Wild-type strain represents P. gingivalis (ATCC 33277) and Mutant strain represents its butyrate synthesis defective mutant (PGAGU 118). Error bars indicate mean ± s.d. with three biologically independent replicates. Statistical significance was determined with a two-tailed Student’s t-test. P value < 0.05 was considered significant. Early passage TIG-3 cells were cultured with tissue culture media containing indicated bacterial conditioned media at the ratio of 1/30 for 9 days and representative photographs of the cells cultured with indicated bacterial conditioned media are shown (right). Source data are provided as a Source Data file.
Fig. 5
Fig. 5. Bacterial invasion and tumour promotion.
a Clinical information on surgically resected CRC tissues and relative abundances of OTUs corresponding to the two bacterial species (P. asaccharolytica and P. gingivalis) in the faeces of the patients analysed. b Paraffin-embedded CRC tissues were subjected to the in situ hybridization using probes specific to P. asaccharolytica, or P. gingivalis, or to the immuno-staining analysis using indicated antibodies. These assays were performed in three biologically independent replicates to show representative data. c Butyrate concentrations in CRC tissues and paired non-tumour tissues of eight patients. Statistical significance was determined with a two-tailed Wilcoxon signed-rank test. P value < 0.05 was considered significant. d Colorectal tumour numbers in ApcΔ14/+ mice gavaged with PBS (n = 18), P. asaccharolytica (n = 21), P. gingivalis (n = 21) or F. nucleatum subspecies nucleatum (referred to as F. nucleatum) (n = 11) (left) and the average colorectal tumour numbers with the size distribution per mouse (right). Error bars indicate mean ± standard error of measurement (s.e.m.). Representative macroscopic photographs of the colorectal tumours are shown (bottom). Statistical significance was determined with a Kruskal–Wallis rank-sum test followed by two-tailed pairwise Wilcoxon rank-sum tests. P values < 0.05 were considered significant. F. nucleatum was used here as a positive control and PBS was used here as a negative control. e Colorectal tumour numbers in ApcΔ14/+ mice gavaged with P. gingivalis wild-type strain (ATCC 33277) (n = 22) or its butyrate synthesis defective mutant strain (PGAGU 118) (n = 24) (upper left) and the average colorectal tumour numbers with the size distribution per mouse (upper right) are shown. Representative macroscopic photographs of the colorectal tumours are shown (bottom). Statistical significance was determined with a two-tailed Wilcoxon rank-sum test. Error bars indicate mean ± s.e.m. P value < 0.05 was considered significant. f Colorectal tumour numbers in ApcΔ14/+ mice gavaged with P. gingivalis wild-type strain with (n = 10) or without (n = 10) ABT-263 (upper left) and the size distribution of colorectal tumours of indicated mouse are shown (upper right). Representative macroscopic photographs of the colorectal tumours are shown (bottom). Statistical significance was determined with a two-tailed Wilcoxon rank-sum test. Error bars indicate mean ± s.e.m. P value < 0.05 was considered significant. Source data are provided as a Source Data file.

References

    1. Ferlay J, et al. Estimating the global cancer incidence and mortality in 2018: GLOBOCAN sources and methods. Int. J. Cancer. 2019;144:1941–1953. doi: 10.1002/ijc.31937. - DOI - PubMed
    1. Yoshimoto S, et al. Obesity-induced gut microbial metabolite promotes liver cancer through senescence secretome. Nature. 2013;499:97–101. doi: 10.1038/nature12347. - DOI - PubMed
    1. Schwabe RF, Jobin C. The microbiome and cancer. Nat. Rev. Cancer. 2013;13:800–812. doi: 10.1038/nrc3610. - DOI - PMC - PubMed
    1. Schroeder BO, Backhed F. Signals from the gut microbiota to distant organs in physiology and disease. Nat. Med. 2016;22:1079–1089. doi: 10.1038/nm.4185. - DOI - PubMed
    1. Janney A, Powrie F, Mann EH. Host-microbiota maladaptation in colorectal cancer. Nature. 2020;585:509–517. doi: 10.1038/s41586-020-2729-3. - DOI - PubMed

Publication types

MeSH terms