. 2021 Sep 14;2(3):100508.
doi: 10.1016/j.xpro.2021.100508. eCollection 2021 Sep 17.

Protocols for endothelial cell isolation from mouse tissues: brain, choroid, lung, and muscle

Affiliations

Protocols for endothelial cell isolation from mouse tissues: brain, choroid, lung, and muscle

Nadine V Conchinha et al. STAR Protoc. .

Abstract

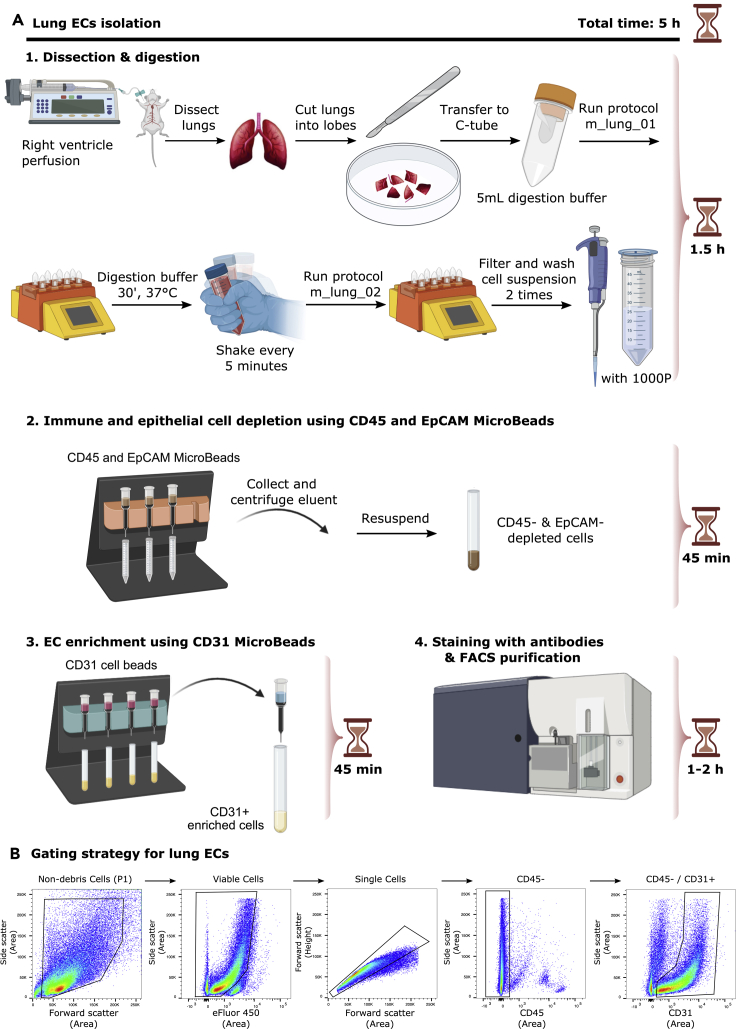
Endothelial cells (ECs) harbor distinct phenotypical and functional characteristics depending on their tissue localization and contribute to brain, eye, lung, and muscle diseases such as dementia, macular degeneration, pulmonary hypertension, and sarcopenia. To study their function, isolation of pure ECs in high quantities is crucial. Here, we describe protocols for rapid and reproducible blood vessel EC purification established for scRNA sequencing from murine tissues using mechanical and enzymatic digestion followed by magnetic and fluorescence-activated cell sorting. For complete details on the use and execution of these protocol, please refer to Kalucka et al. (2020), Rohlenova et al. (2020), and Goveia et al. (2020).

Keywords: Cell isolation; Flow Cytometry/Mass Cytometry; Single Cell.


Conflict of interest statement

The authors declare no competing interests.

Figures

None
Graphical abstract
Figure 1
Figure 1
EC isolation from mouse brain (A) Detailed scheme illustrating isolation of ECs from brain. (B) Representative FACS plots for the gating strategy to sort ECs from brain based on sorting live/CD45-/CD31+ cells.
Figure 2
Figure 2
EC isolation from mouse choroid (A) Detailed scheme illustrating isolation of ECs from choroid. (B) Representative FACS plots for the gating strategy to sort ECs from choroid based on sorting live/CD45-/CD31+ cells.
Figure 3
Figure 3
EC isolation from mouse lung (A) Detailed scheme illustrating isolation of ECs from lung. (B) Representative FACS plots for the gating strategy to sort ECs from lung based on sorting live/CD45-/CD31+ cells.
Figure 4
Figure 4
EC isolation from mouse muscle (A) Detailed scheme illustrating isolation of ECs from muscle. (B and C) Representative FACS plots for the gating strategy to sort ECs from EDL (B) and soleus (C) muscle based on sorting live/CD45-/CD31+ cells.
Figure 5
Figure 5
Characterization of the brain and lung EC sample purity (A) t-SNE visualization of scRNA-seq analyses on ECs isolated from mouse brain showing representative EC and non-EC gene markers expression. Red arrowheads are pointing at cells highly expressing the marker gene. Color scale: red, high expression; blue, low expression. (B) Top: t-SNE visualization of brain (non-) ECs color coded per cell type. Red arrowheads are pointing at non-ECs. Bottom: bar plot illustrating the quantification of EC and non-ECs. (C) t-SNE visualization of scRNA-seq analyses on ECs isolated from mouse lung showing representative EC and non-EC gene markers expression and the number of genes expressed per cells. Red arrowheads are pointing at cells highly expressing the marker gene (or cells with low gene number expression). Color scale: red, high expression; blue, low expression. (D) Top: t-SNE visualization of lung (non-) ECs and contaminating cells color coded per cell type. Red arrowheads are pointing at non-ECs. Bottom: bar plot illustrating the quantification of ECs, non-ECs and contaminating cells.
Figure 6
Figure 6
Characterization of the EDL and soleus muscle EC sample purity (A) t-SNE visualization of scRNA-seq analyses on ECs isolated from EDL muscle: representative EC and non-EC gene markers expression and the number of genes expressed per cells. Red arrowheads are pointing at cells highly expressing the marker gene (or cells with low gene number expression). Color scale: red, high expression; blue, low expression. (B) Top: t-SNE visualization of EDL ECs and contaminating cells color coded per cell type. Bottom: bar plot illustrating the quantification of EC and contaminating cells. (C) t-SNE visualization of scRNA-seq analyses on ECs isolated from soleus muscle: representative EC markers expression and the number of genes expressed per cells. Red arrowheads are pointing at cells highly expressing the marker gene (or cells with low gene number expression). Color scale: red, high expression; blue, low expression. (D) Top: t-SNE visualization of soleus (non-) ECs and contaminating cells color coded per cell type. Red arrowheads are pointing at non-ECs. Bottom: bar plot illustrating the quantification of ECs, non-ECs and contaminating cells.

References

    1. Abraham G., Qiu Y., Inouye M. FlashPCA2: principal component analysis of Biobank-scale genotype datasets. Bioinformatics. 2017;33:2776–2778. - PubMed
    1. Assmann J.C., Müller K., Wenzel J., Walther T., Brands J., Thornton P., Allan S.M., Schwaninger M. Isolation and cultivation of primary brain endothelial cells from adult mice. Bio Protoc. 2017;7:e2294. - PMC - PubMed
    1. Cheung K.C.P., Marelli-Berg F.M. Isolation of microvascular endothelial cells. Bio Protoc. 2018;8:e2886. - PMC - PubMed
    1. Choi S., Kim J.A., Kim K.C., Suh S.H. Isolation and in vitro culture of vascular endothelial cells from mice. Korean J. Physiol. Pharmacol. 2015;19:35–42. - PMC - PubMed
    1. Crosswhite P. Isolation of LYVE-1+ endothelial cells from mouse embryos. Bio Protoc. 2018;8:e2962. - PMC - PubMed

Publication types