. 2021 Oct 12;21(20):3863-3875.
doi: 10.1039/d1lc00371b.

Point-of-care microchip electrophoresis for integrated anemia and hemoglobin variant testing

Affiliations

Point-of-care microchip electrophoresis for integrated anemia and hemoglobin variant testing

Ran An et al. Lab Chip. .

Abstract

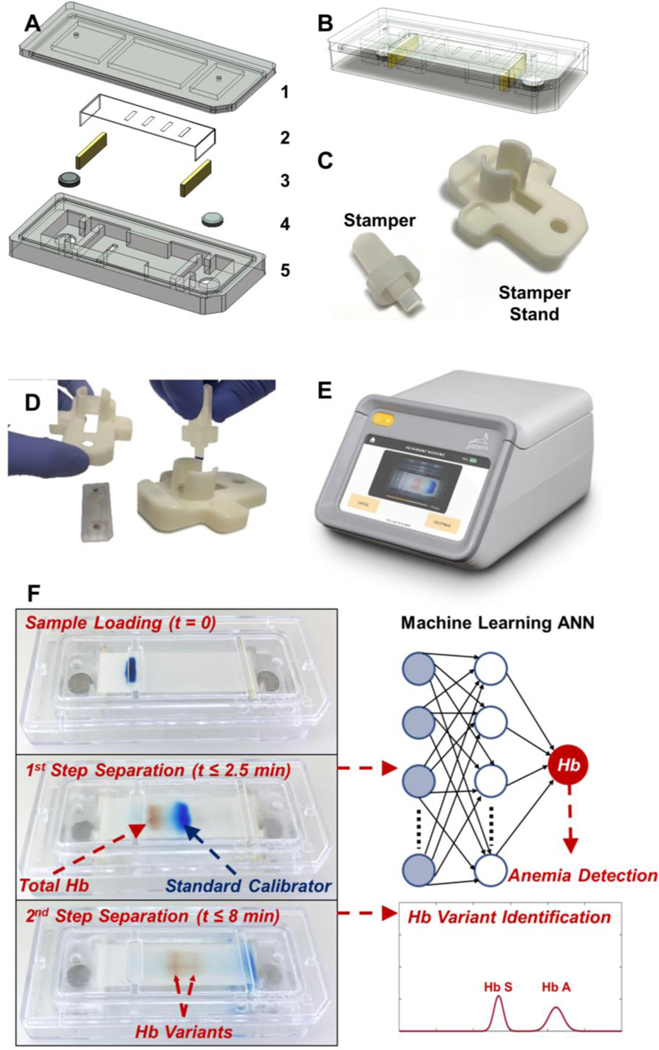
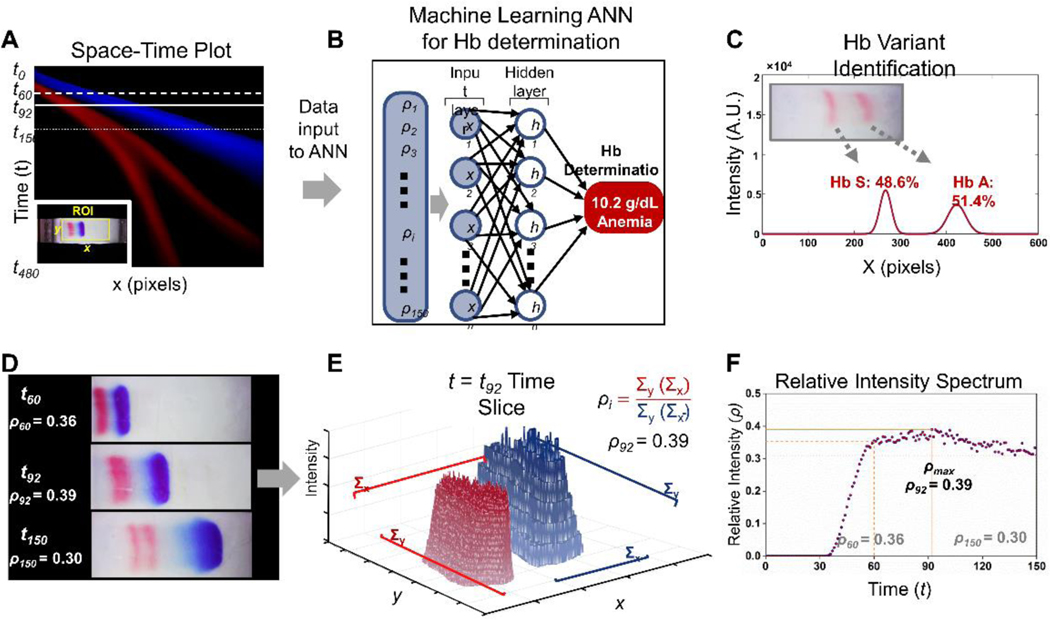
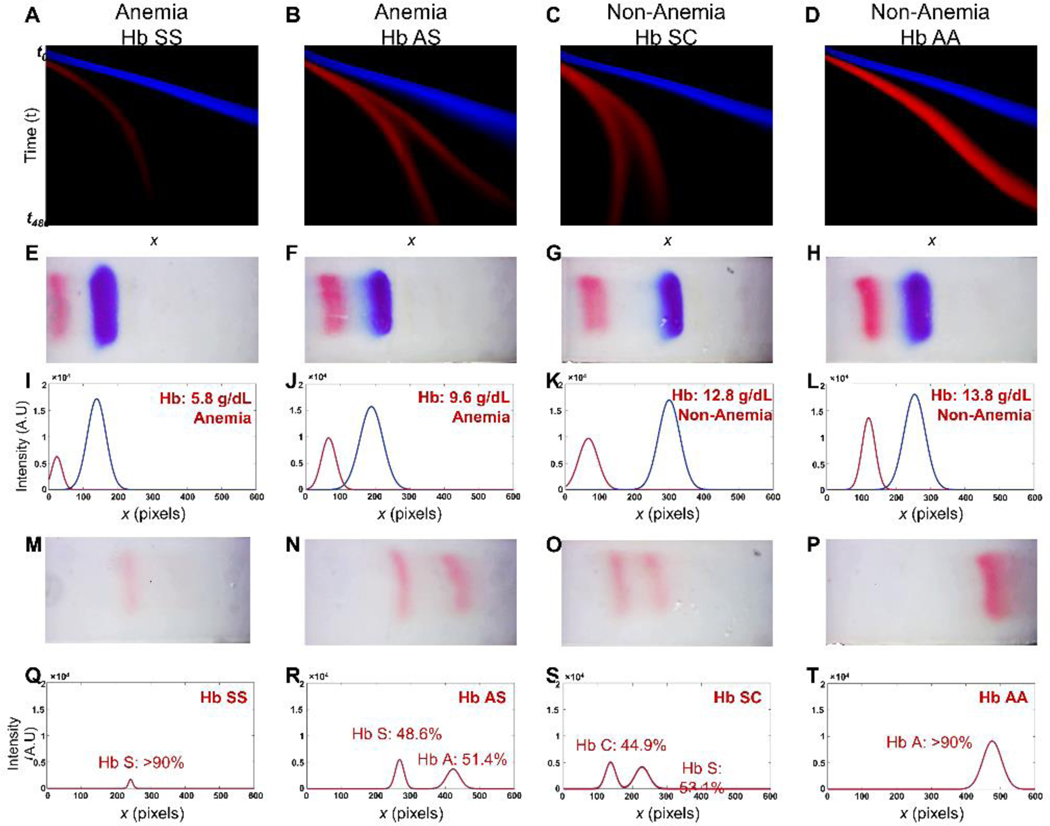
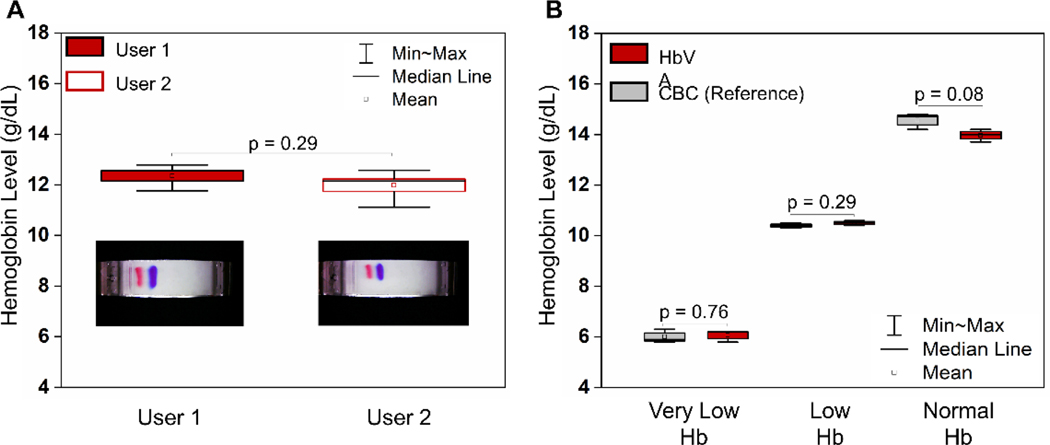
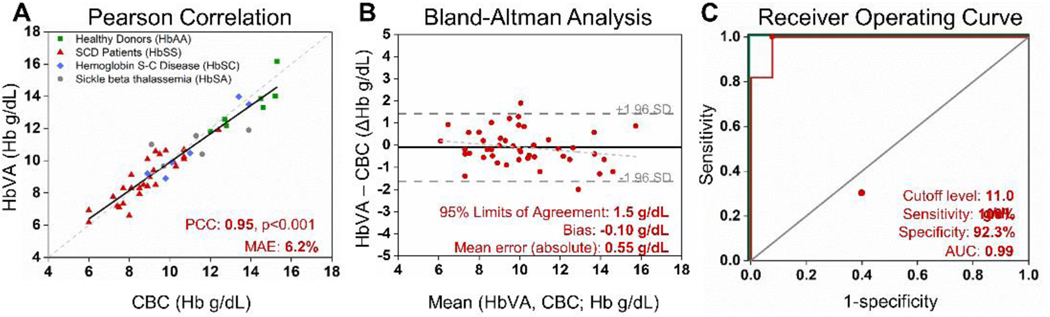
Anemia affects over 25% of the world's population with the heaviest burden borne by women and children. Genetic hemoglobin (Hb) variants, such as sickle cell disease, are among the major causes of anemia. Anemia and Hb variant are pathologically interrelated and have an overlapping geographical distribution. We present the first point-of-care (POC) platform to perform both anemia detection and Hb variant identification, using a single paper-based electrophoresis test. Feasibility of this new integrated diagnostic approach is demonstrated via testing individuals with anemia and/or sickle cell disease. Hemoglobin level determination is performed by an artificial neural network (ANN) based machine learning algorithm, which achieves a mean absolute error of 0.55 g dL-1 and a bias of -0.10 g dL-1 against the gold standard (95% limits of agreement: 1.5 g dL-1) from Bland-Altman analysis on the test set. Resultant anemia detection is achieved with 100% sensitivity and 92.3% specificity. With the same tests, subjects with sickle cell disease were identified with 100% sensitivity and specificity. Overall, the presented platform enabled, for the first time, integrated anemia detection and hemoglobin variant identification using a single point-of-care test.


Conflict of interest statement

Competing interests of Case Western Reserve University employees are overseen and managed by the Conflict of Interests Committee according to a Conflict-of-Interest Management Plan.

Figures

Figure. 1.
Figure. 1.. POC microchip electrophoresis for integrated anemia and hemoglobin variant testing.
(A) HbVA cartridge consists of: (1) a plastic top cover, (2) a strip of cellulose acetate (CA) paper, (3) a pair of blotting pads, (4) embedded stainless-steel round electrodes, and (5) a plastic bottom part. Top and bottom plastic parts were injection molded. (B) HbVA cartridge design alloweds high volume manufacturing and assembly for affordability and single use. (C) A custom designed Stamper and Stamper Stand pair is utilized to achieve reproducible blood sample application into the HbVA cartridge. (D) HbVA cartridge was placed under the Stamper Stand and the blood sample was applied to the cartridge using the Stamper in a single step. (E) HbVA portable battery-operated reader unit accommodated the cartridge and ran the built software and the image analysis algorithm that tracked and analyzed the electrophoresis process in real-time. (F) A schematic representation of the HbVA test process is shown. First, a drop of Blood (red) was mixed with Standard Calibrator (xylene cyanol, blue) and applied on the CA paper in the cartridge (t=0). Within the first 2.5 minutes (t ≤ 2.5 min), the total Hb (red) and standard calibrator (blue) were electrophoretically separated, at which time blood Hb level (g/dL) and anemia status was determined by the algorithm. Next, Hbn variant separation occurred (t ≤ 8 min), which is then analyzed to determine the presence of major hemoglobin variants and types in the blood sample (i.e., Hb A, F, S, and C). The entire electrophoresis process was tracked in real-time and the captured data was analyzed by the machine learning artificial neural network (ANN) algorithm for integrated blood Hb level determination, anemia detection, and Hb variant identification in a single test.
Figure. 2.
Figure. 2.. Overview of HbVA integrated hemoglobin level determination, anemia detection, and hemoglobin variant identification.
(A) 2D space-time plot represents HbVA test band trajectory in time (y-axis) and space (x axis), visually illustrating the full electrophoretic band separation process across a whole video in a single image. Each pixel row of the image corresponds to a single one second frame, with time increasing from top (0 s) to bottom (480 s). For each point on the x axis we plotted the total intensities for the two-color bands (red = Hb and blue = standard calibrator), summed across the y range of the region of interest (ROI). The ROI was illustrated in the inset for a representative video frame. (B) The processing algorithm extracted the relative Hb and calibrator band information within the ROI by generating a relative intensity time series vector ρ(t) for t=0 to 150 s, as input for the trained ANN. Process of computing ρ(t) demonstrated in (E) and (F) and also described in main text. (C) Hb variant was identified based on the final location Hb variant band at the end of the test (t=480 s). (D) Individual frames within the ROI at 3 representative time points during HbVA test. At 60 s, detectable separation initiated between Hb band and standard calibrator band due to their major mobility differences while the Hb band remain unseparated (Top frame, ρ60=0.36). At 92 s, Hb band and standard calibrator band further separates thus increasing band separation resolution (Middle frame ρ92=0.39). At 150 s, total hemoglobin starts to separate into hemoglobin variants due to their minor mobility differences (Bottom frame, ρ150=0.30). (E) 3D intensity profile of Hextracted from image acquired from frame at time slice t = 92 s (solid horizontal line in A and middle image in C). (F) An example pattern of time series vector ρ(t) including ρ1 to ρ150 recognized by the trained ANN.
Figure. 3.
Figure. 3.. Integrated Hb level determination, anemia detection, and Hb variant identification in 4 representative tests on clinical samples with different Hb levels and Hb variants.
(A-D) The first row includes 2D representation of HbVA test band trajectories. (E-H) The second row illustrates a representative frame for each test from the image arrays used to generate relative intensity ratio time series vectors ρ(t), which are then utilized by the artificial neural network (ANN) to determine the Hb levels following the procedure outlined in Fig. 2. (I-L) The third row demonstrates the electropherogram corresponding to the image frames in the second row generated from the intensity profile envelopes. The Hb levels determined by HbVA (red) are compared against the reference method complete blood count (CBC) reported results. (M-P) The fourth row demonstrate the frames utilized to identify Hb variants. (Q-T) The fifth row demonstrates the electropherogram generated according to the band information in the fourth row. Each column represents HbVA test result for each patient. First column: HbVA test result for patient at Hb level of 6.0 g/dL and with homozygous HbSS (sickle cell disease, SCD patient); Second column: HbVA test result for patient at Hb level of 10.3 g/dL and with heterozygous HbAS (SCD patient undergoing transfusion therapy); Third column: HbVA test result for patient at Hb level of 12.7 g/dL and with heterozygous Hb SC disease (hemoglobin C disease); Fourth column: HbVA test results for patient at Hb level of 14.5 g/dL and with homozygous HbAA (healthy subject). The HbVA Hb level determination and anemia detection results are compared against the reference method complete blood count (CBC) reported results. The Hb variant identified by HbVA are compared against the reference method high performance liquid chromatography (HPLC) reported results. HbVA demonstrated agreement in Hb level determination, anemia detection and Hb variant identification with reference standard methods CBC and HPLC. (Patient 1: HbVA: 5.8 g/dL, Anemia, Hb SS vs. CBC&HPLC: 6.0 g/dL, Anemia, Hb SS; Patient 2: HbVA: 9.6 g/dL, Anemia, Hb AS vs. CBC&HPLC: 10.3 g/dL, Anemia, Hb AS; Patient 3: HbVA: 12.8 g/dL, Anemia, Hb SC vs. CBC&HPLC: 12.7 g/dL, Anemia, Hb SC; Patient 4: HbVA: 13.8 g/dL, Non-anemia, Hb AA vs. CBC&HPLC: 14.5 g/dL, Non-anemia, Hb AA). These results demonstrate HbVA’s integrated blood Hb level determination and Hb variant identification.
Figure. 4.
Figure. 4.. Repeatability and Reproducibility of Hemoglobin Variant/Anemia (HbVA) test:
(A) Repeatability test of HbVA Hb level determination was tested with 10 repeated tests using the same sample, comparing variances between 2 users (demonstrated in the inset figures). The determined Hb levels between 2 users demonstrate strong repeatability (Mean ± SD (User 1 vs User 2), = 11.99 ± 0.55 vs. 12.35 ± 0.45, coefficient of variance (COV) = 4.2%). All 10 repeated tests demonstrated agreement within ±1.0 g/dL with the 12.7 g/dL Hb level reported by reference standard of complete blood count (CBC). (B) Reproducibility test of HbVA Hb level determination were tested using 3 samples with very low, low and normal Hb levels reported from CBC. Each sample was tested 3 times by both HbVA and CBC. The standard deviation of HbVA determined Hb levels were within 4% COV across very low, low and normal Hb levels (Mean ± SD and COV for low, middle and high Hb levels: 6.1 ± 0.2 g/dL, 3.8%; 10.5 ± 0.1 g/dL, 1.0%; and 14.0 ± 0.3 g/dL, 2.1%, respectively, n=3 for each sample). HbVA determined Hb levels also demonstrated good accuracy within ±0.6 g/dL and ±5.0% with the CBC reported comparing to CBC reported data.
Figure. 5.
Figure. 5.. Hemoglobin Variant/Anemia (HbVA) artificial neural network (ANN) based machine learning algorithm accurately determines Hb levels and anemia status.
(A) HbVA measures blood Hb levels were strongly associated with CBC measured results (PCC=0.95, p<0.001). The dashed line represents the ideal result where HbVA Hb level is equal to the CBC Hb level whereas solid line represents the actual data fit. (B) Bland-Altman analysis revealed HbVA determines blood Hb levels to within ±0.55 of the Hb level (absolute mean error) with minimal experimental bias with −0.1 g/dL, indicating that Hb determination has very small bias. The dashed light grey line indicated the relationship between the residual and the average Hb level measurements obtained from the CBC and HBVA (r = −0.07). The dashed dark grey line represented 95% limits of agreement (±1.5 g/dL). (C) The receiver-operating characteristic (ROC) analysis graphically illustrates HbVA’s performance against a random chance diagnosis (grey line), with an area under the curve of 0.99, and a perfect diagnostic (green lines), with an area under the curve of 1. The area under the curve of 0.99 suggested HbVA’s viable diagnostic performance. n=46

References

    1. Kassebaum NJ, Jasrasaria R, Naghavi M, Wulf SK, Johns N, Lozano R, Regan M, Weatherall D, Chou DP, Eisele TP, Flaxman SR, Pullan RL, Brooker SJ and Murray CJ, Blood, 2014, 123, 615–624. - PMC - PubMed
    1. Chaparro CM and Suchdev PS, Ann N Y Acad Sci, 2019, 1450, 15–31. - PMC - PubMed
    1. T. W. H. Organization.
    1. W. H. Organization, WHO Global Database on Anaemia, 2008.
    1. Soares Magalhães RJ and Clements ACA, Bull World Health Organ, 2011, 89, 459–468. - PMC - PubMed

Publication types