

Preventing dataset shift from breaking machine-learning biomarkers
- PMID: 34585237
- PMCID: PMC8478611
- DOI: 10.1093/gigascience/giab055
Preventing dataset shift from breaking machine-learning biomarkers
Abstract
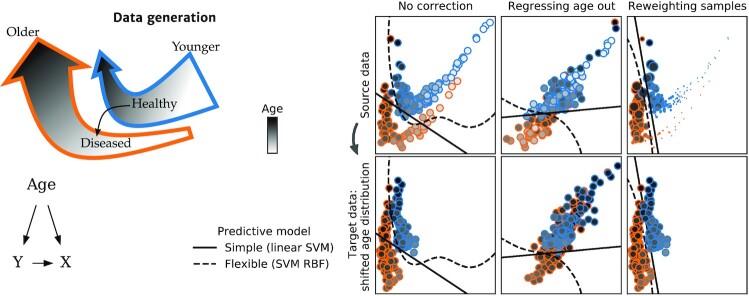
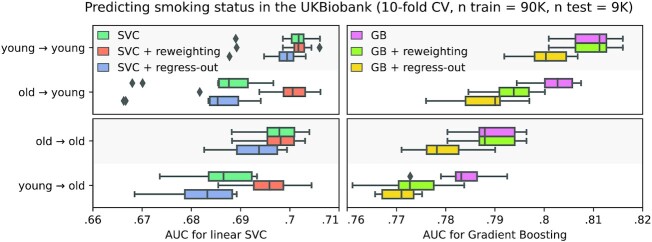
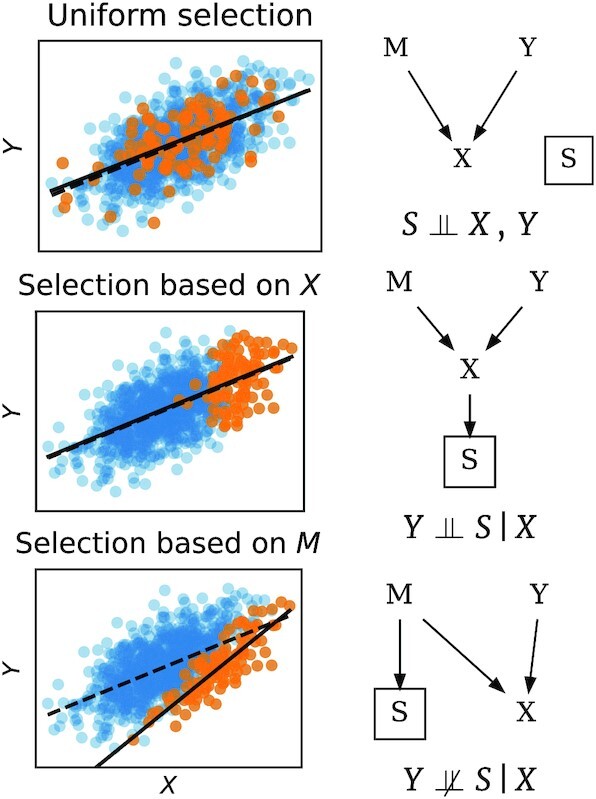
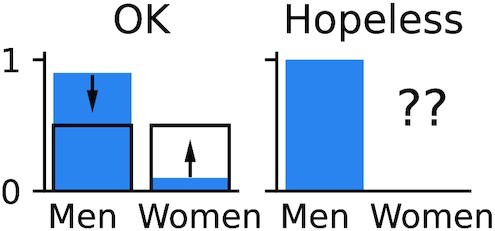
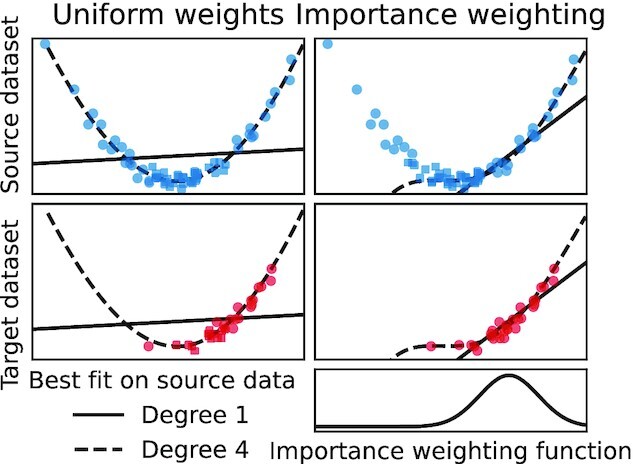
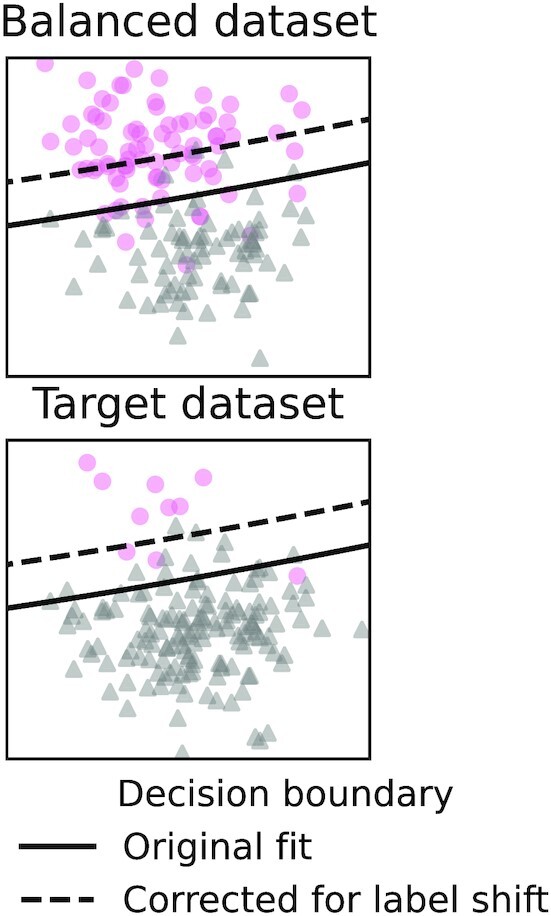
Machine learning brings the hope of finding new biomarkers extracted from cohorts with rich biomedical measurements. A good biomarker is one that gives reliable detection of the corresponding condition. However, biomarkers are often extracted from a cohort that differs from the target population. Such a mismatch, known as a dataset shift, can undermine the application of the biomarker to new individuals. Dataset shifts are frequent in biomedical research, e.g., because of recruitment biases. When a dataset shift occurs, standard machine-learning techniques do not suffice to extract and validate biomarkers. This article provides an overview of when and how dataset shifts break machine-learning-extracted biomarkers, as well as detection and correction strategies.
Keywords: biomarker; dataset shift; generalization; machine learning.
© The Author(s) 2021. Published by Oxford University Press GigaScience.
Conflict of interest statement
The authors declare that they have no competing interests.
Figures
Similar articles
-
Ensemble machine learning model trained on a new synthesized dataset generalizes well for stress prediction using wearable devices.J Biomed Inform. 2023 Dec;148:104556. doi: 10.1016/j.jbi.2023.104556. Epub 2023 Dec 2. J Biomed Inform. 2023. PMID: 38048895
-
Identifying novel transcript biomarkers for hepatocellular carcinoma (HCC) using RNA-Seq datasets and machine learning.BMC Cancer. 2021 Aug 27;21(1):962. doi: 10.1186/s12885-021-08704-9. BMC Cancer. 2021. PMID: 34445986 Free PMC article.
-
Detection of biomarkers using terahertz metasurface sensors and machine learning.Appl Opt. 2023 Feb 1;62(4):1027-1034. doi: 10.1364/AO.478461. Appl Opt. 2023. PMID: 36821160
-
Systematic Review of Approaches to Preserve Machine Learning Performance in the Presence of Temporal Dataset Shift in Clinical Medicine.Appl Clin Inform. 2021 Aug;12(4):808-815. doi: 10.1055/s-0041-1735184. Epub 2021 Sep 1. Appl Clin Inform. 2021. PMID: 34470057 Free PMC article.
-
Advancements within Modern Machine Learning Methodology: Impacts and Prospects in Biomarker Discovery.Curr Med Chem. 2021;28(32):6512-6531. doi: 10.2174/0929867328666210208111821. Curr Med Chem. 2021. PMID: 33557728 Review.
Cited by
-
Integrated bioinformatical analysis, machine learning and in vitro experiment-identified m6A subtype, and predictive drug target signatures for diagnosing renal fibrosis.Front Pharmacol. 2022 Aug 31;13:909784. doi: 10.3389/fphar.2022.909784. eCollection 2022. Front Pharmacol. 2022. PMID: 36120336 Free PMC article.
-
Power and reproducibility in the external validation of brain-phenotype predictions.bioRxiv [Preprint]. 2023 Oct 30:2023.10.25.563971. doi: 10.1101/2023.10.25.563971. bioRxiv. 2023. Update in: Nat Hum Behav. 2024 Oct;8(10):2018-2033. doi: 10.1038/s41562-024-01931-7. PMID: 37961654 Free PMC article. Updated. Preprint.
-
Identification of antigen-presentation related B cells as a key player in Crohn's disease using single-cell dissecting, hdWGCNA, and deep learning.Clin Exp Med. 2023 Dec;23(8):5255-5267. doi: 10.1007/s10238-023-01145-7. Epub 2023 Aug 8. Clin Exp Med. 2023. PMID: 37550553
-
Deep neural networks learn general and clinically relevant representations of the ageing brain.Neuroimage. 2022 Aug 1;256:119210. doi: 10.1016/j.neuroimage.2022.119210. Epub 2022 Apr 21. Neuroimage. 2022. PMID: 35462035 Free PMC article.
-
Considerations for Quality Control Monitoring of Machine Learning Models in Clinical Practice.JMIR Med Inform. 2024 Jun 28;12:e50437. doi: 10.2196/50437. JMIR Med Inform. 2024. PMID: 38941140 Free PMC article.
References
-
- Andreu-Perez J, Poon CC, Merrifield RD, et al. Big data for health. IEEE J Biomed Health Inform. 2015;19(4):1193–208. - PubMed
-
- Faust O, Hagiwara Y, Hong TJ, et al. Deep learning for healthcare applications based on physiological signals: A review. Comput Methods Programs Biomed. 2018;161:1–13. - PubMed
-
- FDA. FDA report on “Mammoscreen.". 2020. https://fda.report/PMN/K192854, accessed: 10 August 2021.
Publication types
MeSH terms
Substances
Grants and funding
LinkOut - more resources
Full Text Sources
