. 2022 Feb;20(2):360-373.
doi: 10.1111/pbi.13717. Epub 2021 Oct 24.

Mini-synplastomes for plastid genetic engineering

Affiliations

Mini-synplastomes for plastid genetic engineering

Alessandro Occhialini et al. Plant Biotechnol J. 2022 Feb.

Abstract

In the age of synthetic biology, plastid engineering requires a nimble platform to introduce novel synthetic circuits in plants. While effective for integrating relatively small constructs into the plastome, plastid engineering via homologous recombination of transgenes is over 30 years old. Here we show the design-build-test of a novel synthetic genome structure that does not disturb the native plastome: the 'mini-synplastome'. The mini-synplastome was inspired by dinoflagellate plastome organization, which is comprised of numerous minicircles residing in the plastid instead of a single organellar genome molecule. The first mini-synplastome in plants was developed in vitro to meet the following criteria: (i) episomal replication in plastids; (ii) facile cloning; (iii) predictable transgene expression in plastids; (iv) non-integration of vector sequences into the endogenous plastome; and (v) autonomous persistence in the plant over generations in the absence of exogenous selection pressure. Mini-synplastomes are anticipated to revolutionize chloroplast biotechnology, enable facile marker-free plastid engineering, and provide an unparalleled platform for one-step metabolic engineering in plants.

Keywords: Solanum tuberosum; episomal replication; homologous recombination; plastid engineering; plastome; small synthetic plastome ‘mini-synplastome’.


Conflict of interest statement

The authors declare no competing interests.

Figures

Figure 1
Figure 1
Vector design. (a) Design of trnI/trnA homologous arms (~2.8 and ~4.6 kb) used in Gen1 vector construction. An alignment of homologous regions in the potato and tobacco plastome along with the two synthetic sequences used in the design of the Gen1 vector are indicated. A total of 35 regions of sequence difference are located within homologous regions. A vertical bar (|) without any symbols indicates sequence identity compared to the potato plastome, whereas an asterisk (*), minus (−), or plus (+) indicates single nucleotide polymorphism (SNP), sequence deletion or addition, respectively. Black symbols indicate wild‐type mutations between potato and tobacco, whereas red symbols indicated synthetic mutations introduced in Gen1 sequences. OriA2 and A1 (black bars) and NICE1 (grey bar) are also indicated. (b) Schematic representation of two DNA constructs, Gen1 (~12.7 kb) and pSSC (~11.6 kb), used in this work and their integration site in the native plastome. IR trnI/trnA homologous arms of the Gen1 vector (~2.8 and ~4.6 kb, respectively, including oriA2A1 and NICE1) and ndhG/ndhI homologous arms of the pSSC (~1.8 and ~5 kb, respectively) are indicated. A selection cassette located between arms is indicated: Prom‐SD (P): rrn promoter along with a Shine‐Dalgarno sequence (grey); aadA: spectinomycin resistance gene (yellow); 5UTR: 5′ untranslated region (blue); smGFP: gene encoding the soluble monomeric green fluorescent protein (green); and 3UTR (T): 3′ untranslated region (light grey). Backbone vectors containing the kanamycin (KanR) or spectinomycin (SpcR) resistance gene are indicated in Gen1 and pSSC constructs. Gen1 and pSSC integration into trnI/trnA and ndhG/ndhI sites of the native plastome along with the location of primers used to check integration (red arrows) and the molecular weight of wild‐type (~0.46 and ~0.44 kb, for trnI/trnA and ndhG/ndhI, respectively) and transplastomic (~2.8 and ~2.6 kb, for Gen1 and pSSC integrated, respectively) PCR products are indicated. (c) Table indicating the percentage of vector integration in transplastomic lines. Tot. (n): total number of lines analysed; Trans. (n): total number of positive lines for the presence of aadA and smGFP genes; Tot. int. (n): total number of lines with vector integration; Int. (%): percentage of plants with vector integration.
Figure 2
Figure 2
Characterization of e Gen1‐containing lines. (a) Schematic representation of the possible fates of the Gen1 vector in plants are shown: (1) integration of the transgene cassette into the trnI/trnA site of the potato plastome; (2) nonspecific integration of the transgene cassette into an unknown site, while an episome ( e Gen1) is formed from the vector backbone and the remaining homologous sequence. The rrn promoter and a Shine‐Dalgarno sequence (P; grey); aadA gene (yellow); 5′ untranslated region (5′; blue); smGFP gene (green); 3′ untranslated region (T; light grey); the trnI/trnA arms; and the backbone vectors containing KanR gene are indicated in the figure. The location of IR, aadA, and KanR probes is indicated with red, dark, and blue bars, respectively. The molecular weights of DNA fragments obtained using KasI/HindIII (for IR and aadA probes) and FseI/FspI (for the KanR probe) restriction enzymes are also indicated. (b) Southern blot analysis performed using an IR, aadA or a KanR probe and total leaf genomic‐DNA preparations from an e Gen1‐containing line, a Gen1‐integrating line, and a wild‐type control is shown. Molecular weight of DNA fragments (kb) are indicated in the blots. (c) Wild‐type potato plants along with the e Gen1‐containing line grown in vitro and for 2 weeks in potting mix are shown. Insert shows bacterial colonies transformed with e Gen1 extracted from leaf tissue (scale bar: 10 mm). (d) Graph summarizing the ratio of copy number of episomal DNA vs the copy number of plastome (copy n. episomal/plastome) in genomic DNA preparations of e Gen1‐containing plants by qPCR. Wild‐type potato plants were used as negative control. Two graphs representing in vitro plants at the second round of tissue culture and plants grown on potting mix without selection (2, 4, 7, and 10 weeks) are shown. Results are expressed as mean ± standard deviation. For plants in tissue culture, 5 biological and 9 technical replicates per biological replicate were used. For plants on potting mix, 3 biological and 4 technical replicates per each biological replicate were used. Means separation was evaluated using ANOVA Tukey HSD (P < 0.05). Statistical significance is indicated by different letters.
Figure 3
Figure 3
Characterization of synplastomic e Gen2‐containing lines. (a) Schematic representation of the possible fates of the Gen2 vector in plants are shown: 1) full‐length e Gen2 and/or e Gen2Δ. For simplicity of sequence comparison, these two plasmids, e Gen2 and e Gen2Δ, are represented in linear form. In e Gen2Δ, ~7.9 kb was excised by loop‐out recombination reconstituting Prrn. Perpendicular black arrows indicate deletion sites, while parallel double arrows indicate molecular weight of fragments. The trnI/trnA homologous region and the backbone vector containing the KanR gene, an E. coli origin of replication (E. ori), and the dual selection cassette are indicated. The Prrn promoter fused to a ribosome binding site (P, deep grey); aadA gene (yellow); 5′UTR (5′, blue); smGFP gene (green); and the 3′UTR/terminator (T, grey) are indicated in the selection cassette. Restriction enzyme combinations used for Southern blots, KasI/HindIII and FseI/FspI, together with the sizes of predicted DNA fragments are indicated. The KasI/HindIII and FseI/FspI fragments were detected by a ~0.5 kb probe designed on trnI/trnA (red bar) or KanR (blue bar), respectively. (b) Southern blot analysis performed using either an IR or KanR probe and leaf total DNA preparations from e Gen2‐containing lines 1–3 and a line harbouring e Gen2Δ. DNA samples from e Gen1‐containing and Gen1‐integrating lines along with wild‐type plants were used as a comparison. Molecular weight of DNA fragments (kb) are indicated in the blots. (c) qRT‐PCRs using cDNA preparations from e Gen2‐containing lines 1–3 and e Gen2Δ lines. e Gen1‐containing and Gen1‐integrating lines along with wild‐type controls have been included. Graphs showing the relative expression of smGFP (white bars) and aadA (grey bars) compared to the internal reference gene ef1 (y axis: 2ΔCT) are shown. The results are expressed as mean ± SD (standard deviation) of three biological and three technical replicates. (d) Confocal image showing smGFP localization to the chloroplast in both e Gen2‐ and e Gen2Δ‐containing lines. smGFP (green), chlorophyll (red), bright field (BF), and merged images are shown. Scale bars: 20 µm. (e) Graph summarizing the ratio of episomal plasmid copy number to the copy number of the plastome (copy n. episomal/plastome) in genomic DNA preparations of e Gen2 and e Gen2Δ‐containing lines determined by qPCR. Wild‐type plants were used as a negative control. PCR analyses were performed to calculate the ratio of copy number for all forms ( e Gen2 and e Gen2Δ; grey bars) and only the full‐length e Gen2 (white bars). Results are expressed as mean ± standard deviation of five biological and three technical replicates per each biological replicate. In graphs C and E, mean separation was evaluated using ANOVA Tukey HSD (P < 0.05), and statistical significance is indicated by different letters.
Figure 4
Figure 4
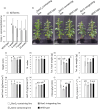
Growth characteristics of synplastomic plants. (a) Graph summarizing the ratio of episomal plasmid copy number vs the copy number of plastome (copy n. episomal/plastome) in genomic DNA preparations of e Gen2‐containing line 2 at different plant developmental stages (1, 4, 7, and 10 weeks in pots) determined by qPCR. Wild‐type plants were used as negative controls. PCRs were performed to determine the copy number for all plasmid forms ( e Gen2 and e Gen2Δ). The results shown are mean ± standard deviation of five biological replicates (plants 1–5) and three technical replicates per biological replicate. (b) Images showing 10‐week‐old e Gen2‐containing line 2, an e Gen1‐containing line, and a Gen1‐integrating transplastomic line compared to wild‐type control plants. Scale bar: 10 cm. Graphs represent various plant characteristics: (c) Plant height; (d) number (N) of nodes; (e) total fresh weight; (f) total dry weight; (g) ratio of leaf fresh weight (g) to foliar area (m2); (h) ratio of leaf dry weight (g) to foliar area (m2); (i) chlorophyll content index (CCI); and (j) leaf CO2 assimilation (µmol/m2/s). The results are expressed as mean ± standard deviation of five plants per each transgenic line and wild‐type control. For all graphs means separation was evaluated using ANOVA Tukey HSD (P < 0.05). Statistical significance is indicated by different letters.
Figure 5
Figure 5
Plastid genetic engineering using the mini‐synplastome. (a) Different methods of chloroplast transformation. The traditional method of chloroplast transformation is based on the utilization of vectors able to integrate into the plastome by homologous recombination (top image). A new method of chloroplast transformation based on the utilization of non‐integrating episomal vectors able to persist as small independent synthetic plastomes, mini‐synplastomes (bottom image). The chloroplast genome (plastome), integration vector, and mini‐synplastomes are indicated in the chloroplast stroma (S). The chloroplast origin of replication (ori, in red), thylakoids (T) and chloroplast membranes (M) are also indicated. (b) The design–build–test cycle used to develop the mini‐synplastome platform for chloroplast transformation: (1) Biolistic transformation of leaf tissue using chloroplast‐specific integration vectors (Gen1) and selection for transplastomic lines without vector integration; (2) screening for lines containing the episome, e Gen1, and isolation of this plasmid by back‐transformation into E. coli; (3) based on sequence analysis informed from e Gen1, Gen1 was used as backbone to synthesize the Gen2 plasmid which was used to transform chloroplasts; (4) synplastomic lines containing the episome e Gen2 were generated. Homologous arms (yellow), chloroplast ori (red), and transgene cassette (green) are indicated in the plasmids.

References

    1. Barbrook, A.C. , Dorrell, R.G. , Burrows, J. , Plenderleith, L.J. , Nisbet, R.E. and Howe, C.J. (2012) Polyuridylylation and processing of transcripts from multiple gene minicircles in chloroplasts of the dinoflagellate Amphidinium carterae . Plant Mol. Biol. 79, 347–357. - PubMed
    1. Barbrook, A.C. and Howe, C.J. (2000) Minicircular plastid DNA in the dinoflagellate Amphidinium operculatum . Mol. Gen. Genet. 263, 152–158. - PubMed
    1. Carrillo, N. and Bogorad, L. (1988) Chloroplast DNA replication in vitro: site‐specific initiation from preferred templates. Nucleic Acids Res. 16, 5603–5620. - PMC - PubMed
    1. Chan, H.T. , Xiao, Y. , Weldon, W.C. , Oberste, S.M. , Chumakov, K. and Daniell, H. (2016) Cold chain and virus‐free chloroplast‐made booster vaccine to confer immunity against different poliovirus serotypes. Plant Biotechnol. J. 14, 2190–2200. - PMC - PubMed
    1. Chiu, W.L. and Sears, B.B. (1992) Electron microscopic localization of replication origins in Oenothera chloroplast DNA. Mol. Gen. Genet. 232, 33–39. - PubMed

Publication types

LinkOut - more resources