. 2021 Oct 27;6(5):e0075121.
doi: 10.1128/mSphere.00751-21. Epub 2021 Sep 29.

Helicobacter pylori and Epstein-Barr Virus Coinfection Stimulates Aggressiveness in Gastric Cancer through the Regulation of Gankyrin

Affiliations

Helicobacter pylori and Epstein-Barr Virus Coinfection Stimulates Aggressiveness in Gastric Cancer through the Regulation of Gankyrin

Dharmendra Kashyap et al. mSphere. .

Abstract

Persistent coinfection with Helicobacter pylori and Epstein-Barr virus (EBV) promotes aggressive gastric carcinoma (GC). The molecular mechanisms underlying the aggressiveness in H. pylori and EBV-mediated GC are not well characterized. We investigated the molecular mechanism involved in H. pylori- and EBV-driven proliferation of gastric epithelial cells. Results showed that the coinfection is significantly more advantageous to the pathogens as coinfection creates a microenvironment favorable to higher pathogen-associated gene expression. The EBV latent genes ebna1 and ebna3c are highly expressed in the coinfection compared to lone EBV infection at 12 and 24 h. The H. pylori-associated genes 16S rRNA, cagA, and babA were also highly expressed during coinfection compared to H. pylori alone. In addition, upregulation of gankyrin, which is a small oncoprotein, modulates various cell signaling pathways, leading to oncogenesis. Notably, the knockdown of gankyrin decreased the cancer properties of gastric epithelial cells. Gankyrin showed a similar expression pattern as that of ebna3c at both transcript and protein levels, suggesting a possible correlation. Further, EBV and H. pylori created a microenvironment that induced cell transformation and oncogenesis through dysregulation of the cell cycle regulatory (ccnd1, dapk3, pcna, and akt), GC marker (abl1, tff-2, and cdx2), cell migration (mmp3 and mmp7), DNA response (pRB, pten, and p53), and antiapoptotic (bcl2) genes in infected gastric epithelial cells through gankyrin. Our study provides a new insight into the interplay of two oncogenic agents (H. pylori and EBV) that leads to an enhanced carcinogenic activity in gastric epithelial cells through overexpression of gankyrin. IMPORTANCE In the present study, we evaluated the synergistic effects of EBV and H. pylori infection on gastric epithelial cells in various coinfection models. These coinfection models were among the first to depict the exposures of gastric epithelial cells to EBV followed by H. pylori; however, coinfection models exist that narrated the scenario upon exposure to H. pylori followed by that to EBV. We determined that a coinfection by EBV and H. pylori enhanced the expression of oncogenic protein gankyrin. The interplay between EBV and H. pylori promoted the oncogenic properties of AGS cells like elevated focus formation, cell migration, and cell proliferation through gankyrin. EBV and H. pylori mediated an enhanced expression of gankyrin, which further dysregulated cancer-associated genes such as cell migratory, tumor suppressor, DNA damage response, and proapoptotic genes.

Keywords: Epstein-Barr virus; Helicobacter pylori; coinfection; gankyrin; gastric cancer.


Figures

FIG 1
FIG 1
Coinfection models of H. pylori and EBV depict insight into the pathophysiology of gastric cancer. Illustration of all the studied infection models. AGS cells were cultured in 6-well plates, and I10 and EBV were directly incubated with these cells. (A) Uninfected AGS control cells. (B) Infection-I portrayed the infection by I10. (C) Infection-II AGS cells were infected with EBV only. (D) Infection-III AGS cells were infected sequentially, first exposing the cells to EBV for 6 h and then incubating the exposed cells with I10. (E) Infection-IV AGS cells were first exposed to I10 and then incubated with EBV. All the infected cells were further incubated for 12, 24, and 48 h. These infection models were used for the whole of this study except colony formation assay.
FIG 2
FIG 2
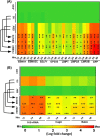
Interplay between H. pylori and EBV synergistically increases the transcript of their associated pathogenic genes. Heat map represents the log fold change of relative transcript expression of EBV-associated latent (ebna1, ebna3c, lmp1, lmp2a, and lmp2b) and lytic (bzlf1 and gp350) genes and EBV-tagged gfp gene (A). Furthermore, the relative transcripts of I10-associated signature 16S rRNA, pathogenic cytotoxin-associated gene A (cagA), and blood group antigen binding adhesin A (babA) in all the infection models for 12-, 24-, and 48-h postinfection samples are shown (B). The experiment was performed for two biological and two technical replicates, and the results are shown as the mean ± SD for two independent experiments.
FIG 3
FIG 3
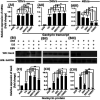
Coinfection of H. pylori and EBV upregulates the oncogenic protein gankyrin at both transcript and protein levels. Relative transcript expression of gankyrin in coinfection models depicts the expression of gankyrin at 12, 24, and 48 h (AI, AII, and AIII, respectively). Western blot image of protein gankyrin for 12-, 24-, and 48-h postinfection samples (BI, BII, and BIII, respectively). Further, the quantitative representation of Western blot image by Image J software and representative graph presented in terms of fold changes for 12-, 24-, and 48-h postinfection samples (CI, CII, and CIII, respectively). Interestingly, significantly higher expression of gankyrin was observed in 12- and 24-h postinfection samples, while the expression of gankyrin was significantly downregulated in infection-II, -III, and -IV in 48-h postinfection samples. The experiment was performed for two biological and one technical replicate, and the results are shown as the mean ± SD from two independent experiments. GAPDH, glyceraldehyde-3-phosphate dehydrogenase.
FIG 4
FIG 4
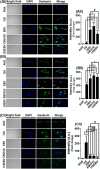
Coinfection by EBV and H. pylori causes gastric cancer through the upregulation of oncogenic protein gankyrin. Immunofluorescence results for the oncogenic gankyrin gene validate our previous transcripts and Western blotting results. Graphical representation of quantified immunoblot image through the Image J software. After the coinfection by I10 and EBV, we observed elevated protein expression of gankyrin at all the time points for all studied infections except 48 h postinfection, in which we observed downregulation of gankyrin in infection-II, -III, and -IV. (AI, BI, and CI) Representative immunoblot image of gankyrin represents the protein expression of gankyrin after 12, 24, and 48 h postinfection, respectively. First row shows an uninfected AGS cell. Second and third rows illustrate the gankyrin protein expression in infection-I and -II, while the fourth and fifth rows show the intensity of gankyrin expression after infection-III and -IV. (AII) Approximately 400- to 500-fold-increased expression of gankyrin observed in infection-II and -III after 12 h postinfection. (BII) The expression pattern of gankyrin in 24-h postinfection samples is about 600- to 650-fold higher in infection-III and -IV. (CII) The expression of oncogenic protein gankyrin after 48 h postinfection is about 200-fold higher in infection-I. Furthermore, the expression of gankyrin in infection-II is about equal to that in infection-III, while 25- to 30-fold-lower expression of gankyrin is observed in infection-IV. The experiment has been performed for two biological and three technical replicates, and the results are shown as the mean ± SD from two independent experiments.
FIG 5
FIG 5
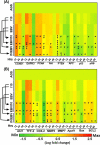
Coinfection by H. pylori and EBV promotes aggressiveness of gastric epithelial cells by the modulation of transcript expression of various cell signaling genes. (A) Heat map represents log fold change expression profiles of cell cycle regulators, viz., cyclin D1 (ccnd1), death-associated protein kinase 3 (dapk3), proliferating cell nuclear antigen (pcna), and AKR thymoma (akt). This heat map also illustrates the expression profiles of tumor suppressor phosphatase and tensin homolog (pten), adenomatous polyposis coli (apc), protein 53 (p53), and protein retinoblastoma (pRB) genes in all the four infection models including uninfected AGS cells at 12-, 24-, and 48-h time points. (B) Expression profiles of gastric cancer marker tyrosine protein kinase (abl1), trefoil factor-2 (tff-2), and transcription factor (cdx-2). Meanwhile, this heat map also represents the expression profiles of cell migratory matrix metalloprotease 3 (mmp3), matrix metalloprotease 7 (mmp7), and DNA damage response genes apoptotic protease activating factor 1 (apaf1), bcl2-associated x protein (Bax), and B-cell lymphoma 2 (bcl2). The experiment was performed for two biological and two technical replicates, and the results are shown as the mean ± SD from two independent experiments.
FIG 6
FIG 6
Coinfection-mediated and ectopic expression of gankyrin in AGS cells promotes the cell proliferation by interfering with the expression of various cell-signaling-associated cellular genes. (A) Representative Western blot showing the ectopic expression of oncogenic protein gankyrin. (B) Graphical representation of increased concentration gradient of gankyrin quantified by the Image J software of Western blot image. (C) Ectopic expression of gankyrin enhances the cell proliferation in trypan blue cell exclusion method of cell counting. (D) Heat map represents that infection by I10 and EBV also enhances the rate of cell proliferation in all studied infection models and may potentially be linked with the increased expression of gankyrin. (E) Ectopic expression of gankyrin significantly enhanced the expression of cell migratory genes mmp7 and mmp3. (F and G) Representative graph shows the elevated expression of cell cycle regulatory genes akt and ccnd1 and protooncogene hepatoma upregulated protein (hurp), respectively. (H) Moreover, overexpression of gankyrin significantly alleviates the expression of tumor suppressor genes pten, apc, and pRB. (I) Meanwhile, the expression of gastric cancer marker gastrin gene expression is slightly lower followed by the upregulation of C-C motif chemokine ligand-8 (ccl-8), tff-2, and cdx-2. The experiment was performed for two biological and two technical replicates, and the results are shown as the mean ± SD from two independent experiments.
FIG 7
FIG 7
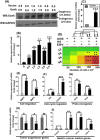
In the presence of H. pylori and EBV, knockdown of gankyrin decreased the oncogenic properties of gastric epithelial cells. (A) Illustration of the relative expression of gankyrin transcripts in a dose-dependent manner. (BI) Representative Western blot image showing the decreased expression of gankyrin in a concentration-dependent manner. (BII) Relative quantification of protein blotting through Image J. (C) Relative transcript expression of gankyrin while given the transfection of 2 μg of sh-G plasmid. (D and E) Interestingly, heat map represents the increased cell proliferation rate in sh-C (D), while upon knockdown of gankyrin, there was a significantly decreased cell proliferation compared to sh-C (E). The experiment was performed for two biological and one technical replicate, and the results are shown as the mean ± SD from two independent experiments.
FIG 8
FIG 8
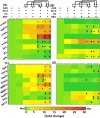
Knockdown of gankyrin modulates the expression profiles of EBV- and H. pylori-associated carcinogenic genes. (A) Heat map shows the relative log fold change expression of EBV-associated latent pathogenic (ebna1, ebna3c, lmp1, lmp2a, and lmp2b) and lytic (bzlf1 and gp350) gene and EBV-tagged gfp gene expression profiles in the presence of sh-C. (B) Heat map represents the qRT-PCR data of EBV-associated latent and lytic and EBV-tagged gfp gene expression during knockdown of gankyrin in AGS cells. (C and D) Expression of I10-associated pathogenic gene expression in the presence of sh-C and sh-G, respectively. Importantly, in this experiment we have given the transfection of sh-C or sh-G for 24 h and then provided the infection by I10 and EBV as described in the legend to Fig. 1. The experiment was performed for two biological and two technical replicates, and the results are shown as the mean ± SD for two independent experiments.
FIG 9
FIG 9
Even in the presence of I10 and EBV, knockdown of gankyrin decreases the oncogenic properties of gastric epithelial cells through the regulation of cell signaling genes. (A) Heat map showing the relative expression of cell cycle regulator (ccnd1, dapk3, pcna, and akt) and tumor suppressor (pten, apc, p53, and pRB) genes. (B) Expression profiles of abovementioned genes in gankyrin knockdown cells. (C and D) Furthermore, heat map showing the qRT-PCR results of relative transcript expression of gastric cancer (abl1, tff-2, and cdx-2) and DNA damage response (apaf1, bax, and bcl2) genes in all the studied infection models in sh-C vector control and sh-G gankyrin knockdown AGS cells, respectively, after 24 h of infection. The experiment was performed for two biological and two technical replicates, and the results are shown as the mean ± SD for two independent experiments.
FIG 10
FIG 10
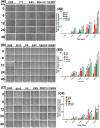
Coinfection by EBV and H. pylori enhanced the cell migratory properties of AGS cells, linked with the expression profiles of gankyrin. (AI) Representative image of scratch wound healing assay. First column shows the uninfected AGS cells. Second, third, fourth, and fifth columns show infection-I, -II, -III, and -IV, respectively, for 0, 6, 12, 24, and 48 h postinfection. (AII) Graphical representation of the number of cells migrated in the wound area. (BI) The image shows the scratch wound in the presence of sh-C vector control followed by infection-I to -IV. (BII) Relative number of cells migrated in the wound area. (CI) Image represents the relatively lower wound recovery in AGS cells during knockdown of gankyrin in AGS cells. (CII) Quantitative graphical representation of the number of cells migrated toward the wound area.
FIG 11
FIG 11
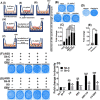
Expression profiles of gankyrin directly linked with tumorous properties of gastric epithelial cells. (A) (I) Uninfected AGS cells. (II) AGS cells with I10 infection. (III) AGS cells with only EBV infection. (IV) First infection by I10 for 6 h followed by second infection by EBV. (V) First infection by EBV for 6 h followed by second infection by I10. Selection of EBV-positive colonies with 2 μg/ml puromycin for 14 days. (B) Representative image of focus formation after following all the infection models. (C) Quantification and graphical representation of density of foci through the Image J software. (D) Further, we have validated focus formation results through the ectopic expression of gankyrin in AGS cells and selected the gankyrin-positive cells through 1 mg/ml Geneticin (G-418) for 14 days. Representative image of foci in exogenously overexpressed AGS cells. (E) Quantification and graphical representation of density of foci in exogenously overexpressed AGS cells through the Image J software. (F and G) Representative image shows the foci in AGS cells after the transfection of sh-C and sh-G, respectively, followed by the infection by I10 and EBV. (H) Moreover, the density of foci in sh-C is higher than in gankyrin knockdown cells. The experiment has been performed two times, and the results are shown as the mean ± SD from two independent experiments.
FIG 12
FIG 12
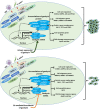
A model illustrating the association of gankyrin in I10- and EBV-mediated gastric cancer. This association drives the progression of I10- and EBV-mediated gastric cell transformation. Oncogenic activity of gankyrin is accelerated in the presence of pathogens which target the cell cycle regulators, cell migratory genes, gastric cancer markers, antiapoptotic genes, DNA damage response genes, and tumor suppressor genes. Besides coinfection-mediated and ectopic expression of gankyrin in AGS cells, knockdown of gankyrin in AGS cells decreased the oncogenic properties of gastric epithelial cells. Hence, gankyrin could be a potential oncogenic protein which may potentially be involved in the aggressiveness of gastric cancer mediated by I10 and EBV.

References

    1. Sitarz R, Skierucha M, Mielko J, Offerhaus GJA, Maciejewski R, Polkowski WP. 2018. Gastric cancer: epidemiology, prevention, classification, and treatment. Cancer Manag Res 10:239–248. doi:10.2147/CMAR.S149619. - DOI - PMC - PubMed
    1. Pandey S, Jha HC, Shukla SK, Shirley MK, Robertson ES. 2018. Epigenetic regulation of tumor suppressors by Helicobacter pylori enhances EBV-induced proliferation of gastric epithelial cells. mBio 9:e00649-18. doi:10.1128/mBio.00649-18. - DOI - PMC - PubMed
    1. de Souza CRT, Almeida MCA, Khayat AS, da Silva EL, Soares PC, Chaves LC, Burbano RMR. 2018. Association between Epstein-Barr virus, human papillomavirus and gastric adenocarcinomas. World J Gastroenterol 24:4928–4938. doi:10.3748/wjg.v24.i43.4928. - DOI - PMC - PubMed
    1. Salih BA. 2009. Helicobacter pylori infection in developing countries: the burden for how long? Saudi J Gastroenterol 15:201–207. doi:10.4103/1319-3767.54743. - DOI - PMC - PubMed
    1. Brown LM. 2000. Helicobacter pylori: epidemiology and routes of transmission. Epidemiol Rev 22:283–297. doi:10.1093/oxfordjournals.epirev.a018040. - DOI - PubMed

Publication types

MeSH terms

Substances