. 2021 Nov 12;18(sup2):684-698.
doi: 10.1080/15476286.2021.1978767. Epub 2021 Sep 29.

Prokaryotic rRNA-mRNA interactions are involved in all translation steps and shape bacterial transcripts

Affiliations

Prokaryotic rRNA-mRNA interactions are involved in all translation steps and shape bacterial transcripts

Shir Bahiri Elitzur et al. RNA Biol. .

Abstract

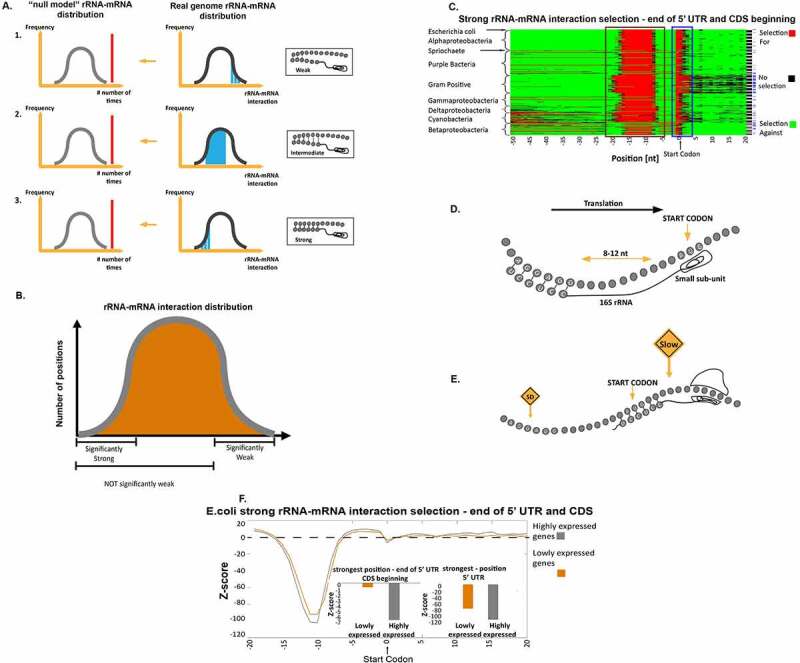
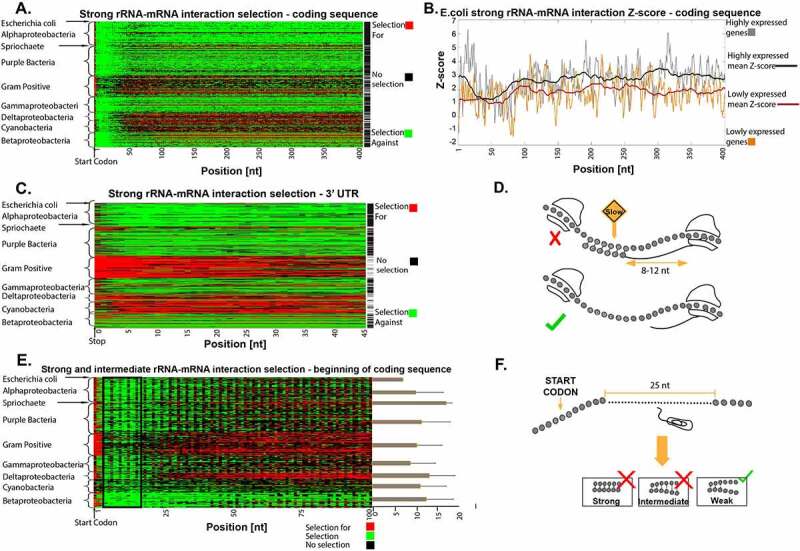
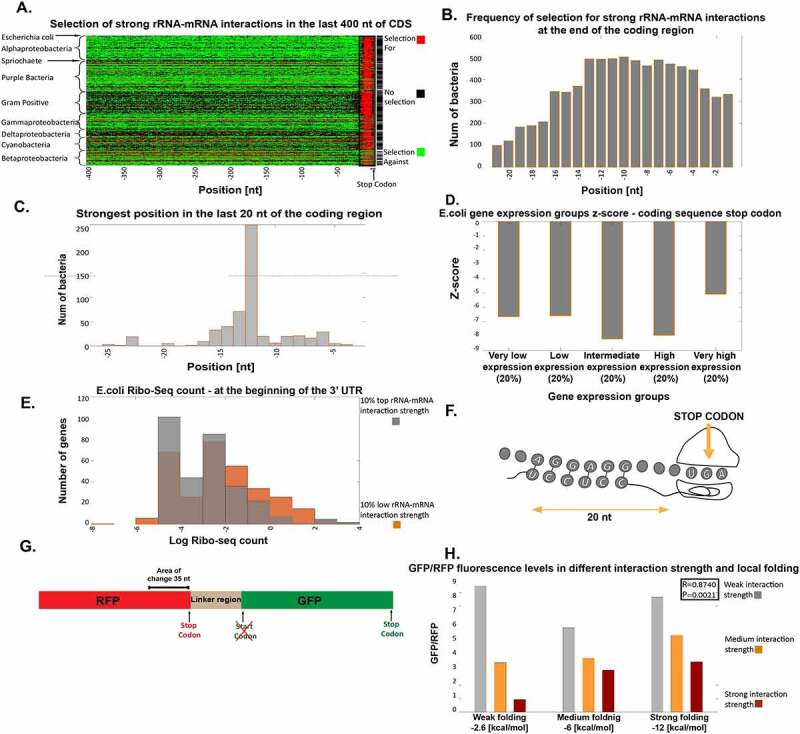
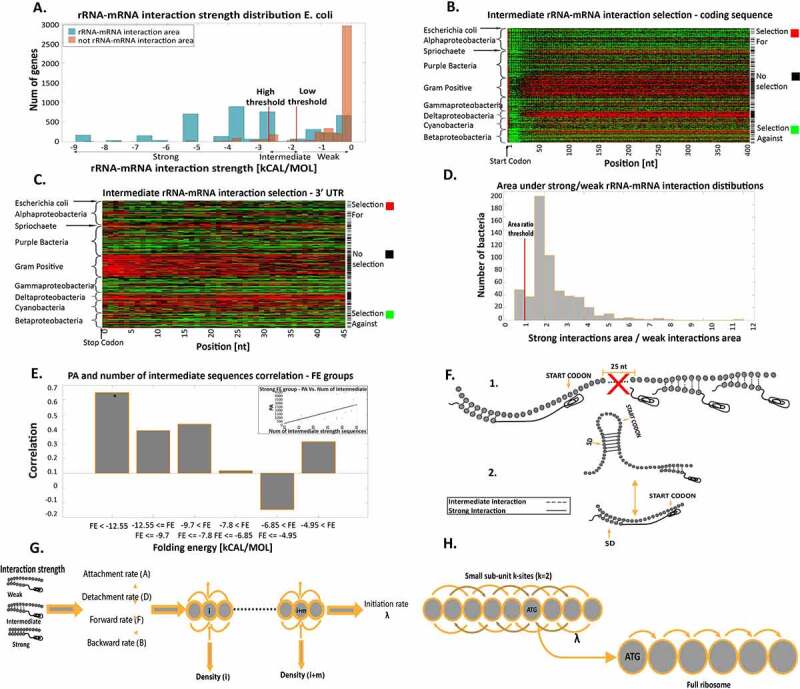
The well-established Shine-Dalgarno model suggests that translation initiation in bacteria is regulated via base-pairing between ribosomal RNA (rRNA) and mRNA. We used novel computational analyses and modelling of 823 bacterial genomes coupled with experiments to demonstrate that rRNA-mRNA interactions are diverse and regulate all translation steps from pre-initiation to termination. Previous research has reported the significant influence of rRNA-mRNA interactions, mainly in the initiation phase of translation. The results reported in this paper suggest that, in addition to the rRNA-mRNA interactions near the start codon that trigger initiation in bacteria, rRNA-mRNA interactions affect all sub-stages of the translation process (pre-initiation, initiation, elongation, termination). As these interactions dictate translation efficiency, they serve as an evolutionary driving force for shaping transcripts in bacteria while considering trade-offs between the effects of different interactions across different transcript regions on translation efficacy and efficiency. We observed selection for strong interactions in regions where such interactions are likely to enhance initiation, regulate early elongation, and ensure translation termination fidelity. We discovered selection against strong interactions and for intermediate interactions in coding regions and presented evidence that these patterns maximize elongation efficiency while also enhancing initiation. These finding are relevant to all biomedical disciplines due to the centrality of the translation process and the effect of rRNA-mRNA interactions on transcript evolution.

Keywords: Shine-Dalgarno; protein translation in bacteria; rRNA-mRNA interaction; translation elongation; translation initiation; translation termination.


Conflict of interest statement

The author(s) declare no conflict of interest.

Figures

Figure 1.
Figure 1.
Prediction of rRNA-mRNA interaction strength and selection for or against strong rRNA-mRNA interactions at the 5ʹUTR and at the beginning of the coding region. (a) The three statistical tests to detect evolutionary selection for different rRNA-mRNA interaction strengths (see Material and Methods section). 1. Enrichment of sub-sequences with weak rRNA-mRNA interactions (higher rRNA-mRNA interaction values, i.e. right tail of the distribution); 2. Enrichment of sub-sequences with intermediate rRNA-mRNA interactions (not weak and not strong rRNA-mRNA interaction values), and 3. Enrichment of sub-sequences with strong rRNA-mRNA interactions (lower rRNA-mRNA interaction values, i.e. the left tail of the distribution). We examined weak, intermediate, and strong rRNA-mRNA interaction strengths separately. In each case, we tested if their number or mean value was significantly higher than expected by the null mode rRNA-mRNA interaction values distribution. (b) Explanation of the statistical questions. The statistical questions we asked are not complementary to each other. (c) Results of the test for selection of strong interactions in the 5ʹUTR and first 20 nucleotides of the coding region. Each row represents a bacterium, rows are clustered based on phyla, and each column is a position in the transcripts of the analysed organisms. Red and green indicate a position with significant selection for and against strong rRNA-mRNA interaction compared to the null model, respectively. Black indicates a position with no significant selection (Material and Methods section). The second column from the right: a black pixel represents a bacterium. The number of positions with significant selection for strong interactions was significantly higher than the null model in the 5ʹUTR. Rightmost column: a blue pixel represents a bacterium for which the number of significant positions with selection for strong interactions was significantly higher than the null model in the last nucleotide of the 5ʹUTR and the first five nucleotides of the coding region. (d) An illustration of the way strong rRNA-mRNA interactions affect translation initiation: The rRNA-mRNA interactions upstream of the start codon initiate translation by aligning the small subunit of the ribosome to the canonical start codon. (e) An illustration of the suggested model: strong interactions at the first elongation steps slow down the ribosome movement. (f) Z-scores for rRNA-mRNA interaction strengths at the last 20 nucleotides of the 5ʹUTR and first 20 nucleotides of the coding regions in highly and lowly expressed E. coli genes. Lower/higher Z-scores indicate selection for/against strong rRNA-mRNA interactions, respectively, in comparison to what is expected by the null model. Highly and lowly expressed genes were selected according to protein abundance. Insets: two bar graphs of the Z-scores in highly and lowly expressed genes in the two regions of the reported signals
Figure 2.
Figure 2.
Selection for and against strong rRNA-mRNA interactions in the coding and 3ʹUTR regions. (a) The positions with selection for or against strong rRNA-mRNA interaction in the first 400 nt of coding regions. Each row represents a bacterium, the rows clustered by phyla, and each column is a position in the transcripts of the analysed organisms. Red/green indicates a position with significant selection for/against strong rRNA-mRNA interactions compared to the null model, respectively (Materials and Methods section). Black indicates positions with no significant selection. Rightmost column: black represents bacteria for which the number of positions with significant selection against strong interactions was significantly higher than the null model. (b) Z-score for rRNA-mRNA interaction strength at the first 400 nucleotides of the coding regions in highly and lowly expressed genes in E. coli. Lower/higher Z-scores mean stronger/weaker rRNA-mRNA interactions than the null model, respectively. The bold black/red lines represent a 40-nucleotide moving average in highly/lowly expressed genes, respectively. (c) Positions with selection for or against strong rRNA-mRNA interaction strength in the 3ʹ UTR. Each row represents a bacterium. The rows are clustered by phyla, and each column is a position in the bacteria’s transcript. Red/green indicates a position with significant selection for/against strong rRNA-mRNA interactions relative to the null model, respectively (Materials and Methods section). Black indicates position with no significant selection. Rightmost column: black represents bacteria for which the number of significant positions with selection against strong interactions is significantly higher than in the null model. (d) The effect of strong rRNA-mRNA interactions in the coding region on translation elongation: such interactions can slow down ribosome movement and retard translation. (e) Positions with significant strong and intermediate rRNA-mRNA interaction distribution in the first 100 nt of the coding region. Each row represents a bacterium, the rows are clustered by phyla, and each column is a transcript position. Red/green indicates a position with significant selection for/against strong and intermediate rRNA-mRNA interactions compared to the null model, respectively (Materials and Methods section). Black indicates position with no significant selection. Bars at the right of the plot show: for each bacterium, we calculated in a sliding window of 40 nucleotides the number of positions with selection against strong and intermediate interactions. The bars represent the average number of windows at the beginning of the coding region that had more selection against strong and intermediate interactions than the rest of the transcript, averaged by phylum. Lines extending from bars represent standard deviations (the signal’s periodicity is related to the genetic code). (f) An illustration of our model: strong and intermediate interactions at the first 25 nucleotides can be deleterious and can promote initiation from erroneous positions
Figure 3.
Figure 3.
Selection for/against strong rRNA-mRNA interactions at the end of the coding region. (a) Selection for or against strong rRNA-mRNA interaction in the last 400 nt of the coding regions. Each row represents a bacterium, rows are clustered by phyla, and each column is a position in the bacterial transcript. Red/green indicates positions with significant selection for/against strong rRNA-mRNA interaction compared to the null model, respectively (Materials and Methods section). Black indicates positions with no significant selection. Rightmost column: black pixels represent bacteria where the number of significant positions with selection for strong interactions was significantly higher than the null model. (b) The number of bacteria with significant selection for strong rRNA-mRNA interactions in each of the last 20 nt of the coding region. (c) Distribution of the position with the lowest rRNA-mRNA interaction Z-score, indicating the strongest rRNA-mRNA interaction, in the last 20 nt of the coding region among the analysed bacteria. (d) Mean of the lowest Z-score for rRNA-mRNA interaction strength among the last 20 nucleotides of the coding region for groups of genes classified according to gene expression levels. (e) Ribo-seq analysis: average Ribo-seq read count distribution at the beginning of the 3ʹUTR for genes with strong (grey bars) vs. weak (orange bars) rRNA-mRNA interactions at the end of the coding sequence (Material and Methods section). (f) An illustration of our model: strong interactions at the end of the coding region enhance the accurate recognition of the stop codon and aid in translation termination. (g) The experiment construct, an RFP gene connected to a GFP gene. We tested the effect of different rRNA-mRNA interaction strengths in the last 35 nt of the RFP gene by creating variants with different folding in the last 40 nt. (h) Bar graph of values proportional to GFP/RFP fluorescence levels in the nine variants (see Material and Methods section) grouped according to their local folding energies in the log phase
Figure 4.
Figure 4.
Selection for/against intermediate rRNA-mRNA interactions in the coding and UTR regions. (a) Definition and threshold validation for intermediate-strength rRNA-mRNA interactions in E. coli. Two distributions are shown: 1. blue bars: maximum rRNA-mRNA interaction strength distribution of the interaction strength region related to region 1 (see main text). 2. Orange bars: maximum rRNA-mRNA interaction strength distribution in the weak interaction region (related to region 2) (see main text). Thresholds for defining intermediate interactions for this organism are also depicted. (b) Positions with selection for high/low number of intermediate rRNA-mRNA interactions in the first 400 nt of the coding regions. Rows represent individual bacteria and are clustered by phyla; each column is a transcript position. Red/green indicate positions with significant selection for/against intermediate rRNA-mRNA interaction relative to the null model, respectively (Material and Methods section). Black indicates positions with no significant selection. Rightmost column: black pixels represent bacteria where the number of positions with significant selection for intermediate interactions is significantly higher than the null model. (c) Positions with selection for high/low number of intermediate rRNA-mRNA interactions in the 3ʹ UTR. Rows represent bacteria clustered by phyla; each column is a transcript position. Red/green indicates positions with significant selection for/against intermediate rRNA-mRNA interactions relative to the null model, respectively (Materials and Methods section). Rightmost column: black pixels represent bacteria where the number of positions with significant selection for intermediate interaction is significantly higher than the null model. (d) Distribution of the area ratio. A ratio larger than 1 suggests that it is more probable that the inferred thresholds are related to (intermediate) rRNA-mRNA interactions and not to a lack of interaction. (e) The number of intermediate sequences and PA correlations in GFP synonymous variants. The GFP variants are divided into six groups according to their FE near the start codon. The FE thresholds were selected to have approximately equal numbers of GFP variants in each group. Groups with significant correlation are marked with *. Inset: correlation between PA and the number of intermediate interaction sequences for the strongest FE group. (f) Illustration of intermediate interaction effects on translation initiation. 1) Intermediate interactions in the coding sequence. 2) This aids initiation when strong mRNA folding in the region surrounding the START codon (i.e. when initiation is more rate-limiting). (g) An illustration of the biophysical model. its rRNA-mRNA interaction strength determines each site’s parameters. There is an attachment rate to the site, detachment rate from the site, movement forward to the site and from it, and movement backward from the site and to it. This model allows for the deduction of the initiation rate for insertion into the elongation model. (h) An illustration of the rRNA-mRNA interaction strength extended model. k sites determine the density of each site before it and k sites after it. (Materials and Methods and Figure S7)

References

    1. Shine J, Dalgarno L.. Determinant of cistron specificity in bacterial ribosomes. Nature. 1975;254(5495):34–38. - PubMed
    1. Kozak M. Initiation of translation in prokaryotes and eukaryotes. Gene. 1999;234(2):187–208. - PubMed
    1. Nakagawa S, Niimura Y, Miura KL, et al. Dynamic evolution of translation initiation mechanisms in prokaryotes. Proc Natl Acad Sci. 2010;107(14):6382–6387. - PMC - PubMed
    1. Shine J, Dalgarno L. The 3’-Terminal sequence of escherichia coli 16S Ribosomal RNA: complementarity to nonsense triplets and ribosome binding sites. Proc Natl Acad Sci. 1974;71(4):1342–1346. - PMC - PubMed
    1. Li GW, Oh E, Weissman JS. The anti-Shine–Dalgarno sequence drives translational pausing and codon choice in bacteria. Nature. 2012;484(7395):538–541. - PMC - PubMed

Publication types

MeSH terms