. 2021 Dec 6;218(12):e20211035.
doi: 10.1084/jem.20211035. Epub 2021 Sep 29.

Activated PI3Kδ signals compromise plasma cell survival via limiting autophagy and increasing ER stress

Affiliations

Activated PI3Kδ signals compromise plasma cell survival via limiting autophagy and increasing ER stress

Fahd Al Qureshah et al. J Exp Med. .

Abstract

While phosphatidylinositide 3-kinase delta (PI3Kδ) plays a critical role in humoral immunity, the requirement for PI3Kδ signaling in plasma cells remains poorly understood. Here, we used a conditional mouse model of activated PI3Kδ syndrome (APDS), to interrogate the function of PI3Kδ in plasma cell biology. Mice expressing a PIK3CD gain-of-function mutation (aPIK3CD) in B cells generated increased numbers of memory B cells and mounted an enhanced secondary response but exhibited a rapid decay of antibody levels over time. Consistent with these findings, aPIK3CD expression markedly impaired plasma cell generation, and expression of aPIK3CD intrinsically in plasma cells was sufficient to diminish humoral responses. Mechanistically, aPIK3CD disrupted ER proteostasis and autophagy, which led to increased plasma cell death. Notably, this defect was driven primarily by elevated mTORC1 signaling and modulated by treatment with PI3Kδ-specific inhibitors. Our findings establish an essential role for PI3Kδ in plasma cell homeostasis and suggest that modulating PI3Kδ activity may be useful for promoting and/or thwarting specific immune responses.


Conflict of interest statement

Disclosures: The authors declare no competing interests exist.

Figures

None
Graphical abstract
Figure S1.
Figure S1.
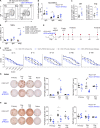
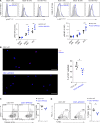
Characterization of development and function of MBCs in CD21-aPIK3CD mice. (A–C) Splenocytes from CD21-WT and CD21-aPIK3CD mice were stained first with a decoy reagent (PE-AF647) to exclude cells binding to the AF647 before adding VLP-AF647. Anti-AF647 magnetic beads were used to enrich both decoy-specific and VLP-specific B cells. (A) Gating strategy to identify VLP-specific MBCs at day 90 after immunization with VLP-ssRNA in CD21-WT versus CD21-aPIK3CD mice. Total live B220+ and CD138+ splenic B cells identified after excluding CD3+F4/80+ non-B cells and enrichment with VLP-Af647 and decoy (PE-Af647; left panels). VLP-specific B cells were identified as B220+CD138 (middle panels). Memory/naive B cells were identified as CD38+GL7. (B) Frequency of VLP-specific IgM, IgD, and switched MBCs at day 90 after immunization. (C) Flow cytometry analysis of CD73 and CD80 on VLP-specific IgD, IgM, and switched MBCs. (D) Dilution curves of anti-VLP-IgM in sera of mice primary-only mice or mice at days 3 or 5 after challenge as measured by ELISA. (E) Number of VLP-specific IgM spots per 2 × 10⁶ cells from the spleen (left) and BM (right) in primary-only mice or mice at 5 d after challenge. Data are combined from two (B: n = 7; D and E: n = 6) independent experiments. Significance determined by two-way ANOVA multiple comparison. *, P < 0.05. Graphs depict mean ± SEM.
Figure 1.
Figure 1.
Enhanced MBC numbers and altered rechallenge response in CD21-aPIK3CD mice. (A) Flow cytometry analysis of enriched VLP-specific MBCs isotypes: IgM, IgD, and switched (swIg; gated within GL7CD38+; see Fig. S1) at 90 d after immunization with VLP-ssRNA in CD21-WT and CD21-aPIK3CD mice. (B) Number of VLP-specific IgM, IgD, and switched MBCs 90 d after immunization. (C) Number of CD73+ CD80+ VLP-specific IgM and switched MBCs at 90 d after immunization. (D) Ratio of CD45.2/CD45.1/2 VLP-specific, IgM, IgD, and switched MBCs in mixed BM chimeras of generated using CD45.2 AID-WT: CD45.1/2 AID-WT (1:1) or CD45.2 AID-aPIK3CD/CD45.1/2 AID-WT (1:1), respectively, at 90 d after immunization with VLP-ssRNA. (E) Schematic diagram of rechallenge experiments. CD21-WT and CD21-aPIK3CD mice were immunized intraperitoneally with VLP-ssRNA. 90 d later, mice were rechallenged with an empty (RNA-free) VLP (designated after challenge) or left unchallenged (designated primary only). Mice were bled at indicated time points, and specific cohorts were sacrificed for tissue analysis at 5 or 90 d after rechallenge. (F) Dilution curves of VLP-specific IgG2c prechallenge and at day (D) 3, 5, 21, 60, or 90 after challenge as measured by ELISA. (G) Representative images of VLP-specific IgG2c ELISPOT analysis using splenic cells from primary only or splenic cells collected at day 5 or 90 after challenge from CD21-WT or CD21-aPIK3CD mice (left). Number of VLP-specific IgG2c spots per 2.5 × 10⁵ cells (middle) and the average spots size (right). (H) Representative images of VLP-specific IgG2c ELISPOTs using BM cells from primary only or BM cells collected at day 5 or 90 after challenge from CD21-WT or CD21-aPIK3CD mice (left), number of VLP-specific IgG2c spots per 106 (middle), and average spot size (right). Data are combined from two independent experiments (A–C: n = 7; D: n = 5; F–H: n = 4–6). ELISPOT images (G and H) are representative of two independent experiments. Significance determined by two-way ANOVA multiple comparison (B, D, G, and H) or unpaired Student’s t test (C). *, P < 0.05; **, P < 0.01; ****, P < 0.0001. Graphs depict mean ± SEM.
Figure 2.
Figure 2.
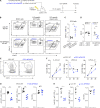
B cell–intrinsic expression of activated PI3Kδ impairs PC generation. (A) Flow cytometry analysis of intracellular VLP staining in splenic CD138+ PCs (left) and frequency and absolute number of VLP-specific PCs (right) in CD21-WT or CD21-aPIK3CD mice at day 14 after immunization with VLP-ssRNA. (B and C) Quantification of IgG2c and IgM VLP-specific PCs as measured by flow cytometry. (D) Number of VLP-specific IgM, IgG, and IgG2c PCs in the spleen (left) and BM (right) determined by ELISPOT assay. (E) The ratio of VLP-specific PC to VLP-specific GC B cells at day 14 after immunization with VLP-ssRNA in mixed BM chimera recipients (previously transplanted with 1:1 ratio of CD45.2 AID-WT/CD45.1/2 AID-WT or CD45.2 AID-aPIK3CD/CD45.1/2 AID-WT BM cells, respectively). (F) Percentage of CD138+ ASCs generated over time from CD21-WT versus CD21-aPIK3CD B cells cultured in vitro on 40LB stroma plus R848 and IL-21. Data are combined from two (A–D: n = 6; E: n = 5) or three (F: n = 3–5 at each time point) independent experiments. Significance determined by unpaired Student’s t test. **, P < 0.01; ***, P < 0.001; ****, P < 0.0001. Graphs depict mean ± SEM.
Figure S2.
Figure S2.
GC response in B cell–intrinsic aPIK3CD model. (A) Left plots show representative flow cytometry analysis of GL7+CD38 GC B cells (initially gated on B220+ cells) in the spleen of 12- to 14-wk-old CD21-WT and CD21-aPIK3CD mice at day 14 d after intraperitoneal immunization with VLP-ssRNA. Right graphs show frequency and absolute numbers of GC B cells. (B) Left plots show representative flow cytometry analysis of VLP-specific B cells within GC in mice as described in A. Right graphs show the frequency and absolute numbers of VLP GC B cells. (C) Left plots show representative flow cytometry analysis of IgG2c+ VLP+ GC B cells. Right graphs show the frequency and absolute numbers of IgG2c+ VLP+ GC B cells. Data are combined from two independent experiments (n = 6). Significance determined by unpaired Student’s t test. *, P < 0.05. Graphs depict mean ± SEM.
Figure S3.
Figure S3.
TD humoral response in BM chimera and different B cell–intrinsic models. (A) Schematic of the BM chimera experiments. A 1:1 ratio mixture of CD45.2 AID-WT and CD45.1/2 AID-WT or CD45.2 AID-aPIK3CD and CD45.1/2 AID-WT BM cells, respectively, were transferred to irradiated CD45.1 WT hosts. 12 wk after hematopoietic reconstitution, chimeras were immunized with VLP-ssRNA and analyzed 14 d after immunization. (B) Flow cytometry analysis of CD45.2 and CD45.1.2 staining within total B cells (left), VLP-specific GL7+CD38 GC B cells (middle), and VLP-specific CD138+ PCs (right). (C) Ratio of CD45.2 to CD45.1.2 VLP-specific GC B cells in BM chimeras. (D) Ratio of DZ (CXCR4+CD86) to LZ (CXCR4CD86+) within GC in BM chimeras. (E) Flow cytometry analysis of CD138+ ASCs derived from CD21-WT versus CD21-aPIK3CD B cells cultured on 40LB stroma and stimulated with R848 and IL-21 for 6 d. (F) Percentage of CD138+ ASCs at days 4, 6, and 8 following cultures of CD21-WT versus CD21-aPIK3CD B cells on 40LB stroma and stimulated with IL-4 for 4 d followed by addition of IL-21 for 2 or 4 d (left), stimulated with LPS + IL-21 (middle), or stimulated with LPS + IL-21 (right). (G and H) AID-WT or AID-aPIK3CD mice or Cγ1-WT and Cγ1-aPIK3CD were immunized with NP-CGG in alum and serum collected at day 14 after immunization. (G) Total (NP30; left) and high-affinity (NP4; middle) NP-specific IgG1 measured by ELISA in AID-WT and AID-aPIK3CD mice. Right: Ratio of high-affinity to total NP-specific IgG1 (NP4:NP30). (H) Total (NP30; left) and high-affinity (NP4; middle) NP-specific IgG1 in Cγ1-WT versus Cγ1-aPIK3CD mice. Right: Ratio of high-affinity to total NP-specific IgG1 (NP4:NP30). Data are combined from two independent experiments (C and D: n = 5; F: n = 3; G: n = 6; H: n = 4). Significance determined by unpaired Student’s t test. *, P < 0.05; **, P < 0.01; ***, P < 0.001; ****, P < 0.0001. Graphs depict mean ± SEM.
Figure S4.
Figure S4.
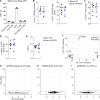
GC response in PC-intrinsic aPIK3CD model and gene expression analysis in naive and GC B cells. (A) Frequency of YFP+ cells within splenic naive B cells (B220+CD19+GL7CD38+CD138), GC B cells (B220+CD19+GL7+CD38CD138), PCs (CD138+), T cells (CD3+), and non-B/non-T cells (B220CD19CD3CD138) in Blimp1-Cre Rosa-stop-flox-EYFP mice, immunized with VLP-ssRNA and analyzed at day 14 after immunization. (B) Frequency and absolute numbers of splenic GL7+CD38 GC B cells (among B220+ cells) in Blimp1Cre-WT versus Blimp1Cre-aPIK3CD mice analyzed at day 14 after immunization. (C) Frequency of VLP-specific GC B cells. (D) Frequency of IgG2c+ VLP-specific GC B cells. (E) Ratio of DZ (CXCR4+CD86) to LZ (CXCR4CD86+) within GC in mice of the indicated genotype. (F) Principal-component (PC) analysis of the RNA-seq gene expression profile of naive B cells, DZ and LZ GC B cells, and PC populations sorted from AID-WT and AID-aPIK3CD mice 14 d after immunization with NP-CGG/alum. (G–I) Volcano plots representing differential expression analysis for genes in naive B cells (G), DZ B cells (H), and LZ B cells (I). RNA-seq data (A–D) were obtained from four mice (n = 4) for each genotype; each symbol represents an individual mouse in A. Data are combined from two independent experiments (A: n = 3; B–E: n = 6). Graphs depict mean ± SEM.
Figure 3.
Figure 3.
PC-intrinsic aPIK3CD expression alters the primary humoral response. (A) Frequency and absolute number of splenic, VLP-specific, CD138+ PCs in Blimp1-WT versus Blimp1-aPIK3CD mice at day 14 after immunization with VLP-ssRNA. (B and C) Quantification of IgM and IgG2c VLP-specific PCs as in A measured by flow cytometry. (D) Number of VLP-specific IgM, IgG, and IgG2c PCs in the spleen (upper) and BM (lower) determined by ELISPOT assay. (E) Dilution curves of VLP-IgM, IgG, and IgG2c from serum of immunized (filled) and unimmunized mice (open) measured by ELISA. Data are combined from two independent experiments (n = 6). Significance determined by unpaired Student’s t test of individual groups in A–D or of area under the curve in E. *, P < 0.05; **, P < 0.01; ***, P < 0.001. Graphs depict mean ± SEM.
Figure 4.
Figure 4.
Altered gene expression in aPIK3CD PCs. (A) Volcano plot displays the differential gene expression of AID-aPIK3CD versus AID-WT PCs at day 14 after immunization with NP-CGG/alum. Genes in red indicate adjusted P (padj) < 0.05. (B) Hallmark GSEA for RNA-seq data shown in a showing selected enrichments aPIK3CD PCs with normalized enrichment score (NES) and −log10 P value. (C) Gene ontology (GO) analysis showing selected enrichments with normalized enrichment score and −log10 P value. RNA-seq data represent four mice (n = 4) for each genotype.
Figure 5.
Figure 5.
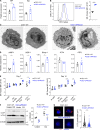
aPIK3CD disrupts ER homeostasis and autophagy. (A) Quantitative RT-PCR analysis of transcripts encoding BiP and PDI in CD138+ PCs derived from CD21-WT and CD21-aPIK3CD B cells following 6 d of in vitro culture on 40LB stroma with R848 + IL-21. mRNA expression was quantified relative to the housekeeping gene histone H3. (B) Flow cytometry analysis of ER-Tracker staining in CD138+ ASCs. Representative histogram overlays (left) and quantification of mean fluorescence intensities (MFI; right). (C) Representative electron microscopy images of CD21-WT and CD21-aPIK3CD ASCs sorted from in vitro cultures (scale bars = 1 µm). (D) Quantitative RT-PCR analysis of transcripts encoding spliced XBP-1 (sXBP-1), total XBP-1 (tXBP-1), Blimp-1, ATF4, and ATF6 in CD138+ PCs from in vitro cultures. mRNA expression was quantified relative to histone H3. (E) MFI of ER-Tracker in B220+ B cells, polyclonal CD138+ PCs, and VLP-specific CD138+ PCs from CD21-WT and CD21-aPIK3CD mice at day 7 or 14 after immunization with VLP-ssRNA. (F) Left: Immunoblot analysis of LC3-II in CD21-WT and CD21-aPIK3CD B cells FACS-sorted after 4 d of in vitro culture and left untreated or treated with chloroquine (CQ) for 90 min. β-Actin serves as a loading control. Right: Quantification of LC3-II band intensity with or without treatment with chloroquine, presented relative to β-actin. (G) Left: Representative fluorescence images showing LC3+ puncta in CD21-WT and CD21-aPIK3CD B cells generated as in E. Right, automated quantification of LC3+ puncta size using ImageJ (scale bars = 5 µm). Data are combined from two independent experiments (A and D: n = 3; B and F: n = 4; E: n = 5–6; G: n = 2). Significance determined by unpaired Student’s t test. *, P < 0.05; **, P < 0.01; ***, P < 0.001; ****, P < 0.0001. Graphs depict mean ± SEM.
Figure S5.
Figure S5.
Impact of aPIK3CD on autophagy and survival of activated B cells. (A) Intracellular staining of phosphorylated Akt (T308, left) and S6 (S235/236, right) in non-B cells, B cells, and total CD138+ PCs from CD21-WT and CD21-aPIK3CD mice at day 14 after immunization with VLP-ssRNA. Representative histogram overlays (top) and quantification of MFI (bottom). (B) Left: Representative images of LC3 (red) and Hoechst (blue) staining of FACS-sorted CD21-aPIK3CD or CD21-WT B cells following 4 d of in vitro culture on 40LB stroma and stimulation with R848 and IL-21 (scale bars = 25 µm). Right: Quantification of LC3+ cells per field. (C) Representative flow cytometry analysis (left) and frequency (right) of apoptotic (caspase+ 7-AAD) activated B cells (CD19+CD138) derived from CD21-WT versus CD21-aPIK3CD B cells following 6 d of in vitro culture on 40LB stroma and stimulation with R848 and IL-21. (D) Representative flow cytometry (left) and frequency (right) of TUNEL+ activated B cells (CD19+CD138) cells generated as in C. Data are combined from two independent experiments (B–D: n = 4). Significance determined by unpaired Student’s t test (B–D). *, P < 0.05; **, P < 0.01; ***, P < 0.001. Graphs depict mean ± SEM.
Figure 6.
Figure 6.
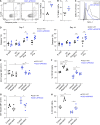
aPIK3CD promotes PC death. (A) Representative flow cytometry analysis (left) and frequency (right) of apoptotic (caspase+ 7-AAD) CD138+ ASCs derived from CD21-WT versus CD21-aPIK3CD B cells following 6 d of in vitro culture on 40LB stroma and stimulation with R848 and IL-21. (B and C) Frequency of TUNEL+ apoptotic cells (B) and intracellular expression of MCL1 (C) within CD138+ ASC generated as in A. (D) Frequency of caspase+ 7-AAD apoptotic B cells, polyclonal PCs, and VLP-specific PCs from CD21-WT and CD21-aPIK3CD mice at day 7 or 14 after immunization with VLP-ssRNA. (E and F) CD21-WT and CD21-aPIK3CD B cells were cultured on 40LB stroma with R848 and IL-21. At day 4 in culture (48 h before analysis), vehicle (DMSO), idelalisib (100 nM), or rapamycin (0.5 nM) was added to the cultures. (E) MFI of ER-Tracker in CD138+ ASCs and (F) percentage of CD138+ ASCs at day 6. (G and H) CD21-WT and CD21-aPIK3CD B cells were cultured on 40LB stroma with R848 and IL-21. At day 4, cultures were serum starved for 48 h. MFI of ER-Tracker in CD138+ ASCs (G) and percentage of CD138+ ASCs (H) at day 6. Data are combined from two independent experiments (A, B, and E–H: n = 4; D: n = 5–6) or representative of two independent experiments (C). Significance determined by unpaired Student’s t test (A and B) or multiple comparison (D–H). *, P < 0.05, **, P < 0.01; ***, P < 0.001; ****, P < 0.0001. Graphs depict mean ± SEM.

References

    1. Angulo, I., Vadas O., Garçon F., Banham-Hall E., Plagnol V., Leahy T.R., Baxendale H., Coulter T., Curtis J., Wu C., et al. . 2013. Phosphoinositide 3-kinase δ gene mutation predisposes to respiratory infection and airway damage. Science. 342:866–871. 10.1126/science.1243292 - DOI - PMC - PubMed
    1. Arnold, J., Murera D., Arbogast F., Fauny J.D., Muller S., and Gros F.. 2016. Autophagy is dispensable for B-cell development but essential for humoral autoimmune responses. Cell Death Differ. 23:853–864. 10.1038/cdd.2015.149 - DOI - PMC - PubMed
    1. Auner, H.W., Beham-Schmid C., Dillon N., and Sabbattini P.. 2010. The life span of short-lived plasma cells is partly determined by a block on activation of apoptotic caspases acting in combination with endoplasmic reticulum stress. Blood. 116:3445–3455. 10.1182/blood-2009-10-250423 - DOI - PubMed
    1. Avery, D.T., Kane A., Nguyen T., Lau A., Nguyen A., Lenthall H., Payne K., Shi W., Brigden H., French E., et al. . 2018. Germline-activating mutations in PIK3CD compromise B cell development and function. J. Exp. Med. 215:2073–2095. 10.1084/jem.20180010 - DOI - PMC - PubMed
    1. Benhamron, S., Pattanayak S.P., Berger M., and Tirosh B.. 2015. mTOR activation promotes plasma cell differentiation and bypasses XBP-1 for immunoglobulin secretion. Mol. Cell. Biol. 35:153–166. 10.1128/MCB.01187-14 - DOI - PMC - PubMed

Publication types

MeSH terms

Substances